本文主要是介绍GEE16: 区域日均降水量计算及分析,希望对大家解决编程问题提供一定的参考价值,需要的开发者们随着小编来一起学习吧!
Precipitation
- 1. 区域日均降水量计算
- 2. 降水时间序列
- 3. 降水数据年度时间序列对比分析
- 4. 降水等值线绘制
1. 区域日均降水量计算
今天分析一个计算区域日均降水量的方法:
数据信息:
Climate Hazards Group InfraRed Precipitation with Station data (CHIRPS) is a 30+ year quasi-global rainfall dataset. CHIRPS incorporates 0.05° resolution satellite imagery with in-situ station data to create gridded rainfall time series for trend analysis and seasonal drought monitoring.
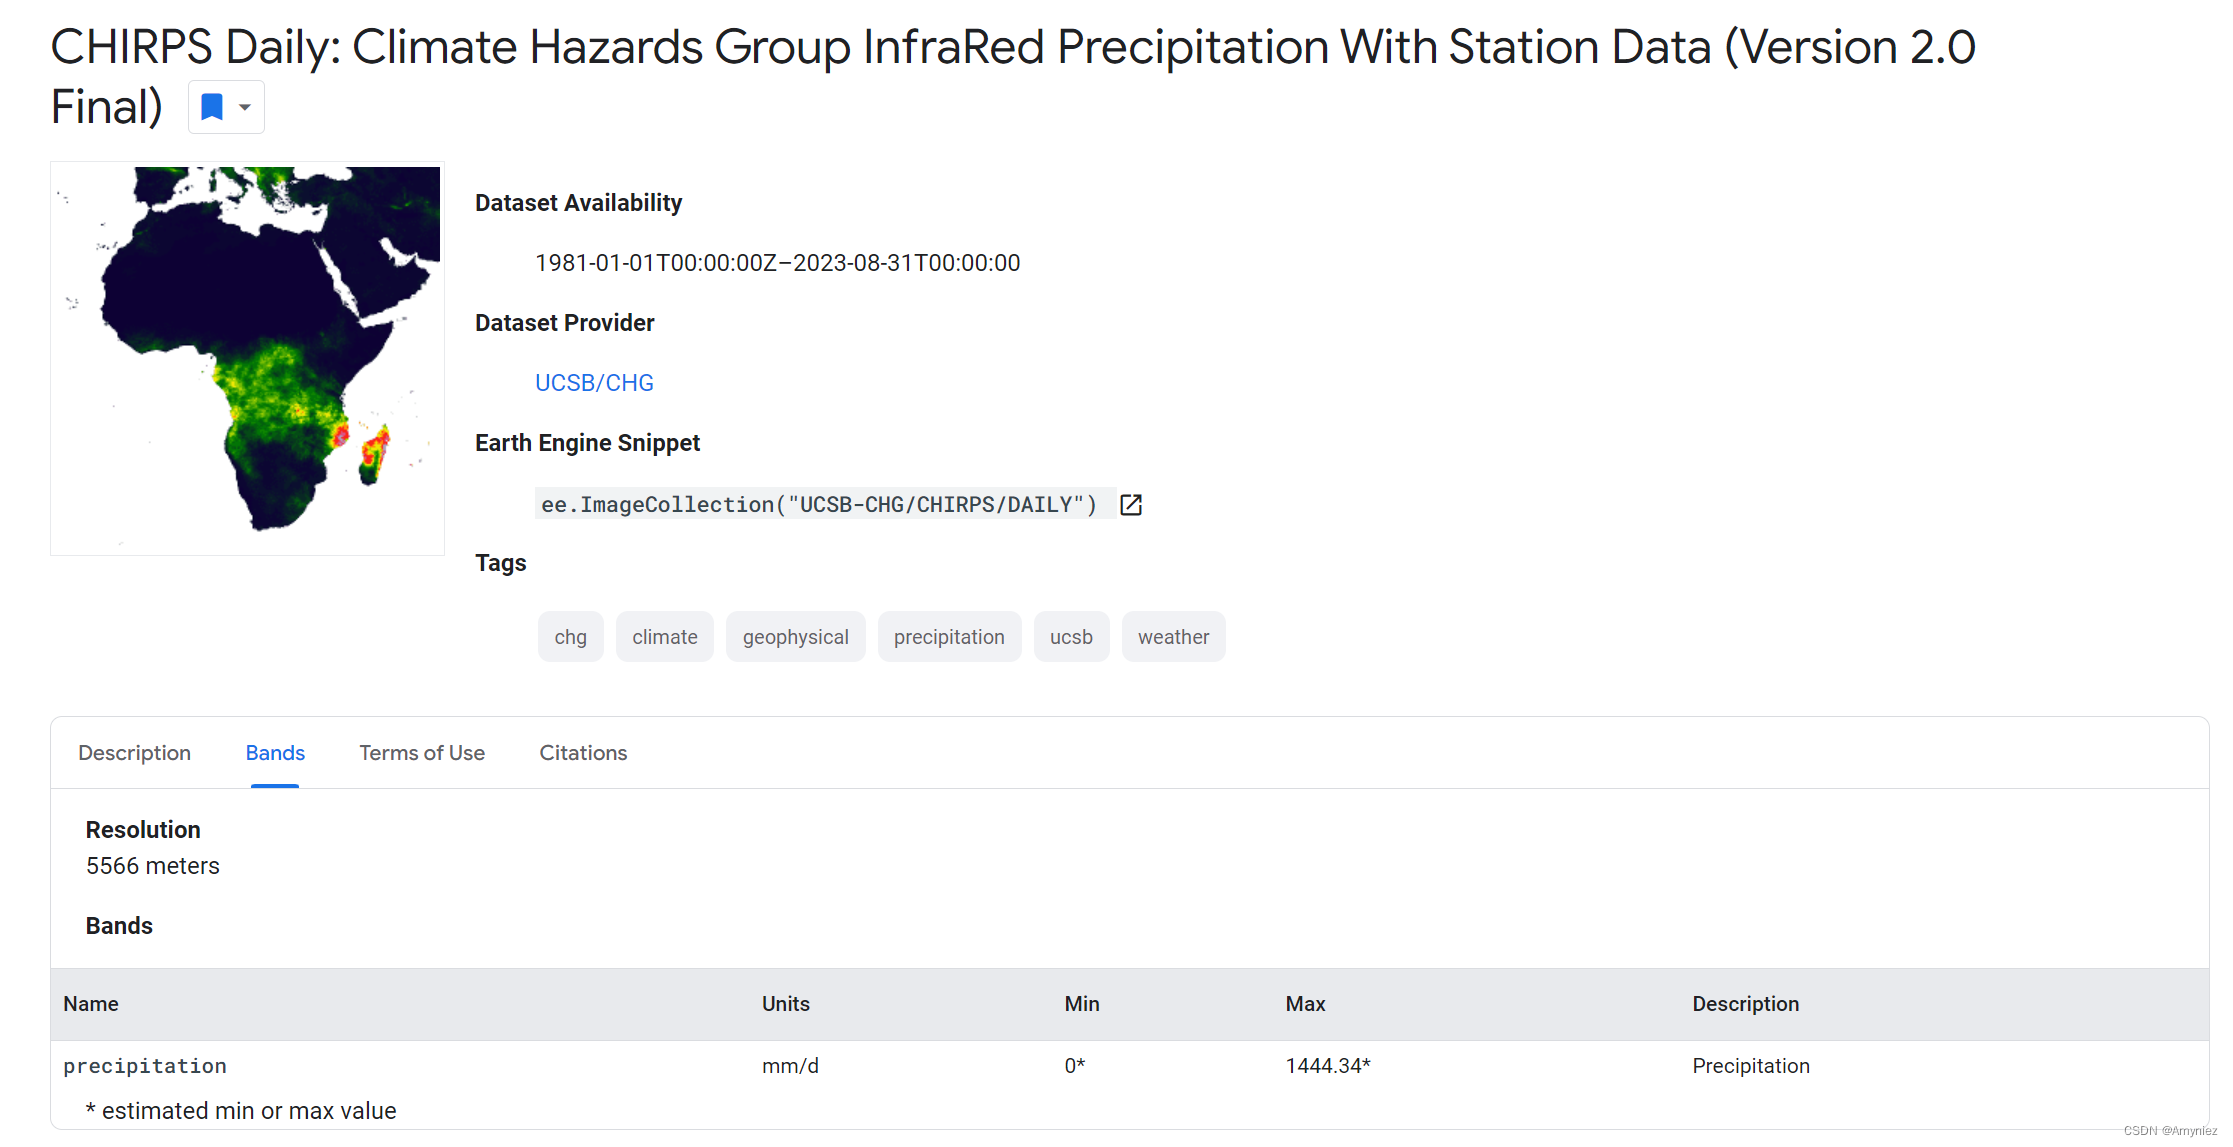
var startDate = ee.Date('2022-01-01');
var endDate = ee.Date('2023-01-01');// 以重庆为目标
var geometry = ee.FeatureCollection('projects/ee-*****736/assets/Chongqing_Province')
Map.centerObject(geometry,5)
var styling = {color:"red",fillColor:"00000000"}
Map.addLayer(geometry.style(styling),{},"geometry")
var geometry = geometry.geometry()var dataset = ee.ImageCollection("UCSB-CHG/CHIRPS/DAILY").filterDate(startDate, endDate);var list_dataset = dataset.toList(dataset.size());
print(list_dataset);// 计算区域内的日平均值
var getPrecipitation = function(image) {var value_precipit = ee.Image(image).reduceRegion(ee.Reducer.mean(), geometry).get('precipitation');var precipit_mm = ee.Number(value_precipit); return precipit_mm;
};// 输出每日平均降水量(mm)
var count = dataset.size();
var precipit_list = dataset.toList(count).map(getPrecipitation);
print("precipitation list", precipit_list);// 输出所有日期
var allDates = ee.List(dataset.aggregate_array('system:time_start'));
var allDatesSimple = allDates.map(function(date){return ee.Date(date).format().slice(0,10);});
print('allDates',allDatesSimple);// 将日期与降水数据组合
var paired = allDatesSimple.zip(precipit_list);
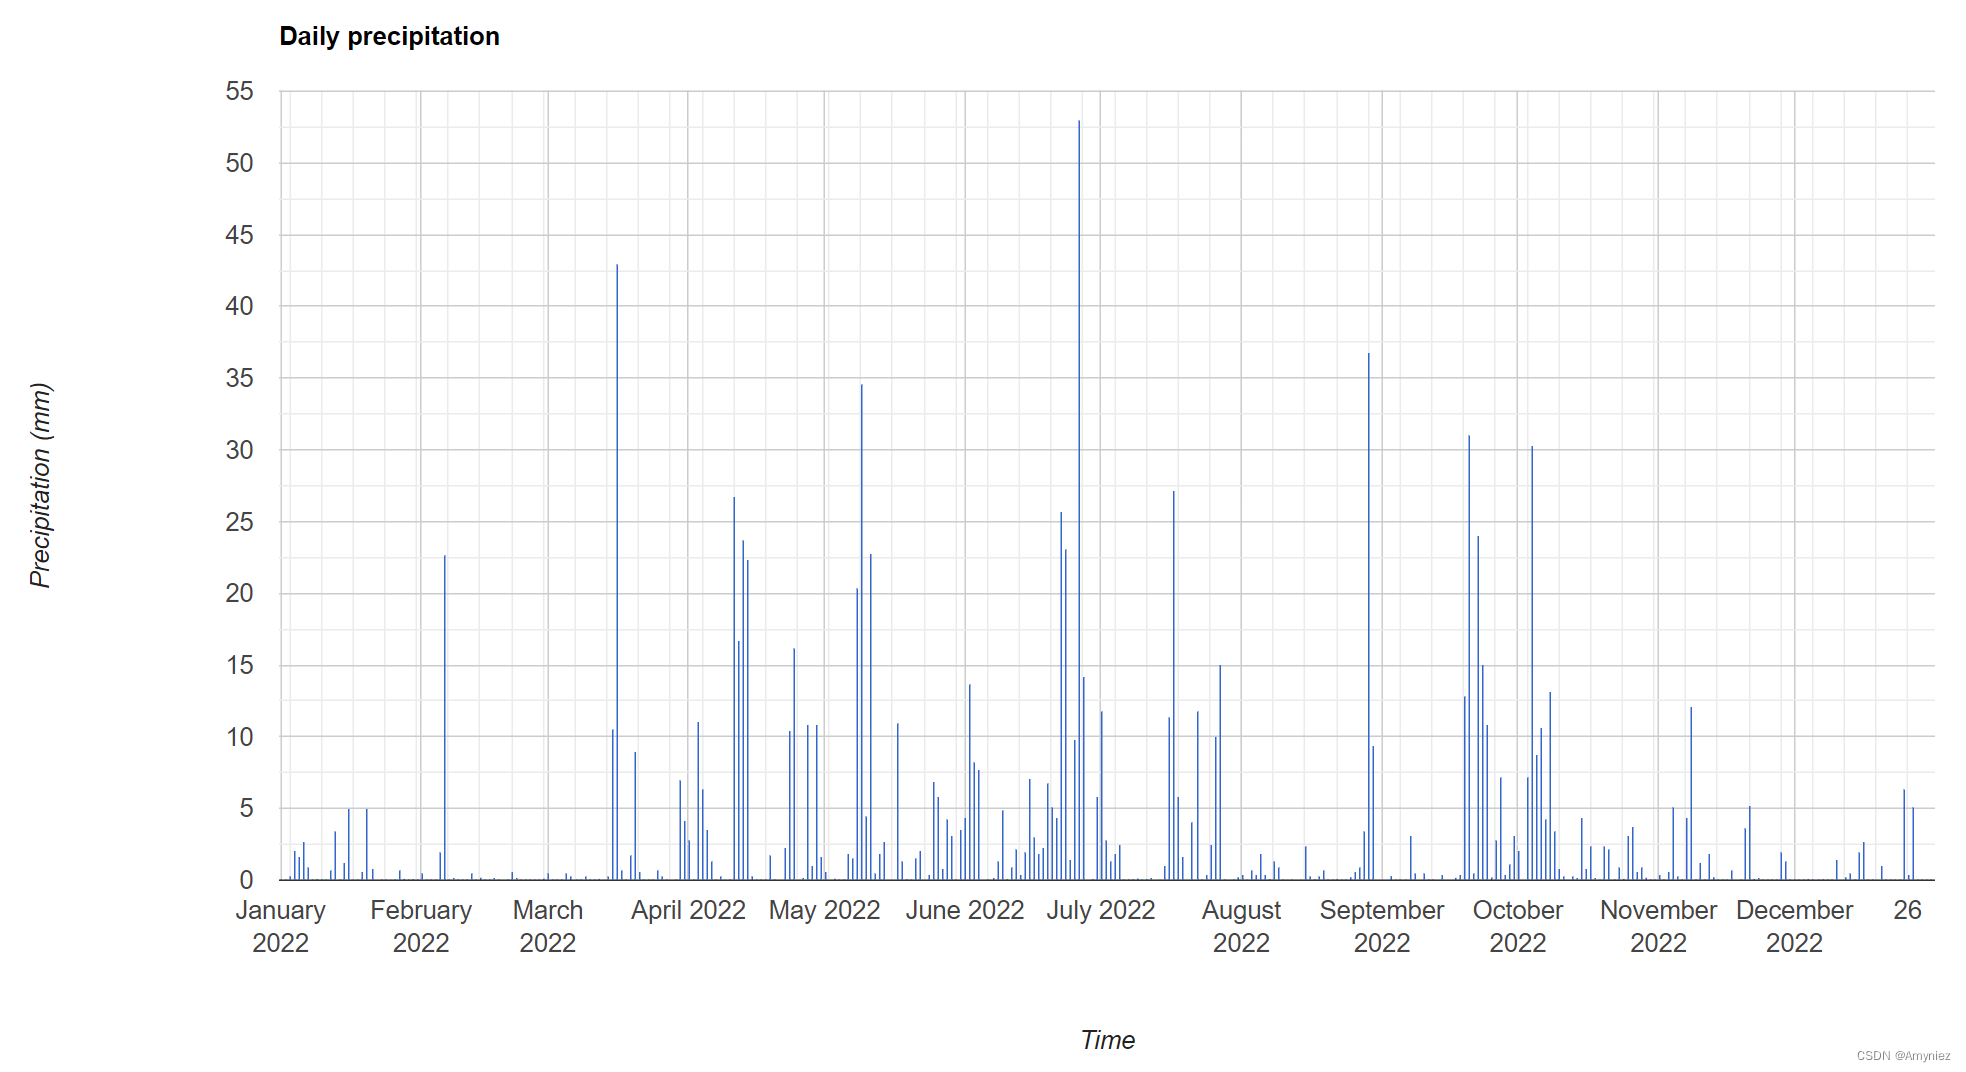
print (paired);var title = {title: 'Daily precipitation',hAxis: {title: 'Time'},vAxis: {title: 'Precipitation (mm)'},
};// 构建日平均降水量图表
var chartDaily = ui.Chart.image.seriesByRegion({imageCollection: dataset, regions: geometry,reducer: ee.Reducer.mean(),band: 'precipitation',scale: 5566,xProperty: 'system:time_start',seriesProperty: 'SITE'
}).setOptions(title).setChartType('ColumnChart');
print(chartDaily);// 将日平均降水量输出CSV文件
var myFeatures = ee.FeatureCollection(paired.map(function(el){el = ee.List(el); // cast every element of the listvar geom = geometry;return ee.Feature(null, {'date': ee.String(el.get(0)),'value':ee.Number(el.get(1))});
}));// Export features, specifying corresponding names.
Export.table.toDrive(myFeatures,
"precipitation", //my task
"GEE_Folder", //my export folder
"daily_precipit", //file name
"CSV");结果展示:
2. 降水时间序列
var geometry = ee.FeatureCollection('projects/ee-*****736/assets/Chongqing_Province')
Map.centerObject(geometry ,6)
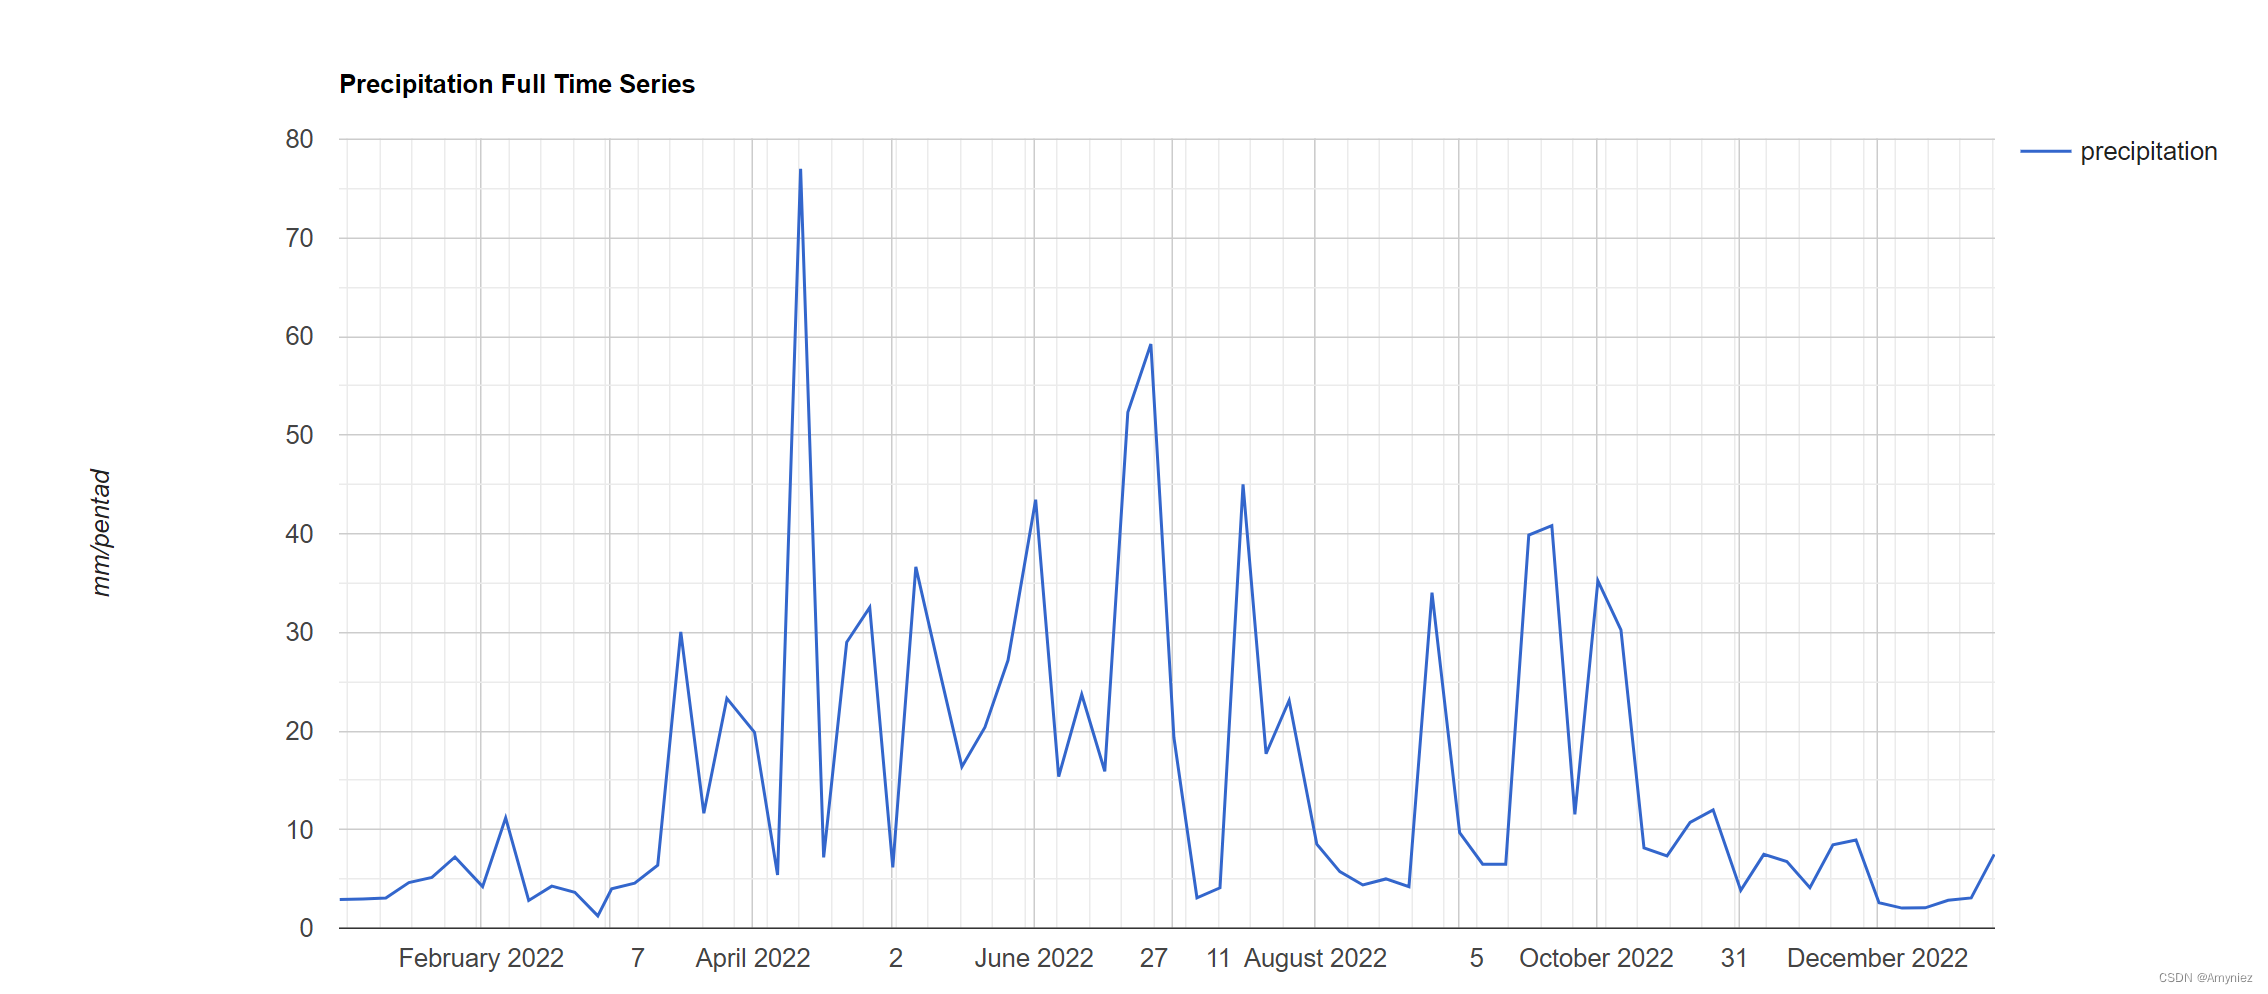
var CHIRPS= ee.ImageCollection('UCSB-CHG/CHIRPS/PENTAD');var precip = CHIRPS.filterDate('2022-01-01', '2022-12-31');
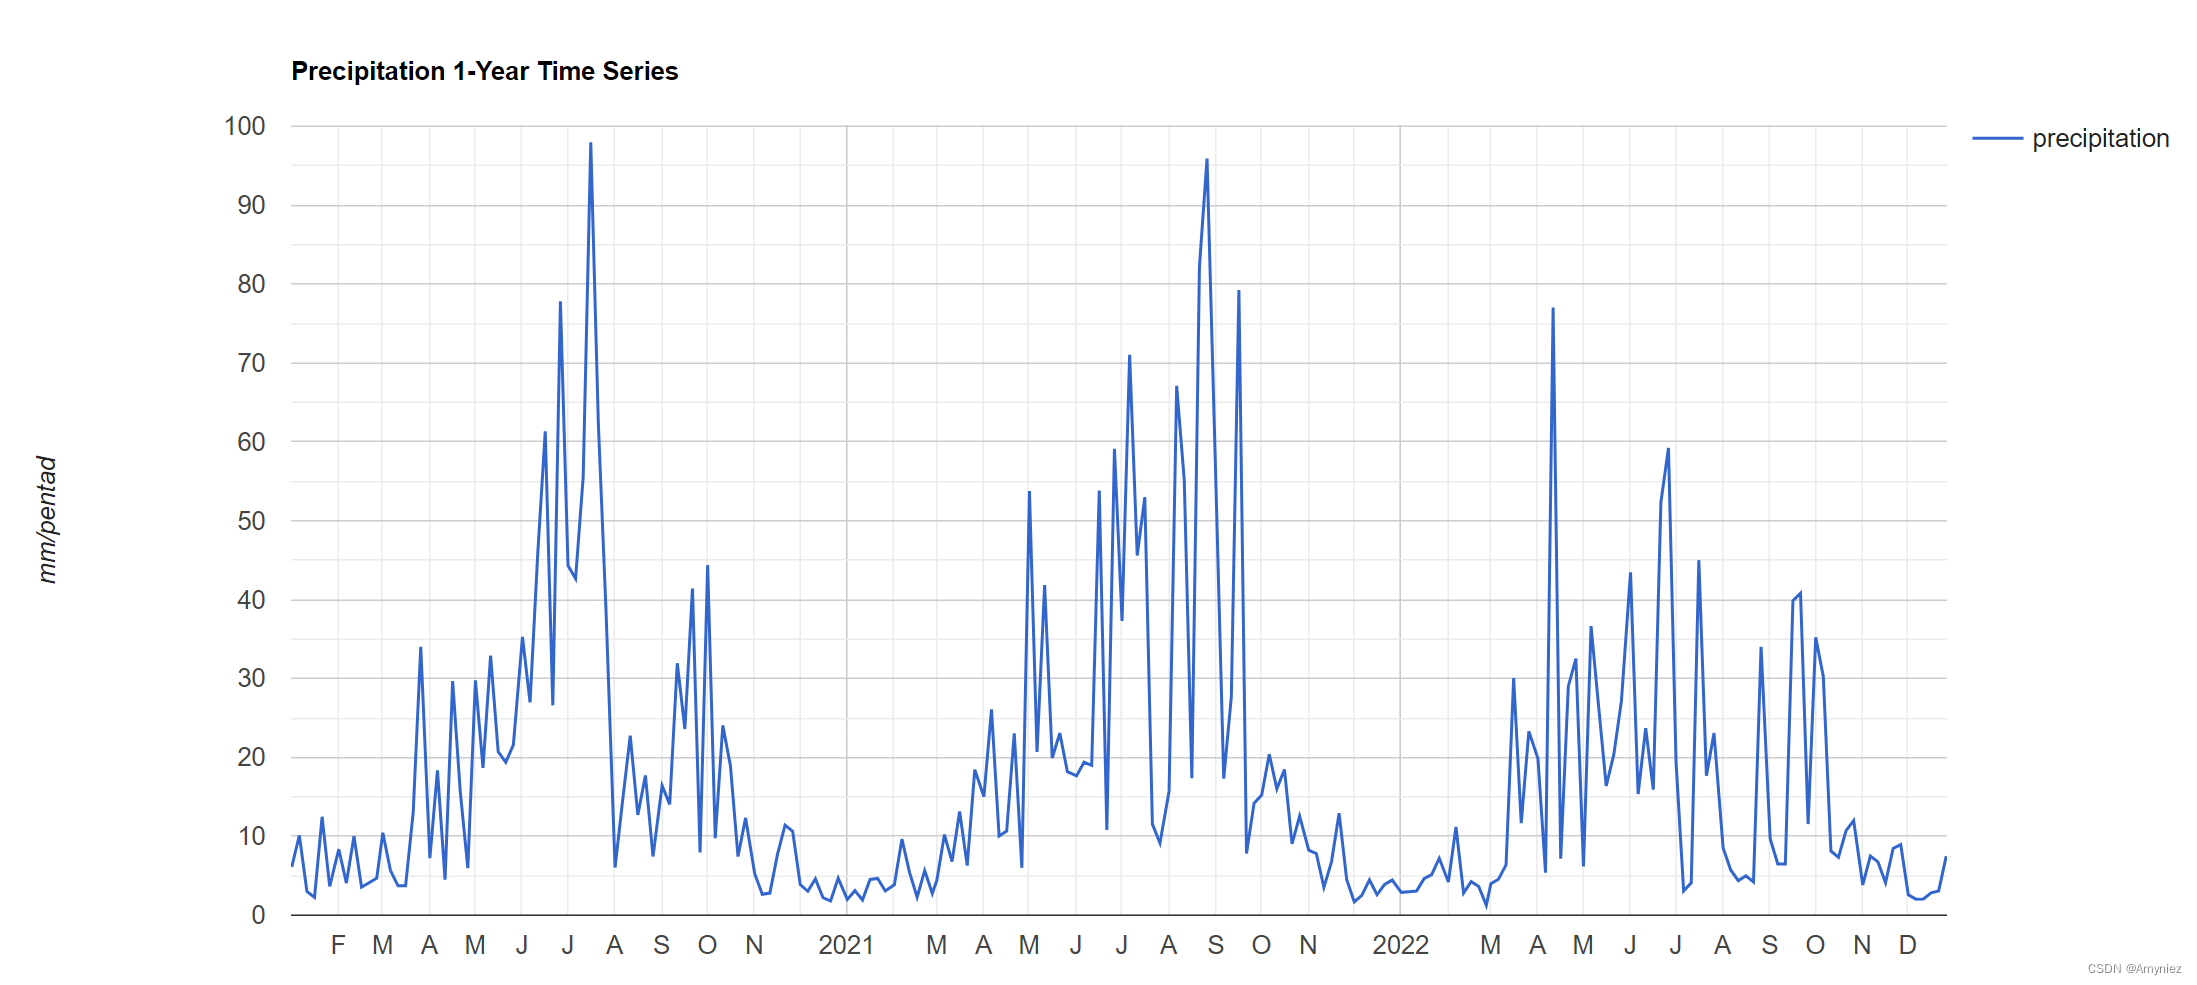
var precip1year=CHIRPS.filterDate('2020-01-01', '2022-12-31');var TS1 = Chart.image.series(precip, geometry, ee.Reducer.mean(),5566, 'system:time_start').setOptions({title: 'Precipitation Full Time Series',vAxis: {title: 'mm/pentad'},
});
print(TS1);var TS2 = Chart.image.series(precip1year, geometry, ee.Reducer.mean(),5566, 'system:time_start').setOptions({title: 'Precipitation 1-Year Time Series',vAxis: {title: 'mm/pentad'},
});
print(TS2);
结果展示:
3. 降水数据年度时间序列对比分析
// 研究区域边界可视化
var geometry = ee.FeatureCollection('projects/ee-*****736/assets/Chongqing_Province')
Map.centerObject(geometry);
var styling = {color:'red',fillColor:'00000000'}
Map.addLayer(geometry.style(styling),{},'roi')var dataset = ee.ImageCollection('UCSB-CHG/CHIRPS/DAILY').filter(ee.Filter.date('2017-01-01', '2023-10-01')).select('precipitation').filterBounds(geometry).map(function(image){return image.clip(geometry)});var Chart1 = ui.Chart.image.doySeriesByYear({imageCollection:dataset,bandName:'precipitation',region:geometry,regionReducer:ee.Reducer.mean(),scale:5566,
})
print('每年的降水量走势',Chart1)// 计算每月的平均值
// 自行修改起始年份即可
var years = ee.List.sequence(2017, 2023);
var months = ee.List.sequence(1, 12);
var Monthlymean = ee.ImageCollection(years.map(function(y) {return months.map(function(m) {var perc = dataset.filter(ee.Filter.calendarRange(y,y, 'year')).filter(ee.Filter.calendarRange(m, m, 'month')).mean().clip(geometry)return perc.set('system:time_start',ee.Date.fromYMD(y,m,1)).set('system:index',ee.String(ee.Number(y).int()).cat("_").cat(ee.String(ee.Number(m).int())))})}).flatten());
print('月平均数据集',Monthlymean)var Chart2 = ui.Chart.image.doySeriesByYear({imageCollection:Monthlymean,bandName:'precipitation',region:geometry,regionReducer:ee.Reducer.mean(),scale:5566,
})
print('每年的月度降水量走势',Chart2)
结果展示:
每年的降水量走势:

每年的月度降水量走势:

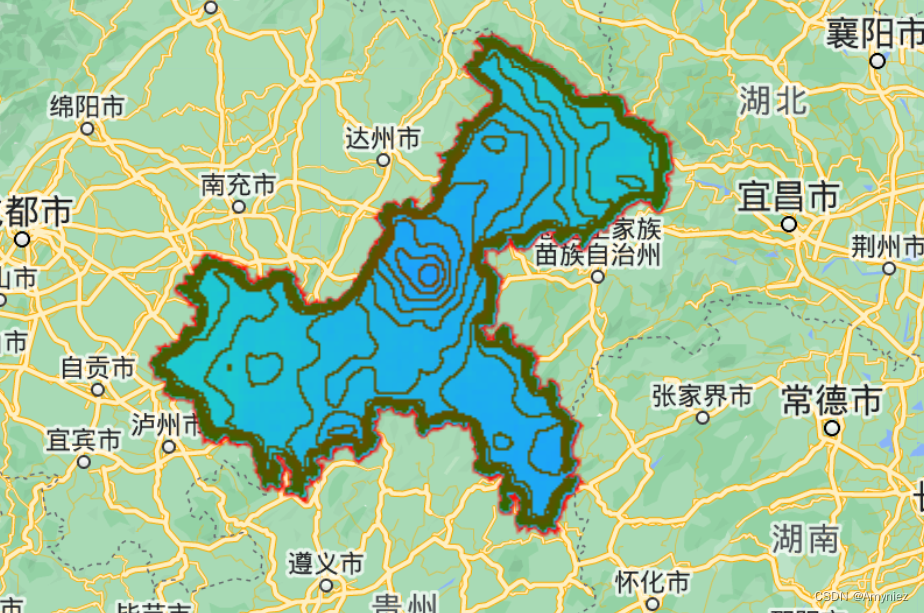
4. 降水等值线绘制
var geometry = ee.FeatureCollection('projects/ee-yipeizhao736/assets/Chongqing_Province')
Map.centerObject(geometry,6.5)
var styling = {color:"red",fillColor:"00000000"}
Map.addLayer(geometry.style(styling),{},"geometry")
var geometry = geometry.geometry()// Load the CHIRPS data
var CHIRPS= ee.ImageCollection('UCSB-CHG/CHIRPS/PENTAD');// 选择两个研究时间段
var precip = CHIRPS.filterDate('2022-01-01', '2022-12-31');
var precip1year=CHIRPS.filterDate('2020-01-01', '2022-12-31');// 绘制两个时间序列图
var TS1 = Chart.image.series(precip, geometry, ee.Reducer.mean(),5566, 'system:time_start').setOptions({title: '2022 Precipitation Time Series',vAxis: {title: 'mm/pentad'},
});
print(TS1);var TS2 = Chart.image.series(precip1year, geometry,  ee.Reducer.mean(),5566, 'system:time_start').setOptions({title: '2020-2022 Precipitation Time Series',vAxis: {title: 'mm/pentad'},
});
print(TS2);// Short and Long Term Rainfall in MM
var GujaratPrecip1 = precip.sum().clip(geometry);
var GujaratPrecip = precip1year.sum().clip(geometry).multiply(0.33);
Map.addLayer(GujaratPrecip1, {'min': 100, 'max': 3000, 'palette':"f6ffa9,1fe2b5,1da0fd,2b7bf3,141899"},'Short-term Rainfall');
Map.addLayer(GujaratPrecip, {'min': 100, 'max': 3000, 'palette':"f6ffa9,1fe2b5,1da0fd,2b7bf3,141899"},'Long-term Rainfall');
print(GujaratPrecip)// 绘制等值线
var lines = ee.List.sequence(0, 3000, 50);
var contourlines = lines.map(function(line) {var mycontour = GujaratPrecip1.convolve(ee.Kernel.gaussian(5, 3)).subtract(ee.Image.constant(line)).zeroCrossing().multiply(ee.Image.constant(line)).toFloat();return mycontour.mask(mycontour);
})contourlines = ee.ImageCollection(contourlines).mosaic();
Map.addLayer(contourlines, {min: 0, max: 3000, palette:['green', 'red']}, 'Annual Contour Map');
结果展示:
这篇关于GEE16: 区域日均降水量计算及分析的文章就介绍到这儿,希望我们推荐的文章对编程师们有所帮助!


