本文主要是介绍基于神经网络的宏观经济数据分析研究(Matlab代码实现),希望对大家解决编程问题提供一定的参考价值,需要的开发者们随着小编来一起学习吧!
👨🎓个人主页:研学社的博客
💥💥💞💞欢迎来到本博客❤️❤️💥💥
🏆博主优势:🌞🌞🌞博客内容尽量做到思维缜密,逻辑清晰,为了方便读者。
⛳️座右铭:行百里者,半于九十。
📋📋📋本文目录如下:🎁🎁🎁
目录
💥1 概述
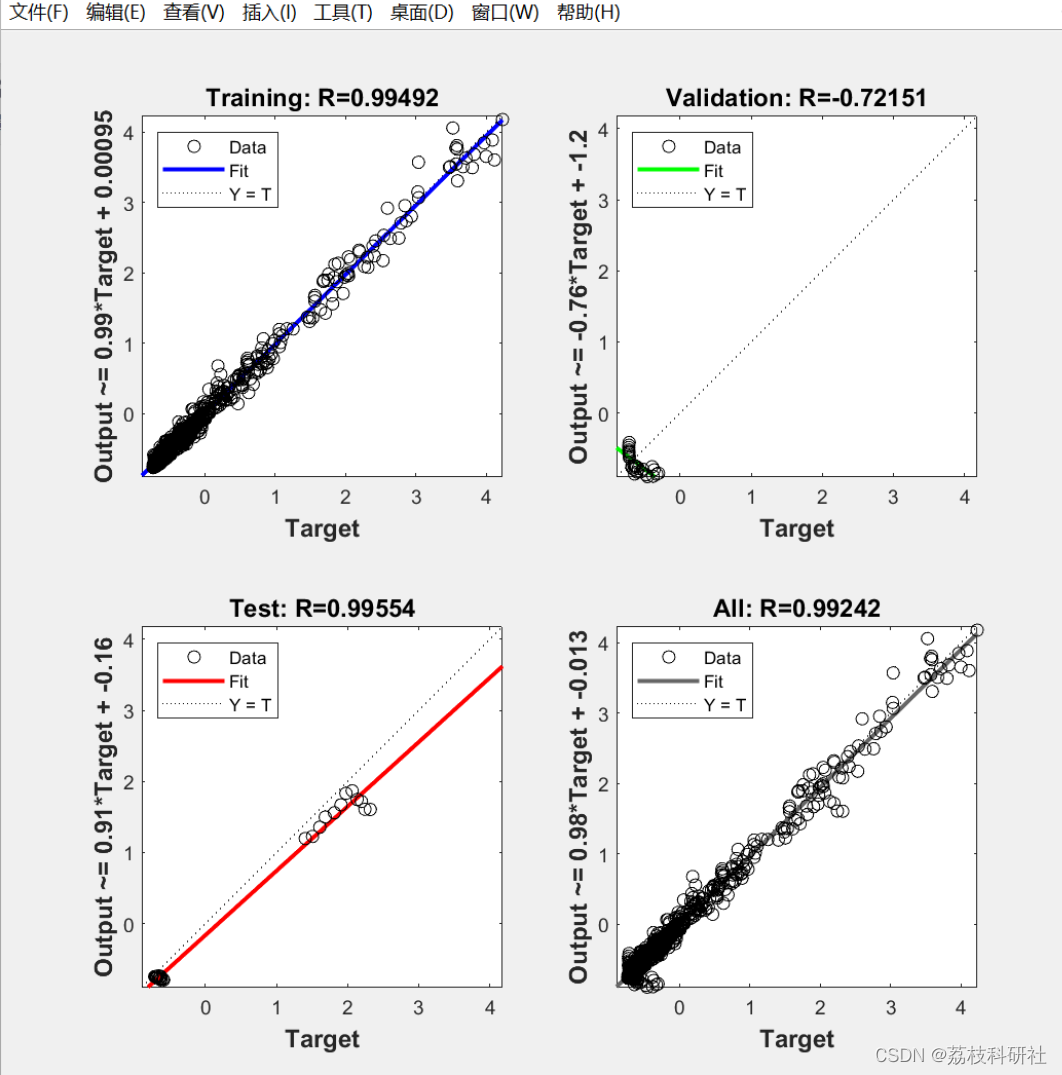
📚2 运行结果
🌈3 Matlab代码实现
🎉4 参考文献
💥1 概述
宏观经济时间序列的分析和预测是国家决策者非常感兴趣的因素。然而,由于缺乏精确的经济模型和外部因素(如天气变化或政治决策)的影响,经济分析和预测不是简单的任务。我们的研究重点是西班牙语国家。在本论文中,我们研究了不同类型的神经网络及其在各种分析任务中的适用性,包括GDP预测以及评估各国发展的主要趋势。研究的模型包括多层神经网络、递归神经网络和Kohonen映射。分析了1980-2015年期间17个西班牙语国家以及法国和德国的历史宏观经济数据。这项工作随后比较了用于训练神经网络的各种算法的性能,并展示了各国经济状况的变化。此外,我们还提供了解释数据中发现的趋势的可能原因。
📚2 运行结果


部分代码:
%% Generating data points
x = linspace(-2*pi, 2*pi, 500);
y = sin(x);
xextended = linspace(-4*pi,4*pi,1000);
yextended = sin(xextended);
%% Create and configure the MLP
layer = [50 10];
% gradient descend (backpropagation) algorithm will be used
net = feedforwardnet(layer,'traingd');
net = configure(net,x,y);
net = init(net);
for h = 1:length(layer)
%Using sigmoid transfer function
net.layers{h}.transferFcn = 'tansig';
end
net.trainParam.max_fail = 150;
net.trainParam.time = 600;
net.trainParam.epochs = 1000;
net.trainParam.goal = 1e-6;
net.trainParam.lr = 0.01;
%% Train the MLP
[net,tr] = train(net,x,y);
%% Generate the output of the MLP
outputs = net(x);
outputsextended = net(xextended);
%% Create and configure the RNN
% The RNN will use an input sequence of length 100
% gradient descend (backpropagation) algorithm will be used
rnn = layrecnet(1:100,[15],'traingd');
rnn.trainParam.epochs = 2000;
rnn.trainParam.lr = 0.01;
%% Transforming the training data to fit the RNN
[Xs,Xi,Ai,Ts] = preparets(rnn,num2cell(x),num2cell(y));
%% Training the RNN
rnn = train(rnn,Xs,Ts,Xi,Ai);
%% Transforming the testing data to fit the RNN
[Xs2,Xi2,Ai2,Ts2] = preparets(rnn,num2cell(xextended),num2cell(yextended));
%% Generate the output of the RNN
rnnoutput = rnn(Xs2,Xi2,Ai2);
%% Transform the output of the RNN
rnnoutput = cell2mat(rnnoutput);
%% Generate the plot for the MLP
figure
plot(xextended(101:(length(xextended))),yextended(101:(length(yextended))),'Color',[1 0 0], 'LineWidth',2)
hold on
plot(xextended(101:(length(xextended))),outputsextended(101:length(outputsextended)),'Color', [0 1 0], 'LineWidth',2);
line([-2*pi -2*pi], [-2 2], 'Color', [0 0 0]);
line([2*pi 2*pi], [-2 2], 'Color', [0 0 0]);
xlabel('-4\pi < x < 4\pi'); % x-axis label
ylabel('sine function approximation');
legend('y = sin(x)', 'MLP approximation');
%% Generate the plot for the RNN
figure
plot(xextended(101:(length(xextended))),yextended(101:(length(yextended))),'Color',[1 0 0], 'LineWidth',2)
hold on
plot(xextended(101:(length(xextended))),rnnoutput, 'Color', [0 0 1], 'LineWidth',2)
line([-2*pi -2*pi], [-2 2], 'Color', [0 0 0]);
line([2*pi 2*pi], [-2 2], 'Color', [0 0 0]);
xlabel('-4\pi < x < 4\pi'); % x-axis label
ylabel('sine function approximation');
legend('y = sin(x)', 'RNN approxi
🌈3 Matlab代码实现
🎉4 参考文献
部分理论来源于网络,如有侵权请联系删除。
[1]刘涛雄,徐晓飞.大数据与宏观经济分析研究综述[J].国外理论动态,2015(01):57-64.
这篇关于基于神经网络的宏观经济数据分析研究(Matlab代码实现)的文章就介绍到这儿,希望我们推荐的文章对编程师们有所帮助!


