本文主要是介绍Matplotlib中使用plt.axes()隐藏坐标轴,希望对大家解决编程问题提供一定的参考价值,需要的开发者们随着小编来一起学习吧!
文章目录
- 一、问题简述
- 二、初始代码及结果
- 三、修改代码及结果
- 四、具体修改内容
- 4.1 第一部分
- 4.2 第二部分
- 五、隐藏边框
一、问题简述
在进行“数据可视化”这个python入门项目之时,本想实现只显示图像而隐藏坐标轴的功能,但遇到了按照教程操作却无法隐藏坐标轴反而隐藏了图像的问题。
二、初始代码及结果
问题代码如下:
import matplotlib.pyplot as pltfrom random_walk import RandomWalkwhile True:#创建一个RandomWalk实例,将其包含点绘制出来rw=RandomWalk()rw.fill_walk()#给点着色point_numbers=list(range(rw.num_points))plt.scatter(rw.x_values,rw.y_values,c=point_numbers,cmap=plt.cm.Blues,edgecolor='none',s=15)#突出起点和终点plt.scatter(0,0,c='green',edgecolors='none',s=100)plt.scatter(rw.x_values[-1],rw.y_values[-1],c='red',edgecolors='none',s=100)#隐藏坐标轴plt.axes().get_xaxis().set_visible(False)plt.axes().get_yaxis().set_visible(False)plt.show()keep_running=input("Make another walk?(y/n):")if keep_running=='n':break
问题结果输出如下:
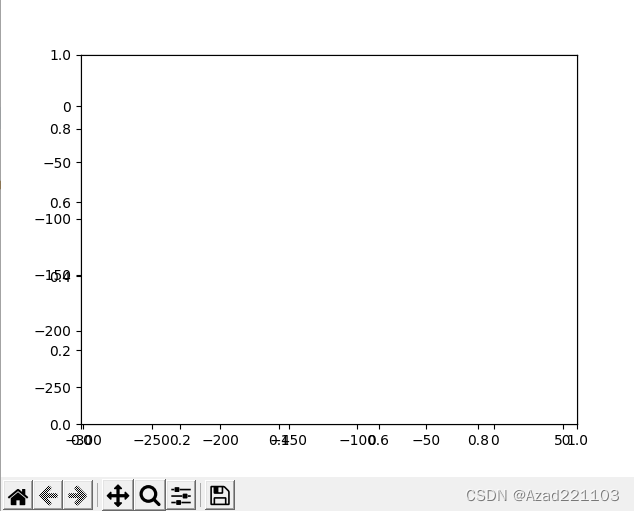
可以看出存在问题:
- 坐标轴部分数据重叠错乱
- 坐标轴未隐藏
- 隐藏了图像
三、修改代码及结果
最终修改代码如下:
import matplotlib.pyplot as pltfrom random_walk import RandomWalkwhile True:#创建一个RandomWalk实例,将其包含点绘制出来rw=RandomWalk()rw.fill_walk()#隐藏坐标轴# plt.axes().get_xaxis().set_visible(False)# plt.axes().get_yaxis().set_visible(False)current_axes=plt.axes()current_axes.xaxis.set_visible(False)current_axes.yaxis.set_visible(False)#给点着色point_numbers=list(range(rw.num_points))plt.scatter(rw.x_values,rw.y_values,c=point_numbers,cmap=plt.cm.Blues,edgecolor='none',s=15)#突出起点和终点plt.scatter(0,0,c='green',edgecolors='none',s=100)plt.scatter(rw.x_values[-1],rw.y_values[-1],c='red',edgecolors='none',s=100)plt.show()keep_running=input("Make another walk?(y/n):")if keep_running=='n':break
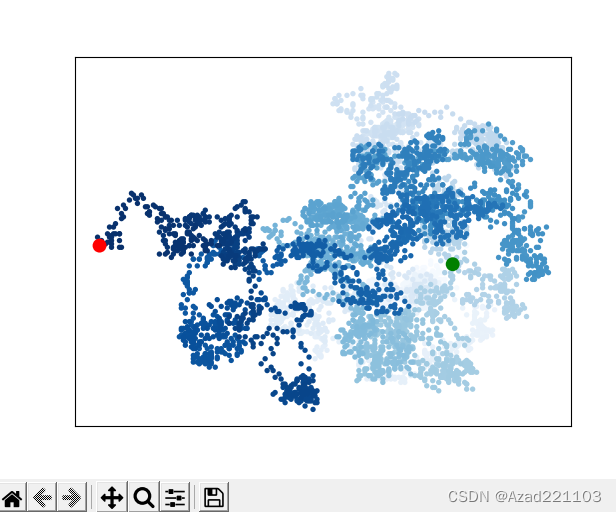
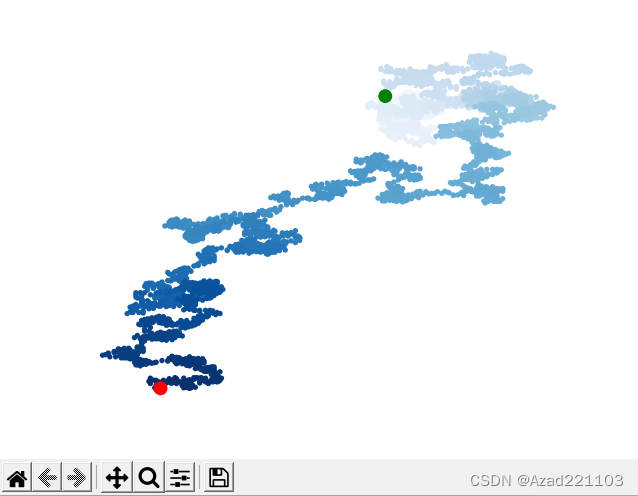
正确运行结果如下:
四、具体修改内容
4.1 第一部分
#隐藏坐标轴# plt.axes().get_xaxis().set_visible(False)# plt.axes().get_yaxis().set_visible(False)current_axes=plt.axes()current_axes.xaxis.set_visible(False)current_axes.yaxis.set_visible(False)
对这一部分代码修改原因可参考此处链接。
输出结果:
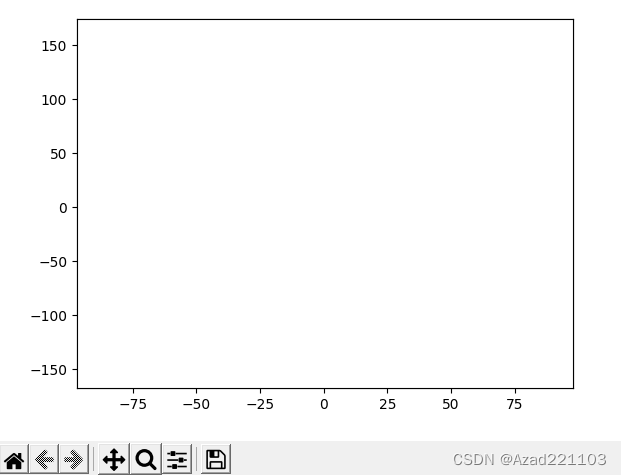
可以看出,虽然解决了坐标轴重叠错乱问题,但仍未能显示图像和隐藏坐标轴。
4.2 第二部分
将“隐藏坐标轴”模块移动到“给点着色”模块之前:
while True:#创建一个RandomWalk实例,将其包含点绘制出来rw=RandomWalk()rw.fill_walk()#隐藏坐标轴# plt.axes().get_xaxis().set_visible(False)# plt.axes().get_yaxis().set_visible(False)current_axes=plt.axes()current_axes.xaxis.set_visible(False)current_axes.yaxis.set_visible(False)#给点着色point_numbers=list(range(rw.num_points))plt.scatter(rw.x_values,rw.y_values,c=point_numbers,cmap=plt.cm.Blues,edgecolor='none',s=15)#突出起点和终点plt.scatter(0,0,c='green',edgecolors='none',s=100)plt.scatter(rw.x_values[-1],rw.y_values[-1],c='red',edgecolors='none',s=100)plt.show()keep_running=input("Make another walk?(y/n):")if keep_running=='n':break
输出结果:
将“隐藏坐标轴”模块移动到“着色”模块之前,便可成功隐藏坐标轴,仅显示图像。
只有完成了这两部分的修改,显示结果才会既隐藏坐标轴又显示图像。
五、隐藏边框
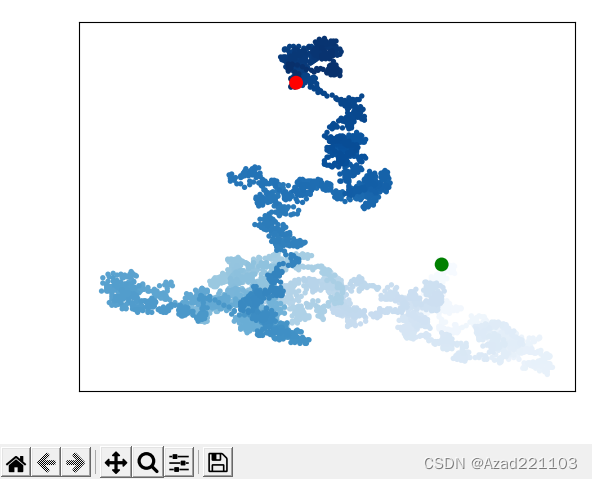
还可再进一步,在plt.show()语句之前加上plt.axis(‘off’)语句,便可得到无坐标轴无边框的图像。显示图像如下:
And now I see. With eye serene. The very pulse of the machine.
这篇关于Matplotlib中使用plt.axes()隐藏坐标轴的文章就介绍到这儿,希望我们推荐的文章对编程师们有所帮助!


