本文主要是介绍回归模型的诊断(176,187),希望对大家解决编程问题提供一定的参考价值,需要的开发者们随着小编来一起学习吧!
回归模型的诊断
- #一元线性回归模型
#一元线性回归模型import pandas as pd
import matplotlib.pyplot as plt
import seaborn as sns#导入数据集    E:\app\Anaconda\数据挖掘\数据挖掘源代码\第7章 线性回归模型
#导入数据集    E:\jupyter.notebook
income  =  pd.read_csv (r'E:\jupyter.notebook\Salary_Data.csv')
# 绘制散点图
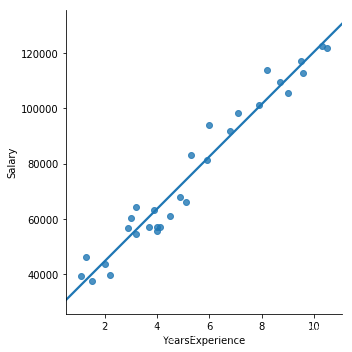
sns.lmplot(x = 'YearsExperience', y = 'Salary', data = income, ci = None)
# 显示图形
plt.show()
-
拟合线的求解
#拟合线的求解# 简单线性回归模型的参数求解# 样本量
n = income.shape[0]
# 计算自变量、因变量、自变量平方、自变量与因变量乘积的和
sum_x = income.YearsExperience.sum()
sum_y = income.Salary.sum()
sum_x2 = income.YearsExperience.pow(2).sum()
xy = income.YearsExperience * income.Salary
sum_xy = xy.sum()
# 根据公式计算回归模型的参数
b = (sum_xy-sum_x*sum_y/n)/(sum_x2-sum_x**2/n)
a = income.Salary.mean()-b*income.YearsExperience.mean()
# 打印出计算结果
print('回归参数a的值:',a)
print('回归参数b的值:',b)
回归参数a的值: 25792.200198668666 回归参数b的值: 9449.962321455081
-
# 导入第三方模块
import statsmodels.api as sm# 利用收入数据集,构建回归模型
fit = sm.formula.ols('Salary ~ YearsExperience', data = income).fit()
# 返回模型的参数值
fit.params
Intercept 25792.200199 YearsExperience 9449.962321 dtype: float64
- 多元线性回归模型的构建和预测
# 多元线性回归模型的构建和预测# 导入模块
import pandas as pd
import statsmodels.api as sm   # stats 统计数据  models 模型
from sklearn import model_selection  #selection 选择#导入数据集    E:\app\Anaconda\数据挖掘\数据挖掘源代码\第7章 线性回归模型
Profit = pd.read_excel(r'E:\app\Anaconda\数据挖掘\数据挖掘源代码\第7章 线性回归模型\Predict to Profit.xlsx')
# 将数据集拆分为训练集和测试集
train, test = model_selection.train_test_split(Profit, test_size = 0.2, random_state=1234)
# 根据train数据集建模
model = sm.formula.ols('Profit ~ RD_Spend + Administration + Marketing_Spend + C(State)', data = train).fit()
print('模型的偏回归系数分别为:', model.params)
# 删除test数据集中的Profit变量,用剩下的自变量进行预测
test_X = test.drop(labels = 'Profit', axis = 1)
pred = model.predict(exog = test_X)
print('对比预测值和实际值的差异',pd.DataFrame({'Prediction':pred,'Real':test.Profit}))
模型的偏回归系数分别为: Intercept 58581.516503 C(State)[T.Florida] 927.394424 C(State)[T.New York] -513.468310 RD_Spend 0.803487 Administration -0.057792 Marketing_Spend 0.013779 dtype: float64 对比预测值和实际值的差异 Prediction Real 8 150621.345801 152211.77 48 55513.218079 35673.41 14 150369.022458 132602.65 42 74057.015562 71498.49 29 103413.378282 101004.64 44 67844.850378 65200.33 4 173454.059691 166187.94 31 99580.888894 97483.56 13 128147.138396 134307.35 18 130693.433835 124266.90
-
# 生成由State变量衍生的哑变量
dummies = pd.get_dummies(Profit.State)
# 将哑变量与原始数据集水平合并
Profit_New = pd.concat([Profit,dummies], axis = 1)
# 删除State变量和California变量(因为State变量已被分解为哑变量,New York变量需要作为参照组)
Profit_New.drop(labels = ['State','New York'], axis = 1, inplace = True)
# 拆分数据集Profit_New
train, test = model_selection.train_test_split(Profit_New, test_size = 0.2, random_state=1234)
# 建模
model2 = sm.formula.ols('Profit ~ RD_Spend + Administration + Marketing_Spend + Florida + California',data = train).fit()
print('模型的偏回归系数分别为:\n',model2.params)
模型的偏回归系数分别为:Intercept 58068.048193 RD_Spend 0.803487 Administration -0.057792 Marketing_Spend 0.013779 Florida 1440.862734 California 513.468310 dtype: float64
- 回归模型的假设验证
# 导入第三方模块
import numpy as np
import pandas as pd
import statsmodels.api as sm   # stats 统计数据  models 模型
from sklearn import model_selection  #selection 选择# 计算建模数据中,因变量的均值
ybar = train.Profit.mean()
# 统计变量个数和观测个数
p = model2.df_model
n = train.shape[0]
# 计算回归离差平方和
RSS = np.sum((model2.fittedvalues-ybar) ** 2)
# 计算误差平方和
ESS = np.sum(model2.resid ** 2)
# 计算F统计量的值
F = (RSS/p)/(ESS/(n-p-1))
print('F统计量的值:',F)
F统计量的值: 174.63721716844674
-
# 导入模块
from scipy.stats import f
# 统计变量个数和观测个数
p = model2.df_model
n = train.shape[0]
# 计算F分布的理论值
F_Theroy = f.ppf(q=0.95, dfn = p,dfd = n-p-1)print('F分布的理论值为:',F_Theroy)
F分布的理论值为: 2.502635007415366
- 模型的概览信息
# 模型的概览信息
model2.summary()
7.1.1 直方图法
# 正态性检验
# 7.1.1 直方图法# 导入第三方模块
import numpy as np
import pandas as pd
import scipy.stats as stats
import matplotlib.pyplot as plt
import seaborn as sns
import statsmodels.api as sm
#导入数据集    E:\app\Anaconda\数据挖掘\数据挖掘源代码\第7章 线性回归模型
#导入数据集    E:\jupyter.notebook
Profit = pd.read_excel(r'E:\jupyter.notebook\Predict to Profit.xlsx')
# 生成由State变量衍生的哑变量
dummies = pd.get_dummies(Profit.State)
# 将哑变量与原始数据集水平合并
Profit_New = pd.concat([Profit,dummies], axis = 1)# 中文和负号的正常显示
plt.rcParams['font.sans-serif'] = ['Microsoft YaHei']
plt.rcParams['axes.unicode_minus'] = False
# 绘制直方图
sns.distplot(a = Profit_New.Profit, bins = 10, fit = stats.norm, norm_hist = True,hist_kws = {'color':'steelblue', 'edgecolor':'black'},kde_kws = {'color':'black', 'linestyle':'--', 'label':'核密度曲线'},fit_kws = {'color':'red', 'linestyle':':', 'label':'正态密度曲线'})
# 显示图例
plt.legend()
# 显示图形
plt.show()
7.1.2 PP图和 QQ图法
QQ图法
# 7.1.2 PP图和QQ图法import pandas as pd
import statsmodels.api as sm   # stats 统计数据  models 模型
from sklearn import model_selection  #selection 选择# 残差的正态性检验(PP图和QQ图法)
pp_qq_plot = sm.ProbPlot(Profit_New.Profit)
# 绘制PP图
pp_qq_plot.ppplot(line = '45')
plt.title('P-P图')
# 绘制QQ图\
pp_qq_plot.qqplot(line = 'q')
plt.title('Q-Q图')
# 显示图形
plt.show()

7.1.3 shapiro 检验和 K-S 检验
# 导入模块
import numpy as np
import scipy.stats as stats
stats.shapiro(Profit_New.Profit)
# 导入模块
import numpy as np
import scipy.stats as stats
stats.shapiro(Profit_New.Profit)
(0.9793398380279541, 0.537902295589447)
# 7.1.3 shapiro 检验和  K-S 检验
# 生成正态分布和均匀分布随机数
rnorm = np.random.normal(loc = 5, scale=2, size = 10000)
runif = np.random.uniform(low = 1, high = 100, size = 10000)
# 正态性检验
KS_Test1 = stats.kstest(rvs = rnorm, args = (rnorm.mean(), rnorm.std()), cdf = 'norm')
KS_Test2 = stats.kstest(rvs = runif, args = (runif.mean(), runif.std()), cdf = 'norm')
print(KS_Test1)
print(KS_Test2)
KstestResult(statistic=0.004854672684304451, pvalue=0.9724869430988361) KstestResult(statistic=0.060540367767767944, pvalue=2.924570309733937e-32)
7.2多重共线性验证(178,179)'
# 导入statsmodels模块中的函数
from statsmodels.stats.outliers_influence import variance_inflation_factor
# 自变量X(包含RD_Spend、Marketing_Spend和常数列1)
X = sm.add_constant(Profit_New.ix[:,['RD_Spend','Marketing_Spend']])# 构造空的数据框,用于存储VIF值
vif = pd.DataFrame()
vif[\"features\"] = X.columns
vif[\"VIF Factor\"] = [variance_inflation_factor(X.values, i) for i in range(X.shape[1])]
# 返回VIF值
vif
结果:
| features | VIF Factor | |
|---|---|---|
| 0 | const | 4.540984 |
| 1 | RD_Spend | 2.026141 |
| 2 | Marketing_Spend | 2.026141 |
7.3线性相关性验证(179,181)
# 计算数据集Profit_New中每个自变量与因变量利润之间的相关系数
Profit_New.drop('Profit', axis = 1).corrwith(Profit_New.Profit)
# 计算数据集Profit_New中每个自变量与因变量利润之间的相关系数
Profit_New.drop('Profit', axis = 1).corrwith(Profit_New.Profit)
RD_Spend           0.978437
Administration     0.205841
Marketing_Spend    0.739307
California        -0.083258
Florida            0.088008
dtype: float64
散点图矩阵
# 散点图矩阵
# 导入模块
import matplotlib.pyplot as plt
import seaborn
# 绘制散点图矩阵
seaborn.pairplot(Profit_New.ix[:,['RD_Spend','Administration','Marketing_Spend','Profit']])
# 显示图形
plt.show()
# 模型修正
import statsmodels.api as sm
model3 = sm.formula.ols('Profit ~ RD_Spend + Marketing_Spend', data = train).fit()
# 模型回归系数的估计值
model3.params
结果:
Intercept          51902.112471
RD_Spend               0.785116
Marketing_Spend        0.019402
dtype: float64
#异常值检验
# 异常值检验
outliers = model3.get_influence()
# 高杠杆值点(帽子矩阵)
leverage = outliers.hat_matrix_diag
# dffits值
dffits = outliers.dffits[0]
# 学生化残差
resid_stu = outliers.resid_studentized_external
# cook距离
cook = outliers.cooks_distance[0]
# 合并各种异常值检验的统计量值
contat1 = pd.concat([pd.Series(leverage, name = 'leverage'),pd.Series(dffits, name = 'dffits'),pd.Series(resid_stu,name = 'resid_stu'),pd.Series(cook, name = 'cook')],axis = 1)
# 重设train数据的行索引
train.index = range(train.shape[0])
# 将上面的统计量与train数据集合并
profit_outliers = pd.concat([train,contat1], axis = 1)
profit_outliers.head()
结果:
- 计算异常值数量的比例
# 计算异常值数量的比例
outliers_ratio = sum(np.where((np.abs(profit_outliers.resid_stu)>2),1,0))/profit_outliers.shape[0]
outliers_ratio
结果:
0.02564102564102564
- 挑选出非异常的观测点
# 挑选出非异常的观测点none_outliers = profit_outliers.ix[np.abs(profit_outliers.resid_stu)<=2,]# 应用无异常值的数据集重新建模
model4 = sm.formula.ols('Profit ~ RD_Spend + Marketing_Spend', data = none_outliers).fit()
model4.params
结果:
Intercept          51827.416821
RD_Spend               0.797038
Marketing_Spend        0.017740
dtype: float64
7.5独立性验证(184)
- Durbin-Watson统计量
# Durbin-Watson统计量
# 模型概览\
model4.summary()
结果:
7.6方差齐性验证(184,187)
-
# 方差齐性检验
# 方差齐性检验
# 设置第一张子图的位置
ax1 = plt.subplot2grid(shape = (2,1), loc = (0,0))
# 绘制散点图
ax1.scatter(none_outliers.RD_Spend, (model4.resid-model4.resid.mean())/model4.resid.std())
# 添加水平参考线
ax1.hlines(y = 0 ,xmin = none_outliers.RD_Spend.min(),xmax = none_outliers.RD_Spend.max(), color = 'red', linestyles = '--')
# 添加x轴和y轴标签
ax1.set_xlabel('RD_Spend')
ax1.set_ylabel('Std_Residual')# 设置第二张子图的位置
ax2 = plt.subplot2grid(shape = (2,1), loc = (1,0))
# 绘制散点图\
ax2.scatter(none_outliers.Marketing_Spend, (model4.resid-model4.resid.mean())/model4.resid.std())
# 添加水平参考线
ax2.hlines(y = 0 ,xmin = none_outliers.Marketing_Spend.min(),xmax = none_outliers.Marketing_Spend.max(),color = 'red', linestyles = '--')
# 添加x轴和y轴标签
ax2.set_xlabel('Marketing_Spend')
ax2.set_ylabel('Std_Residual')# 调整子图之间的水平间距和高度间距
plt.subplots_adjust(hspace=0.6, wspace=0.3)
# 显示图形plt.show()
结果:
-
# BP检验
# BP检验
sm.stats.diagnostic.het_breuschpagan(model4.resid, exog_het = model4.model.exog)
结果:
(1.467510366830809,0.48010272699006995,0.7029751237162342,0.5019659740962923)
-
# 模型预测
# 模型预测
# model4对测试集的预测
pred4 = model4.predict(exog = test.ix[:,['RD_Spend','Marketing_Spend']])
# 对比预测值与实际值
pd.DataFrame({'Prediction':pred4,'Real':test.Profit})# 绘制预测值与实际值的散点图
plt.scatter(x = test.Profit, y = pred4)
# 添加斜率为1,截距项为0的参考线
plt.plot([test.Profit.min(),test.Profit.max()],[test.Profit.min(),test.Profit.max()],color = 'red', linestyle = '--')# 添加轴标签
plt.xlabel('实际值')
plt.ylabel('预测值')
# 显示图形
plt.show()
结果:
以上为练习的测试,有些未完成的后续会加以调试更改,共同学习共同进步。
这篇关于回归模型的诊断(176,187)的文章就介绍到这儿,希望我们推荐的文章对编程师们有所帮助!


