本文主要是介绍echarts将展示全天的数据,如一天的电费,一个停车场一天的饱和度等问题,希望对大家解决编程问题提供一定的参考价值,需要的开发者们随着小编来一起学习吧!
项目场景:
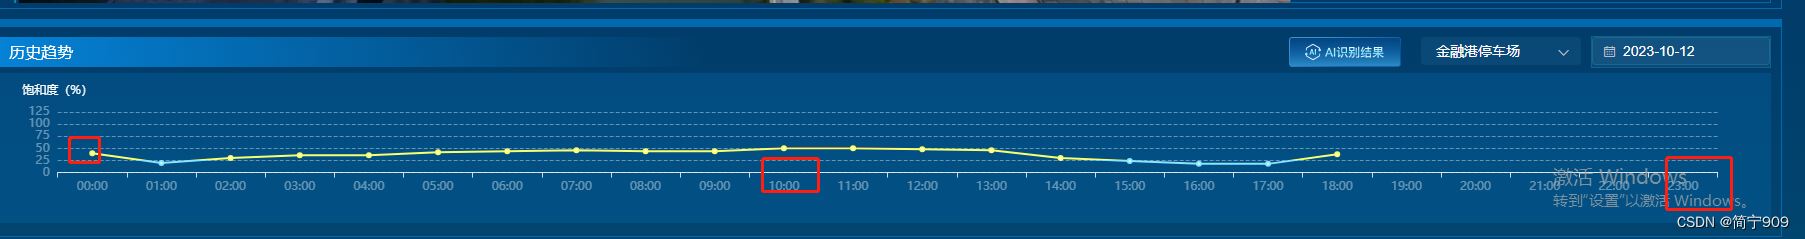
我们的项目是通过ai识别停车场的停车数,来展示此停车场全天的饱和度,如下

问题描述
后台接口给的数据,就是这种,返回所有有停车数量的时间段,但是我们的x轴要求展示全天的数据,并且可伸缩刻度展示具体时间的停车情况
[{time:'2023-10-27 08:20:20',carSaturation:100,analysisImg:require('@/assets/AIRecognition/aiPhoto.png')},{time:'2023-10-27 09:20:20',carSaturation:60,analysisImg:require('@/assets/AIRecognition/aiPhoto.png')},{time:'2023-10-27 10:20:20',carSaturation:20,analysisImg:require('@/assets/AIRecognition/aiPhoto.png')},{time:'2023-10-27 10:25:20',carSaturation:50,analysisImg:require('@/assets/AIRecognition/aiPhoto.png')},{time:'2023-10-27 10:50:20',carSaturation:70,analysisImg:require('@/assets/AIRecognition/aiPhoto.png')},{time:'2023-10-27 11:10:20',carSaturation:20,analysisImg:require('@/assets/AIRecognition/aiPhoto.png')},{time:'2023-10-27 11:20:20',carSaturation:90,analysisImg:require('@/assets/AIRecognition/aiPhoto.png')},{time:'2023-10-27 11:40:20',carSaturation:0,analysisImg:require('@/assets/AIRecognition/aiPhoto.png')},{time:'2023-10-27 12:50:20',carSaturation:20,analysisImg:require('@/assets/AIRecognition/aiPhoto.png')},{time:'2023-10-27 13:50:20',carSaturation:80,analysisImg:require('@/assets/AIRecognition/aiPhoto.png')},{time:'2023-10-27 14:50:20',carSaturation:30,analysisImg:require('@/assets/AIRecognition/aiPhoto.png')},{time:'2023-10-27 15:50:20',carSaturation:110,analysisImg:require('@/assets/AIRecognition/aiPhoto.png')},{time:'2023-10-27 16:50:20',carSaturation:70,analysisImg:require('@/assets/AIRecognition/aiPhoto.png')},]
自己定义x轴时就会导致x轴与y轴数据关联不上,出现如下的情况
解决方案:
将拿到的数据进行转化,转换为如下格式,才能正常渲染
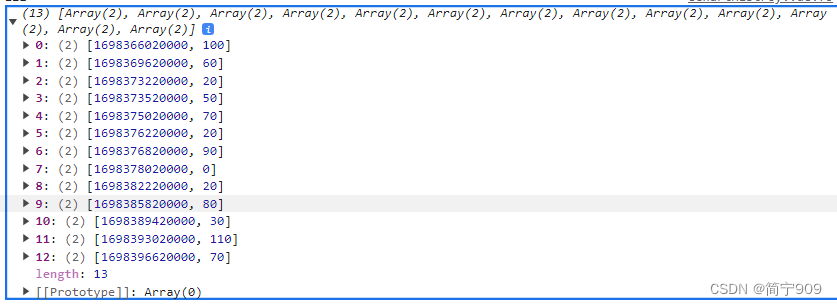
第一步:将时间转换为时间戳并转为数组项格式
dataH.forEach((item,i) => {// 将时间转换为时间戳item.time = new Date(item.time).getTime()let arr = Object.values(item)arr.pop()xAxisD = arrseriesD.push(xAxisD);});
第二步:xAxis的属性axisLabel设置格式化显示时间的属性,注意安装插件moment,设置min和max最大和最小值,不然就只展示有数据的时间轴,如下图

代码如下
axisLabel: {// 格式化x轴显示formatter: function(value, index) {// 如果时间是 23:59:59 , 格式化为 24:00if (value === new Date(moment().endOf('day').format('YYYY-MM-DD HH:mm:ss')).getTime()) {return moment(value).format("24:00");} else {// 其他的时间返回格式化 00:00return moment(value).format("HH:mm");}}},interval: 3600 * 2 * 1000, // 设置x轴分隔间隔,我使用的是毫秒时间戳间隔两小时,如使用秒时间戳不需要x1000min: function (value) {// 设置x轴最小值,为当天00:00:00时时间戳// 若想要将time改为x轴数据最小值,则var time = moment(value.min).format('YYYY-MM-DD HH:mm:ss');var time = moment().startOf('day').format('YYYY-MM-DD HH:mm:ss');return new Date(time).getTime();},max: function (value) {// 设置x轴最大值,为当天23:59:59时时间戳// 若想要将time改为x轴数据最大值,则var time = moment(value.max).format('YYYY-MM-DD HH:mm:ss');var time = moment().endOf('day').format('YYYY-MM-DD HH:mm:ss');return new Date(time).getTime();}
第三步:设置时间轴的缩放及曲线不同值得不同颜色展示
dataZoom: {type: 'inside', //放大缩小x轴数值},
区间值是0-125
visualMap: {show:false,pieces: [{gt: 0,lte: 25,color: '#87E5FF'}, {gt: 25,lte: 50,color: '#FAFF6F'},{gt: 50,lte: 100,color: '#FF9921'},{gt: 100,lte: 125,color: '#F83F3F'}]},
具体的代码如下
<template><div class="echartBox"><divclass="echartT3"id="echart"></div></div>
</template>
<script>
import moment from 'moment';
import { formatTime } from "@/utils/index.js";
export default {data() {return {};},props:{historyData:{type:Array,default:[]},},mounted() {this.initEchart();},watch:{//观察option的变化option: {handler(newVal, oldVal) {//数据自动刷新,必然需要一个监听机制告诉Echarts重新设置数据if (this.myChart) {if (newVal) {this.myChart.setOption(newVal);} else {this.myChart.setOption(oldVal);}} else {this.initEchart();}},deep: true //对象内部属性的监听,关键。}},computed:{option(){// let dataH = this.historyData;//后台数据let dataH =[{time:'2023-10-27 08:20:20',carSaturation:100,analysisImg:require('@/assets/AIRecognition/aiPhoto.png')},{time:'2023-10-27 09:20:20',carSaturation:60,analysisImg:require('@/assets/AIRecognition/aiPhoto.png')},{time:'2023-10-27 10:20:20',carSaturation:20,analysisImg:require('@/assets/AIRecognition/aiPhoto.png')},{time:'2023-10-27 10:25:20',carSaturation:50,analysisImg:require('@/assets/AIRecognition/aiPhoto.png')},{time:'2023-10-27 10:50:20',carSaturation:70,analysisImg:require('@/assets/AIRecognition/aiPhoto.png')},{time:'2023-10-27 11:10:20',carSaturation:20,analysisImg:require('@/assets/AIRecognition/aiPhoto.png')},{time:'2023-10-27 11:20:20',carSaturation:90,analysisImg:require('@/assets/AIRecognition/aiPhoto.png')},{time:'2023-10-27 11:40:20',carSaturation:0,analysisImg:require('@/assets/AIRecognition/aiPhoto.png')},{time:'2023-10-27 12:50:20',carSaturation:20,analysisImg:require('@/assets/AIRecognition/aiPhoto.png')},{time:'2023-10-27 13:50:20',carSaturation:80,analysisImg:require('@/assets/AIRecognition/aiPhoto.png')},{time:'2023-10-27 14:50:20',carSaturation:30,analysisImg:require('@/assets/AIRecognition/aiPhoto.png')},{time:'2023-10-27 15:50:20',carSaturation:110,analysisImg:require('@/assets/AIRecognition/aiPhoto.png')},{time:'2023-10-27 16:50:20',carSaturation:70,analysisImg:require('@/assets/AIRecognition/aiPhoto.png')},]let xAxisD=[];let seriesD=[];dataH.forEach((item,i) => {// 将时间转换为时间戳item.time = new Date(item.time).getTime()let arr = Object.values(item)arr.pop()xAxisD = arrseriesD.push(xAxisD);});return {tooltip: {trigger: 'item',borderRadius: 8,//边框圆角backgroundColor: 'rgba(11, 66, 131, 1)',//背景颜色(此时为默认色)borderColor: 'rgba(11, 66, 131, 1)',formatter: function(params) { var res = formatTime(params.data[0])+' '+'停车饱和度:'+params.data[1]+'%'+'<br/>'; //电厂名称dataH.forEach(ite=>{if(ite.time == params.data[0]){res+="<img style='width:139px;height:79px;' src='"+ ite.analysisImg+"'/>";}})return res; },textStyle:{color:'#ffff',align:'center',fontSize: 18,} },grid: {top: '30%',left: '2%',right: '3%',bottom: '8%',containLabel: true},xAxis: {axisLabel: {textStyle: {color: 'rgba(255, 255, 255, 0.4)'},}, axisLine: {lineStyle: {color: 'rgba(255, 255, 255, 0.8)',width: 1,}},boundaryGap: true,show: true,type: "time", // 这里使用时间轴模式axisLabel: {// 格式化x轴显示formatter: function(value, index) {// 如果时间是 23:59:59 , 格式化为 24:00if (value === new Date(moment().endOf('day').format('YYYY-MM-DD HH:mm:ss')).getTime()) {return moment(value).format("24:00");} else {// 其他的时间返回格式化 00:00return moment(value).format("HH:mm");}}},interval: 3600 * 2 * 1000, // 设置x轴分隔间隔,我使用的是毫秒时间戳间隔两小时,如使用秒时间戳不需要x1000min: function (value) {// 设置x轴最小值,为当天00:00:00时时间戳// 若想要将time改为x轴数据最小值,则var time = moment(value.min).format('YYYY-MM-DD HH:mm:ss');var time = moment().startOf('day').format('YYYY-MM-DD HH:mm:ss');return new Date(time).getTime();},max: function (value) {// 设置x轴最大值,为当天23:59:59时时间戳// 若想要将time改为x轴数据最大值,则var time = moment(value.max).format('YYYY-MM-DD HH:mm:ss');var time = moment().endOf('day').format('YYYY-MM-DD HH:mm:ss');return new Date(time).getTime();}},dataZoom: {type: 'inside', //放大缩小x轴数值},yAxis: {name:'饱和度(%)',type:'value',nameTextStyle: {color: "#fff",nameLocation: "start",},min:0, //y轴的最小值max:125, //y轴最大值 interval:25, //值之间的间隔type: 'value',splitLine :{lineStyle:{type:'dashed',//虚线color: 'rgba(255, 255, 255, 0.4)'},show: true //隐藏},axisLabel: {textStyle: {color: 'rgba(255, 255, 255, 0.4)'}}, },visualMap: {show:false,pieces: [{gt: 0,lte: 25,color: '#87E5FF'}, {gt: 25,lte: 50,color: '#FAFF6F'},{gt: 50,lte: 100,color: '#FF9921'},{gt: 100,lte: 125,color: '#F83F3F'}]},series: [{data:seriesD,type: 'line',smooth: false,//折线是直线还是曲线legend:{show:false,},}, ],}}},methods: {initEchart(){this.myChart = this.$echarts.init(document.getElementById('echart'));this.myChart.setOption(this.option);},}
};
</script>
<style scoped lang="scss">
.echartT3 {height: 130px;width: 100%;
}
</style>
引入及使用请参考博客echart的数据渲染,option不刷新问题
这篇关于echarts将展示全天的数据,如一天的电费,一个停车场一天的饱和度等问题的文章就介绍到这儿,希望我们推荐的文章对编程师们有所帮助!


