本文主要是介绍vue 项目下使用dataV和echarts 开发可视化大屏,希望对大家解决编程问题提供一定的参考价值,需要的开发者们随着小编来一起学习吧!
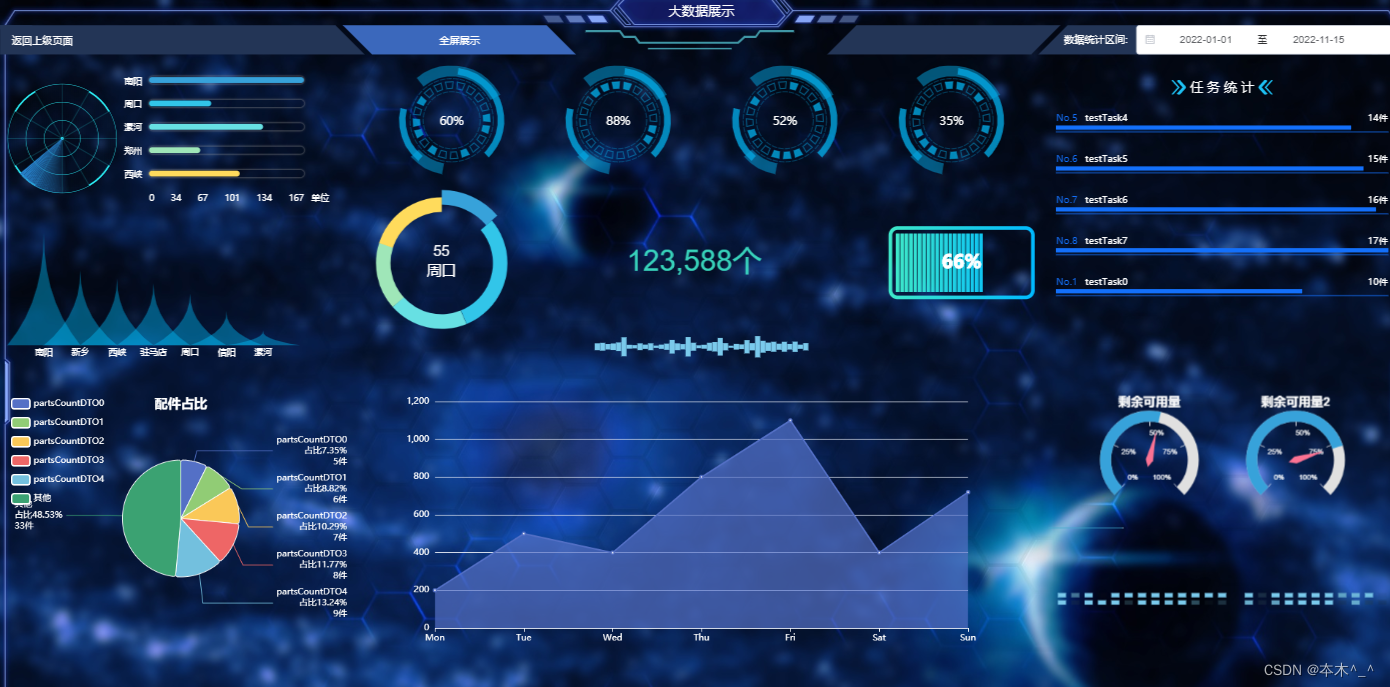
先贴效果图,静态图开不出动态效果。
首先得安装依赖
“@jiaminghi/data-view”: “^2.10.0”,
“echarts”: “^5.2.1”,
“screenfull”: “^5.2.0”,
首页代码
<template><div :class="figureBG == 1 ? 'figure-page' : 'figure-page'" ref="figure" class="img_bg"><dv-decoration-9 class="loading" v-if="isShowLoading"><dv-digital-flop class="schedule" :config="configLoad" /></dv-decoration-9><dv-full-screen-container><div> </div><template v-if="!isShowLoading"><!-- 第一行 --><!-- <div class="jc-center"><dv-decoration-10 style="width: 33.3%; height: 5px" /><div class="jc-center"><dv-decoration-8:color="color"style="width: 200px; height: 50px"/><div class="title"><span class="title-text">车险人伤第三方机构多维数字化看板</span><dv-decoration-6class="title-bototm":reverse="true":color="['#50e3c2', '#67a1e5']"style="width: 130px; height: 18px"/></div><dv-decoration-8:reverse="true":color="color"style="width: 200px; height: 50px"/></div><dv-decoration-10style="width: 33.3%; height: 5px; transform: rotateY(180deg)"/></div> --><dv-border-box-11 title="大数据展示" class="box_11"><!-- 第二行 --><div class="jc-between"><div class="d-flex" style="width: 40%"><divclass="react-right ml-4"style="width: 625px; text-align: left; background-color: #233556"@click="toBack"><span class="react-before"></span><span class="text">返回上级页面</span></div><divclass="react-right bg-color-blue ml-3"@click="handleScreenfull"><span class="text">全屏展示</span></div></div><dv-decoration-5 style="width:300px;height:40px;" />"<div style="width: 40%" class="d-flex"><divclass="react-left mr-3"style="background-color: #233556"@click="toggleBg"><span class="text fw-b"></span></div><divclass="react-left mr-4"style="width: 625px; background-color: #233556; text-align: right"><span class="react-after"></span><div class="date-row text react-left_qj"><span class="title_qj">数据统计区间: </span><el-date-pickerclass="daterange_qj"v-model="date"type="daterange"align="right"unlink-panelsrange-separator="至"start-placeholder="开始日期"end-placeholder="结束日期":picker-options="pickerOptions"@change="init"></el-date-picker></div></div></div></div><div class="table-flex-box"><Left ref="left" /><Center ref="center" /><Right ref="right" /></div></dv-border-box-11> </template></dv-full-screen-container></div></template><script>import Vue from 'vue'import dataV from '@jiaminghi/data-view'import * as echarts from 'echarts/core'import { BarChart } from 'echarts/charts'import screenfull from 'screenfull'// import Left from '@/components/board/Left'import Left from './board/Left'import Center from './board/Center'import Right from './board/Right'Vue.use(dataV)// 注册必须的组件echarts.use([BarChart])export default {data() {let end = new Date()let start = new Date(`2022/01/01`)return {color: ['#568aea', '#020814'], // 第一行的背景色screenfullBut: false, //全屏configLoad: {// 加载数值number: [parseInt(parseInt(Math.random() * 20) + 30)],content: '{nt}%',style: {fontSize: 18,fill: '#3de7c9'}},isShowLoading: true, // 展示加载figureBG: 1, // 背景模式 1图片 0纯色date: [start, end], //选择时间pickerOptions: {shortcuts: [{text: '最近一个月',onClick(picker) {const end = new Date()const start = new Date()start.setTime(start.getTime() - 3600 * 1000 * 24 * 30)picker.$emit('pick', [start, end])}},{text: '最近三个月',onClick(picker) {const end = new Date()const start = new Date()start.setTime(start.getTime() - 3600 * 1000 * 24 * 90)picker.$emit('pick', [start, end])}},{text: '最近一年',onClick(picker) {const end = new Date()const start = new Date()start.setTime(start.getTime() - 3600 * 1000 * 24 * 365)picker.$emit('pick', [start, end])}}]}}},components: {Left,Center,Right},created() {if (localStorage.hasOwnProperty('figure-bg')) {// 初始化背景this.figureBG = localStorage.getItem('figure-bg')if (this.figureBG == 0) {this.color = ['#568aea', '#0e2140']}}},mounted() {for (let i = 0; i <= 4; i++) {setTimeout(() => {if (i == 4) {this.isShowLoading = falsethis.$nextTick(() => {this.init()})return}let num = i == 3 ? 100 : parseInt(Math.random() * 15) + 50 + 15 * ithis.configLoad = {number: [num],content: '{nt}%',style: {fontSize: 18,fill: '#3de7c9'}}}, i * 100)}},methods: {init() {// 传入时间,组件根据时间重新获取数据if (Object.is(this.date, null) || !(this.date instanceof Array)) {return}let start = new Date(this.date[0])let end = new Date(this.date[1])start = `${start.getFullYear()}-${this.fillNum(start.getMonth() + 1)}-${this.fillNum(start.getDate())} 00:00:00`end = `${end.getFullYear()}-${this.fillNum(end.getMonth() + 1)}-${this.fillNum(end.getDate())} 23:59:59`this.$refs.left.componentInit(start, end)this.$refs.center.componentInit(start, end)this.$refs.right.componentInit(start, end)},fillNum(num, size = 2) {return String.prototype.padStart.call(num, size, '0')},handleScreenfull() {if (!screenfull.isEnabled) {this.$message.error('您的浏览器无法使用全屏功能,请更换谷歌浏览器或者请手动点击F11按钮全屏展示!')这篇关于vue 项目下使用dataV和echarts 开发可视化大屏的文章就介绍到这儿,希望我们推荐的文章对编程师们有所帮助!


