本文主要是介绍IT学习笔记--日志收集系统EFK,希望对大家解决编程问题提供一定的参考价值,需要的开发者们随着小编来一起学习吧!
前言
EFK可能都不熟悉,实际上EFK是大名鼎鼎的日志系统ELK的一个变种。
在没有分布式日志的时候,每次出问题了需要查询日志的时候,需要登录到Linux服务器,使用命令cat -n xxxx|grep xxxx 搜索出日志在哪一行,然后cat -n xxx|tail -n +n行|head -n 显示多少行,这样不仅效率低下,而且对于程序异常也不方便查询,日志少还好,一旦整合出来的日志达到几个G或者几十G的时候,仅仅是搜索都会搜索很长时间了,当然如果知道是哪天什么时候发生的问题当然也方便查询,但是实际上很多时候有问题的时候,是不知道到底什么时候出的问题,所以就必须要在聚合日志中去搜索(一般日志是按照天来分文件的,聚合日志就是把很多天的日志合并在一起,这样方便查询),而搭建EFK日志分析系统的目的就是将日志聚合起来,达到快速查看快速分析的目的,使用EFK不仅可以快速的聚合出每天的日志,还能将不同项目的日志聚合起来,对于微服务和分布式架构来说,查询日志尤为方便,而且因为日志保存在Elasticsearch中,所以查询速度非常之快。
我认为,日志数据在以下几方面具有非常重要的作用:
- 数据查找:通过检索日志信息,定位相应的 bug ,找出解决方案
- 服务诊断:通过对日志信息进行统计、分析,了解服务器的负荷和服务运行状态
- 数据分析:可以做进一步的数据分析,比如根据请求中的课程 id ,找出 TOP10 用户感兴趣课程。
认识EFK
EFK不是一个软件,而是一套解决方案,并且都是开源软件,之间互相配合使用,完美衔接,高效的满足了很多场合的应用,是目前主流的一种日志系统。EFK是三个开源软件的缩写,分别表示:Elasticsearch , FileBeat, Kibana , 其中ELasticsearch负责日志保存和搜索,FileBeat负责收集日志,Kibana 负责界面,当然EFK和大名鼎鼎的ELK只有一个区别,那就是EFK把ELK的Logstash替换成了FileBeat,因为Filebeat相对于Logstash来说有2个好处:
1、侵入低,无需修改程序目前任何代码和配置
2、相对于Logstash来说性能高,Logstash对于IO占用很大
Filebeat 是基于 logstash-forwarder 的源码改造而成,用 Go语言编写,无需依赖 Java 环境,效率高,占用内存和 CPU 比较少,非常适合作为 Agent 跑在服务器上。当然,FileBeat也并不是完全好过Logstash,毕竟Logstash对于日志的格式化这些相对FileBeat好很多,FileBeat只是将日志从日志文件中读取出来,当然如果你日志本身是有一定格式的,FileBeat也可以格式化,但是相对于Logstash来说,还是差一点。
Elasticsearch
Elasticsearch是个开源分布式搜索引擎,提供搜集、分析、存储数据三大功能。它的特点有:分布式,零配置,自动发现,索引自动分片,索引副本机制,restful风格接口,多数据源,自动搜索负载等。
具有高可伸缩、高可靠、易管理等特点。可以用于全文检索、结构化检索和分析,并能将这三者结合起来。Elasticsearch 基于 Lucene 开发,现在使用最广的开源搜索引擎之一,Wikipedia 、StackOverflow、Github 等都基于它来构建自己的搜索引擎。
FileBeat
轻量级数据收集引擎。基于原先 Logstash-fowarder 的源码改造出来。换句话说:Filebeat就是新版的 Logstash-fowarder,也会是 ELK Stack 在 shipper 端的第一选择。
Filebeat隶属于Beats。目前Beats包含六种工具:
Packetbeat(搜集网络流量数据)
Metricbeat(搜集系统、进程和文件系统级别的 CPU 和内存使用情况等数据)
Filebeat(搜集文件数据)
Winlogbeat(搜集 Windows 事件日志数据)
Auditbeat( 轻量型审计日志采集器)
Heartbeat(轻量级服务器健康采集器)
Kibana
可视化化平台。它能够搜索、展示存储在 Elasticsearch 中索引数据。使用它可以很方便的用图表、表格、地图展示和分析数据。
可以为 Logstash 、Beats和 ElasticSearch 提供的日志分析友好的 Web 界面,可以帮助汇总、分析和搜索重要数据日志。
EFK架构图

常用日志收集架构及使用场景
1 最简单架构
在这种架构中,只有一个 Logstash、Elasticsearch 和 Kibana 实例。Logstash 通过输入插件从多种数据源(比如日志文件、标准输入 Stdin 等)获取数据,再经过滤插件加工数据,然后经 Elasticsearch 输出插件输出到 Elasticsearch,通过 Kibana 展示。详见图 1。
图 1. 最简单架构 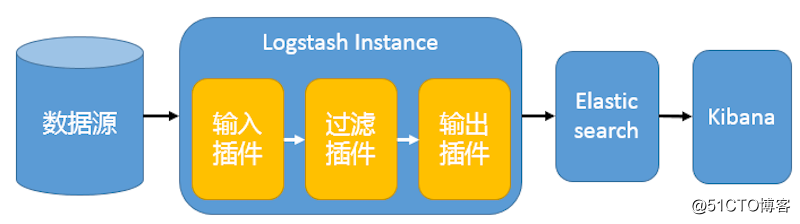
这种架构非常简单,使用场景也有限。初学者可以搭建这个架构,了解 ELK 如何工作。
2 Logstash 作为日志搜集器
这种架构是对上面架构的扩展,把一个 Logstash 数据搜集节点扩展到多个,分布于多台机器,将解析好的数据发送到 Elasticsearch server 进行存储,最后在 Kibana 查询、生成日志报表等。详见图 2。
图 2. Logstash 作为日志搜索器 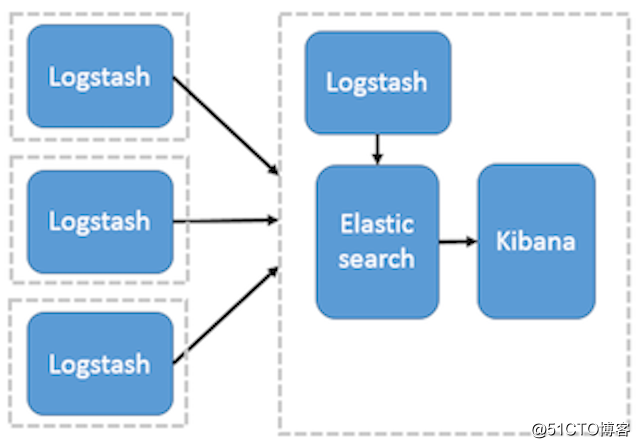
这种结构因为需要在各个服务器上部署 Logstash,而它比较消耗 CPU 和内存资源,所以比较适合计算资源丰富的服务器,否则容易造成服务器性能下降,甚至可能导致无法正常工作。
3 Beats 作为日志搜集器
这种架构引入 Beats 作为日志搜集器。目前 Beats 包括四种:
Packetbeat(搜集网络流量数据);
Topbeat(搜集系统、进程和文件系统级别的 CPU 和内存使用情况等数据);
Filebeat(搜集文件数据);
Winlogbeat(搜集 Windows 事件日志数据)。
Beats 将搜集到的数据发送到 Logstash,经 Logstash 解析、过滤后,将其发送到 Elasticsearch 存储,并由 Kibana 呈现给用户。详见图 3。
图 3. Beats 作为日志搜集器 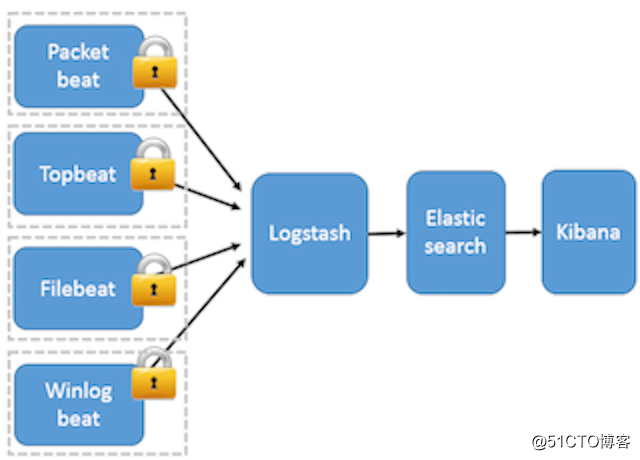
这种架构解决了 Logstash 在各服务器节点上占用系统资源高的问题。相比 Logstash,Beats 所占系统的 CPU 和内存几乎可以忽略不计。另外,Beats 和 Logstash 之间支持 SSL/TLS 加密传输,客户端和服务器双向认证,保证了通信安全。
因此这种架构适合对数据安全性要求较高,同时各服务器性能比较敏感的场景。
4 引入消息队列机制的架构
这种架构使用 Logstash 从各个数据源搜集数据,然后经消息队列输出插件输出到消息队列中。目前 Logstash 支持 Kafka、Redis、RabbitMQ 等常见消息队列。然后 Logstash 通过消息队列输入插件从队列中获取数据,分析过滤后经输出插件发送到 Elasticsearch,最后通过 Kibana 展示。详见图 4。
图 4. 引入消息队列机制的架构 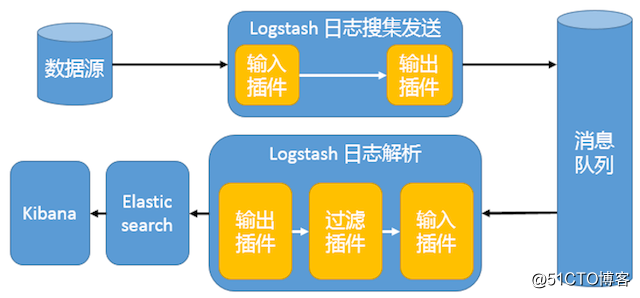
这种架构适合于日志规模比较庞大的情况。但由于 Logstash 日志解析节点和 Elasticsearch 的负荷比较重,可将他们配置为集群模式,以分担负荷。引入消息队列,均衡了网络传输,从而降低了网络闭塞,尤其是丢失数据的可能性,但依然存在 Logstash 占用系统资源过多的问题。
5 基于 Filebeat 架构的配置部署详解
前面提到 Filebeat 已经完全替代了 Logstash-Forwarder 成为新一代的日志采集器,同时鉴于它轻量、安全等特点,越来越多人开始使用它。这个章节将详细讲解如何部署基于 Filebeat 的 ELK 集中式日志解决方案,具体架构见图 5。
图 5. 基于 Filebeat 的 ELK 集群架构 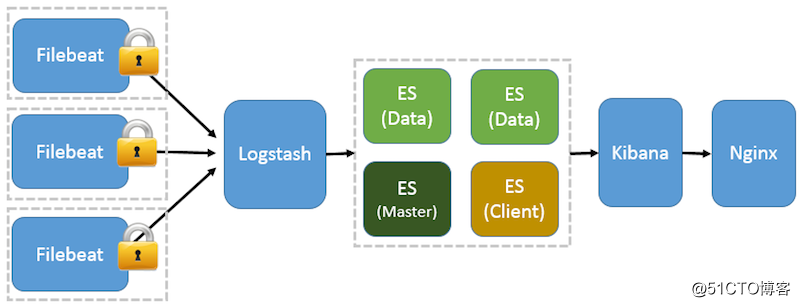
因为免费的 ELK 没有任何安全机制,所以这里使用了 Nginx 作反向代理,避免用户直接访问 Kibana 服务器。加上配置 Nginx 实现简单的用户认证,一定程度上提高安全性。另外,Nginx 本身具有负载均衡的作用,能够提高系统访问性能。
1. FileBeat
(1)概述:
Filebeat是一个日志文件托运工具,在你的服务器上安装客户端后,filebeat会监控日志目录或者指定的日志文件,追踪读取这些文件(追踪文件的变化,不停的读),并且转发这些信息到elasticsearch或者logstarsh中存放。
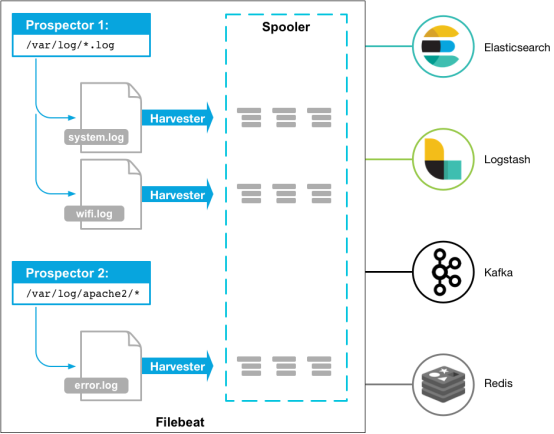
以下是filebeat的工作流程:当你开启filebeat程序的时候,它会启动一个或多个探测器(prospectors)去检测你指定的日志目录或文件,对于探测器找出的每一个日志文件,filebeat启动收割进程(harvester),每一个收割进程读取一个日志文件的新内容,并发送这些新的日志数据到处理程序(spooler),处理程序会集合这些事件,最后filebeat会发送集合的数据到你指定的地点。
(个人理解,filebeat是一个轻量级的logstash,当你需要收集信息的机器配置或资源并不是特别多时,使用filebeat来收集日志。日常使用中,filebeat十分稳定,笔者没遇到过宕机。)
(2)工作原理:
Filebeat由两个主要组成部分组成:prospector和 harvesters。这些组件一起工作来读取文件并将事件数据发送到您指定的output。
1)harvester是什么:
一个harvester负责读取一个单个文件的内容。
harvester逐行读取每个文件(一行一行地读取每个文件),并把这些内容发送到输出。每个文件启动一个harvester,harvester负责打开和关闭这个文件,这就意味着在harvester运行时文件描述符保持打开状态。
在harvester正在读取文件内容的时候,文件被删除或者重命名了,那么Filebeat会续读这个文件。这就有一个问题了,就是只要负责这个文件的harvester没用关闭,那么磁盘空间就不会释放。默认情况下,Filebeat保存文件打开直到close_inactive到达。
关闭harvester会产生以下结果:
1)如果在harvester仍在读取文件时文件被删除,则关闭文件句柄,释放底层资源。
2)文件的采集只会在scan_frequency过后重新开始。
3)如果在harvester关闭的情况下移动或移除文件,则不会继续处理文件。
要控制收割机何时关闭,请使用close_ *配置选项。
2)prospector是什么:
prospector 负责管理harvester并找到所有要读取的文件来源。如果输入类型为日志,则查找器将查找路径匹配的所有文件,并为每个文件启动一个harvester;每个prospector都在自己的Go协程中运行。
下面的例子配置Filebeat从所有匹配指定的glob模式的文件中读取行:
filebeat.inputs:
- type: logpaths:- /var/log/*.log- /var/path2/*.log
Filebeat目前支持两种prospector类型:log和stdin。
每个prospector类型可以定义多次。
log prospector检查每个文件以查看harvester是否需要启动,是否已经运行,或者该文件是否可以被忽略(请参阅ignore_older)。如果是在Filebeat运行过程中新创建的文件,只要在Harvster关闭后,文件大小发生了变化,新文件才会被Prospector选择到。
注:Filebeat prospector只能读取本地文件, 没有功能可以连接到远程主机来读取存储的文件或日志。
3)Filebeat如何保持文件状态
Filebeat保存每个文件的状态,并经常刷新状态到磁盘上的注册文件(registry)。状态用于记住harvester读取的最后一个偏移量,并确保所有日志行被发送(到输出)。如果输出,比如Elasticsearch 或者 Logstash等,无法访问,那么Filebeat会跟踪已经发送的最后一行,并只要输出再次变得可用时继续读取文件。当Filebeat运行时,会将每个文件的状态新保存在内存中。当Filebeat重新启动时,将使用注册文件中的数据重新构建状态,Filebeat将在最后一个已知位置继续每个harvester。
对于每个输入,Filebeat保存它找到的每个文件的状态。因为文件可以重命名或移动,所以文件名和路径不足以标识文件。对于每个文件,Filebeat存储惟一标识符,以检测文件是否以前读取过。
如果你的情况涉及每天创建大量的新文件,你可能会发现注册表文件变得太大了。
(画外音:Filebeat保存每个文件的状态,并将状态保存到registry_file中的磁盘。当重新启动Filebeat时,文件状态用于在以前的位置继续读取文件。如果每天生成大量新文件,注册表文件可能会变得太大。为了减小注册表文件的大小,有两个配置选项可用:clean_remove和clean_inactive。对于你不再访问且被忽略的旧文件,建议您使用clean_inactive。如果想从磁盘上删除旧文件,那么使用clean_remove选项。)
4) Filebeat如何确保至少投递一次(at-least-once)
Filebeat保证事件将被投递到配置的输出中至少一次,并且不会丢失数据。Filebeat能够实现这种行为,因为它将每个事件的投递状态存储在注册表文件中。在定义的输出被阻塞且没有确认所有事件的情况下,Filebeat将继续尝试发送事件,直到输出确认收到事件为止。
如果Filebeat在发送事件的过程中关闭了,则在关闭之前它不会等待输出确认所有事件。当Filebeat重新启动时,发送到输出(但在Filebeat关闭前未确认)的任何事件将再次发送。这确保每个事件至少被发送一次,但是你最终可能会将重复的事件发送到输出。你可以通过设置shutdown_timeout选项,将Filebeat配置为在关闭之前等待特定的时间。
注意:
Filebeat的至少一次交付保证包括日志轮换和删除旧文件的限制。如果将日志文件写入磁盘并且写入速度超过Filebeat可以处理的速度,或者在输出不可用时删除了文件,则可能会丢失数据。
在Linux上,Filebeat也可能因inode重用而跳过行。
(3)Filebeat简单使用
第1步:安装
第2步:配置
配置文件:filebeat.yml
为了配置Filebeat:
1. 定义日志文件路径
对于最基本的Filebeat配置,你可以使用单个路径。例如:
filebeat.inputs:
- type: logenabled: truepaths:- /var/log/*.log
在这个例子中,获取在/var/log/*.log路径下的所有文件作为输入,这就意味着Filebeat将获取/var/log目录下所有以.log结尾的文件。
为了从预定义的子目录级别下抓取所有文件,可以使用以下模式:/var/log/*/*.log。这将抓取/var/log的子文件夹下所有的以.log结尾的文件。它不会从/var/log文件夹本身抓取。目前,不可能递归地抓取这个目录下的所有子目录下的所有.log文件。
(画外音:
假设配置的输入路径是/var/log/*/*.log,假设目录结构是这样的:

那么只会抓取到2.log和3.log,而不会抓到1.log和4.log。因为/var/log/aaa/ccc/1.log和/var/log/4.log不会被抓到。
)
2. 如果你发送输出目录到Elasticsearch(并且不用Logstash),那么设置IP地址和端口以便能够找到Elasticsearch:
output.elasticsearch:hosts: ["192.168.1.42:9200"]3. 如果你打算用Kibana仪表盘,可以这样配置Kibana端点:
setup.kibana:host: "localhost:5601"4. 如果你的Elasticsearch和Kibana配置了安全策略,那么在你启动Filebeat之前需要在配置文件中指定访问凭据。例如:
output.elasticsearch:hosts: ["myEShost:9200"]username: "filebeat_internal"password: "{pwd}"
setup.kibana:host: "mykibanahost:5601"username: "my_kibana_user"  password: "{pwd}"
第3步:配置Filebeat以使用Logstash
如果你想使用Logstash对Filebeat收集的数据执行额外的处理,那么你需要将Filebeat配置为使用Logstash。
output.logstash:hosts: ["127.0.0.1:5044"]第4步:在Elasticsearch中加载索引模板
在Elasticsearch中,索引模板用于定义设置和映射,以确定如何分析字段。(画外音:相当于定义索引文档的数据结构,因为要把采集的数据转成标准格式输出)
Filebeat包已经安装了推荐的索引模板。如果你接受filebeat.yml中的默认配置,那么Filebeat在成功连接到Elasticsearch以后会自动加载模板。如果模板已经存在,不会覆盖,除非你配置了必须这样做。
通过在Filebeat配置文件中配置模板加载选项,你可以禁用自动模板加载,或者自动加载你自己的目标。
配置模板加载:
默认情况下,如果Elasticsearch输出是启用的,那么Filebeat会自动加载推荐的模板文件 ——— fields.yml。
- 加载不同的模板
-
setup.template.name: "your_template_name"
setup.template.fields: "path/to/fields.yml"
覆盖一个已存在的模板
-
setup.template.overwrite: true禁用自动加载模板
-
setup.template.enabled: false修改索引名称
-
# 默认情况下,Filebeat写事件到名为filebeat-6.3.2-yyyy.MM.dd的索引,其中yyyy.MM.dd是事件被索引的日期。为了用一个不同的名字,你可以在Elasticsearch输出中设置index选项。例如:output.elasticsearch.index: "customname-%{[beat.version]}-%{+yyyy.MM.dd}"
setup.template.name: "customname"
setup.template.pattern: "customname-*"
setup.dashboards.index: "customname-*"
手动加载模板:
./filebeat setup --template -E output.logstash.enabled=false -E 'output.elasticsearch.hosts=["localhost:9200"]'第5步:设置Kibana dashboards
Filebeat附带了Kibana仪表盘、可视化示例。在你用dashboards之前,你需要创建索引模式,filebeat-*,并且加载dashboards到Kibana中。为此,你可以运行setup命令或者在filebeat.yml配置文件中配置dashboard加载。
./filebeat setup --dashboards第6步:启动Filebeat
./filebeat -e -c filebeat.yml -d "publish"第7步:查看Kibana仪表板示例
http://127.0.0.1:5601完整的配置:
#=========================== Filebeat inputs ==============
filebeat.inputs:- type: logenabled: truepaths:- /var/log/*.log#============================== Dashboards ===============
setup.dashboards.enabled: false#============================== Kibana ==================
setup.kibana:host: "192.168.101.5:5601"#-------------------------- Elasticsearch output ---------
output.elasticsearch:hosts: ["localhost:9200"]
启动Elasticsearch:
/usr/local/programs/elasticsearch/elasticsearch-6.3.2/bin/elasticsearch
启动Kibana:
/usr/local/programs/kibana/kibana-6.3.2-linux-x86_64/bin/kibana
设置dashboard:
./filebeat setup --dashboards
启动Filebeat:
./filebeat -e -c filebeat.yml -d "publish"
浏览器访问 http://192.168.101.5:5601

查看索引:
请求:
curl -X GET "localhost:9200/_cat/indices?v"响应:
health status index                     uuid                   pri rep docs.count docs.deleted store.size pri.store.size
yellow open   bank                      59jD3B4FR8iifWWjrdMzUg   5   1       1000            0    475.1kb        475.1kb
green  open   .kibana                   DzGTSDo9SHSHcNH6rxYHHA   1   0        153           23    216.8kb        216.8kb
yellow open   filebeat-6.3.2-2018.08.08 otgYPvsgR3Ot-2GDcw_Upg   3   1        255            0     63.7kb         63.7kb
yellow open   customer                  DoM-O7QmRk-6f3Iuls7X6Q   5   1          1            0      4.5kb          4.5kb
更加详细的配置和说明参考:日志收集系统EFK之Filebeat 模块与配置
filebeat.yml(中文配置详解)
################### Filebeat Configuration Example ###################################################### Filebeat ######################################
filebeat:# List of prospectors to fetch data.prospectors:# Each - is a prospector. Below are the prospector specific configurations-# Paths that should be crawled and fetched. Glob based paths.# To fetch all ".log" files from a specific level of subdirectories# /var/log/*/*.log can be used.# For each file found under this path, a harvester is started.# Make sure not file is defined twice as this can lead to unexpected behaviour.# 指定要监控的日志,可以指定具体得文件或者目录paths:- /var/log/*.log  (这是默认的)(自行可以修改)(比如我放在/home/hadoop/app.log里)#- c:\programdata\elasticsearch\logs\*# Configure the file encoding for reading files with international characters# following the W3C recommendation for HTML5 (http://www.w3.org/TR/encoding).# Some sample encodings:#   plain, utf-8, utf-16be-bom, utf-16be, utf-16le, big5, gb18030, gbk,#    hz-gb-2312, euc-kr, euc-jp, iso-2022-jp, shift-jis, ...# 指定被监控的文件的编码类型,使用plain和utf-8都是可以处理中文日志的#encoding: plain# Type of the files. Based on this the way the file is read is decided.# The different types cannot be mixed in one prospector## Possible options are:# * log: Reads every line of the log file (default)# * stdin: Reads the standard in# 指定文件的输入类型log(默认)或者stdininput_type: log# Exclude lines. A list of regular expressions to match. It drops the lines that are# matching any regular expression from the list. The include_lines is called before# 在输入中排除符合正则表达式列表的那些行。# exclude_lines. By default, no lines are dropped.# exclude_lines: ["^DBG"]# Include lines. A list of regular expressions to match. It exports the lines that are# matching any regular expression from the list. The include_lines is called before# exclude_lines. By default, all the lines are exported.# 包含输入中符合正则表达式列表的那些行(默认包含所有行),include_lines执行完毕之后会执行exclude_lines# include_lines: ["^ERR", "^WARN"]# Exclude files. A list of regular expressions to match. Filebeat drops the files that# are matching any regular expression from the list. By default, no files are dropped.# 忽略掉符合正则表达式列表的文件# exclude_files: [".gz$"]# Optional additional fields. These field can be freely picked# to add additional information to the crawled log files for filtering# 向输出的每一条日志添加额外的信息,比如“level:debug”,方便后续对日志进行分组统计。# 默认情况下,会在输出信息的fields子目录下以指定的新增fields建立子目录,例如fields.level# 这个得意思就是会在es中多添加一个字段,格式为 "filelds":{"level":"debug"}#fields:#  level: debug#  review: 1# Set to true to store the additional fields as top level fields instead# of under the "fields" sub-dictionary. In case of name conflicts with the# fields added by Filebeat itself, the custom fields overwrite the default# fields.# 如果该选项设置为true,则新增fields成为顶级目录,而不是将其放在fields目录下。# 自定义的field会覆盖filebeat默认的field# 如果设置为true,则在es中新增的字段格式为:"level":"debug"#fields_under_root: false# Ignore files which were modified more then the defined timespan in the past.# In case all files on your system must be read you can set this value very large.# Time strings like 2h (2 hours), 5m (5 minutes) can be used.# 可以指定Filebeat忽略指定时间段以外修改的日志内容,比如2h(两个小时)或者5m(5分钟)。#ignore_older: 0# Close older closes the file handler for which were not modified# for longer then close_older# Time strings like 2h (2 hours), 5m (5 minutes) can be used.# 如果一个文件在某个时间段内没有发生过更新,则关闭监控的文件handle。默认1h#close_older: 1h# Type to be published in the 'type' field. For Elasticsearch output,# the type defines the document type these entries should be stored# in. Default: log# 设定Elasticsearch输出时的document的type字段 可以用来给日志进行分类。Default: log#document_type: log# Scan frequency in seconds.# How often these files should be checked for changes. In case it is set# to 0s, it is done as often as possible. Default: 10s# Filebeat以多快的频率去prospector指定的目录下面检测文件更新(比如是否有新增文件)# 如果设置为0s,则Filebeat会尽可能快地感知更新(占用的CPU会变高)。默认是10s#scan_frequency: 10s# Defines the buffer size every harvester uses when fetching the file# 每个harvester监控文件时,使用的buffer的大小#harvester_buffer_size: 16384# Maximum number of bytes a single log event can have# All bytes after max_bytes are discarded and not sent. The default is 10MB.# This is especially useful for multiline log messages which can get large.# 日志文件中增加一行算一个日志事件,max_bytes限制在一次日志事件中最多上传的字节数,多出的字节会被丢弃#max_bytes: 10485760# Mutiline can be used for log messages spanning multiple lines. This is common# for Java Stack Traces or C-Line Continuation# 适用于日志中每一条日志占据多行的情况,比如各种语言的报错信息调用栈#multiline:# The regexp Pattern that has to be matched. The example pattern matches all lines starting with [# 多行日志开始的那一行匹配的pattern#pattern: ^\[# Defines if the pattern set under pattern should be negated or not. Default is false.# 是否需要对pattern条件转置使用,不翻转设为true,反转设置为false。  【建议设置为true】#negate: false# Match can be set to "after" or "before". It is used to define if lines should be append to a pattern# that was (not) matched before or after or as long as a pattern is not matched based on negate.# Note: After is the equivalent to previous and before is the equivalent to to next in Logstash# 匹配pattern后,与前面(before)还是后面(after)的内容合并为一条日志#match: after# The maximum number of lines that are combined to one event.# In case there are more the max_lines the additional lines are discarded.# Default is 500# 合并的最多行数(包含匹配pattern的那一行)#max_lines: 500# After the defined timeout, an multiline event is sent even if no new pattern was found to start a new event# Default is 5s.# 到了timeout之后,即使没有匹配一个新的pattern(发生一个新的事件),也把已经匹配的日志事件发送出去#timeout: 5s# Setting tail_files to true means filebeat starts readding new files at the end# instead of the beginning. If this is used in combination with log rotation# this can mean that the first entries of a new file are skipped.# 如果设置为true,Filebeat从文件尾开始监控文件新增内容,把新增的每一行文件作为一个事件依次发送,# 而不是从文件开始处重新发送所有内容#tail_files: false# Backoff values define how agressively filebeat crawls new files for updates# The default values can be used in most cases. Backoff defines how long it is waited# to check a file again after EOF is reached. Default is 1s which means the file# is checked every second if new lines were added. This leads to a near real time crawling.# Every time a new line appears, backoff is reset to the initial value.# Filebeat检测到某个文件到了EOF(文件结尾)之后,每次等待多久再去检测文件是否有更新,默认为1s#backoff: 1s# Max backoff defines what the maximum backoff time is. After having backed off multiple times# from checking the files, the waiting time will never exceed max_backoff idenependent of the# backoff factor. Having it set to 10s means in the worst case a new line can be added to a log# file after having backed off multiple times, it takes a maximum of 10s to read the new line# Filebeat检测到某个文件到了EOF之后,等待检测文件更新的最大时间,默认是10秒#max_backoff: 10s# The backoff factor defines how fast the algorithm backs off. The bigger the backoff factor,# the faster the max_backoff value is reached. If this value is set to 1, no backoff will happen.# The backoff value will be multiplied each time with the backoff_factor until max_backoff is reached# 定义到达max_backoff的速度,默认因子是2,到达max_backoff后,变成每次等待max_backoff那么长的时间才backoff一次,# 直到文件有更新才会重置为backoff# 根据现在的默认配置是这样的,每隔1s检测一下文件变化,如果连续检测两次之后文件还没有变化,下一次检测间隔时间变为10s#backoff_factor: 2# This option closes a file, as soon as the file name changes.# This config option is recommended on windows only. Filebeat keeps the files it's reading open. This can cause# issues when the file is removed, as the file will not be fully removed until also Filebeat closes# the reading. Filebeat closes the file handler after ignore_older. During this time no new file with the# same name can be created. Turning this feature on the other hand can lead to loss of data# on rotate files. It can happen that after file rotation the beginning of the new# file is skipped, as the reading starts at the end. We recommend to leave this option on false# but lower the ignore_older value to release files faster.# 这个选项关闭一个文件,当文件名称的变化。#该配置选项建议只在windows#force_close_files: false# Additional prospector#-# Configuration to use stdin input#input_type: stdin# General filebeat configuration options## Event count spool threshold - forces network flush if exceeded# spooler的大小,spooler中的事件数量超过这个阈值的时候会清空发送出去(不论是否到达超时时间)#spool_size: 2048# Enable async publisher pipeline in filebeat (Experimental!)# 是否采用异步发送模式(实验功能)#publish_async: false# Defines how often the spooler is flushed. After idle_timeout the spooler is# Flush even though spool_size is not reached.# spooler的超时时间,如果到了超时时间,spooler也会清空发送出去(不论是否到达容量的阈值)#idle_timeout: 5s# Name of the registry file. Per default it is put in the current working# directory. In case the working directory is changed after when running# filebeat again, indexing starts from the beginning again.# 记录filebeat处理日志文件的位置的文件,默认是在启动的根目录下#registry_file: .filebeat# Full Path to directory with additional prospector configuration files. Each file must end with .yml# These config files must have the full filebeat config part inside, but only# the prospector part is processed. All global options like spool_size are ignored.# The config_dir MUST point to a different directory then where the main filebeat config file is in.# 如果要在本配置文件中引入其他位置的配置文件,可以写在这里(需要写完整路径),但是只处理prospector的部分#config_dir:###############################################################################
############################# Libbeat Config ##################################
# Base config file used by all other beats for using libbeat features############################# Output ########################################### Configure what outputs to use when sending the data collected by the beat.
# Multiple outputs may be used.
output:### Elasticsearch as outputelasticsearch:            (这是默认的,filebeat收集后放到es里)(自行可以修改,比如我有时候想filebeat收集后,然后到redis,再到es,就可以注销这行)# Array of hosts to connect to.# Scheme and port can be left out and will be set to the default (http and 9200)# In case you specify and additional path, the scheme is required: http://localhost:9200/path# IPv6 addresses should always be defined as: https://[2001:db8::1]:9200hosts: ["localhost:9200"]        (这是默认的,filebeat收集后放到es里)(自行可以修改,比如我有时候想filebeat收集后,然后到redis,再到es,就可以注销这行)
# Optional protocol and basic auth credentials. #protocol: "https" #username: "admin" #password: "s3cr3t" # Number of workers per Elasticsearch host. #worker: 1 # Optional index name. The default is "filebeat" and generates # [filebeat-]YYYY.MM.DD keys. #index: "filebeat" # A template is used to set the mapping in Elasticsearch # By default template loading is disabled and no template is loaded. # These settings can be adjusted to load your own template or overwrite existing ones #template: # Template name. By default the template name is filebeat. #name: "filebeat" # Path to template file #path: "filebeat.template.json" # Overwrite existing template #overwrite: false # Optional HTTP Path #path: "/elasticsearch" # Proxy server url #proxy_url: http://proxy:3128 # The number of times a particular Elasticsearch index operation is attempted. If # the indexing operation doesn't succeed after this many retries, the events are # dropped. The default is 3. #max_retries: 3 # The maximum number of events to bulk in a single Elasticsearch bulk API index request. # The default is 50. #bulk_max_size: 50 # Configure http request timeout before failing an request to Elasticsearch. #timeout: 90 # The number of seconds to wait for new events between two bulk API index requests. # If `bulk_max_size` is reached before this interval expires, addition bulk index # requests are made. #flush_interval: 1 # Boolean that sets if the topology is kept in Elasticsearch. The default is # false. This option makes sense only for Packetbeat. #save_topology: false # The time to live in seconds for the topology information that is stored in # Elasticsearch. The default is 15 seconds. #topology_expire: 15 # tls configuration. By default is off. #tls: # List of root certificates for HTTPS server verifications #certificate_authorities: ["/etc/pki/root/ca.pem"] # Certificate for TLS client authentication #certificate: "/etc/pki/client/cert.pem" # Client Certificate Key #certificate_key: "/etc/pki/client/cert.key" # Controls whether the client verifies server certificates and host name. # If insecure is set to true, all server host names and certificates will be # accepted. In this mode TLS based connections are susceptible to # man-in-the-middle attacks. Use only for testing. #insecure: true # Configure cipher suites to be used for TLS connections #cipher_suites: [] # Configure curve types for ECDHE based cipher suites #curve_types: [] # Configure minimum TLS version allowed for connection to logstash #min_version: 1.0 # Configure maximum TLS version allowed for connection to logstash #max_version: 1.2 ### Logstash as output #logstash: # The Logstash hosts #hosts: ["localhost:5044"] # Number of workers per Logstash host. #worker: 1 # The maximum number of events to bulk into a single batch window. The # default is 2048. #bulk_max_size: 2048 # Set gzip compression level. #compression_level: 3 # Optional load balance the events between the Logstash hosts #loadbalance: true # Optional index name. The default index name depends on the each beat. # For Packetbeat, the default is set to packetbeat, for Topbeat # top topbeat and for Filebeat to filebeat. #index: filebeat # Optional TLS. By default is off. #tls: # List of root certificates for HTTPS server verifications #certificate_authorities: ["/etc/pki/root/ca.pem"] # Certificate for TLS client authentication #certificate: "/etc/pki/client/cert.pem" # Client Certificate Key #certificate_key: "/etc/pki/client/cert.key" # Controls whether the client verifies server certificates and host name. # If insecure is set to true, all server host names and certificates will be # accepted. In this mode TLS based connections are susceptible to # man-in-the-middle attacks. Use only for testing. #insecure: true # Configure cipher suites to be used for TLS connections #cipher_suites: [] # Configure curve types for ECDHE based cipher suites #curve_types: [] ### File as output #file: # Path to the directory where to save the generated files. The option is mandatory. #path: "/tmp/filebeat" # Name of the generated files. The default is `filebeat` and it generates files: `filebeat`, `filebeat.1`, `filebeat.2`, etc. #filename: filebeat # Maximum size in kilobytes of each file. When this size is reached, the files are # rotated. The default value is 10 MB. #rotate_every_kb: 10000 # Maximum number of files under path. When this number of files is reached, the # oldest file is deleted and the rest are shifted from last to first. The default # is 7 files. #number_of_files: 7 ### Console output # console: # Pretty print json event #pretty: false ############################# Shipper ######################################### shipper: # The name of the shipper that publishes the network data. It can be used to group # all the transactions sent by a single shipper in the web interface. # If this options is not defined, the hostname is used. #name: # The tags of the shipper are included in their own field with each # transaction published. Tags make it easy to group servers by different # logical properties. #tags: ["service-X", "web-tier"] # Uncomment the following if you want to ignore transactions created # by the server on which the shipper is installed. This option is useful # to remove duplicates if shippers are installed on multiple servers. #ignore_outgoing: true # How often (in seconds) shippers are publishing their IPs to the topology map. # The default is 10 seconds. #refresh_topology_freq: 10 # Expiration time (in seconds) of the IPs published by a shipper to the topology map. # All the IPs will be deleted afterwards. Note, that the value must be higher than # refresh_topology_freq. The default is 15 seconds. #topology_expire: 15 # Internal queue size for single events in processing pipeline #queue_size: 1000 # Configure local GeoIP database support. # If no paths are not configured geoip is disabled. #geoip: #paths: # - "/usr/share/GeoIP/GeoLiteCity.dat" # - "/usr/local/var/GeoIP/GeoLiteCity.dat" ############################# Logging ######################################### # There are three options for the log ouput: syslog, file, stderr. # Under Windos systems, the log files are per default sent to the file output, # under all other system per default to syslog. # 建议在开发时期开启日志并把日志调整为debug或者info级别,在生产环境下调整为error级别 # 开启日志 必须设置to_files 属性为true logging: # Send all logging output to syslog. On Windows default is false, otherwise # default is true. # 配置beats日志。日志可以写入到syslog也可以是轮滚日志文件。默认是syslog # tail -f /var/log/messages #to_syslog: true # Write all logging output to files. Beats automatically rotate files if rotateeverybytes # limit is reached. # 日志发送到轮滚文件 #to_files: false # To enable logging to files, to_files option has to be set to true # to_files设置为true才可以开启轮滚日志记录 files: # The directory where the log files will written to. # 指定日志路径 #path: /var/log/mybeat # The name of the files where the logs are written to. # 指定日志名称 #name: mybeat # Configure log file size limit. If limit is reached, log file will be # automatically rotated # 默认文件达到10M就会滚动生成新文件 rotateeverybytes: 10485760 # = 10MB # Number of rotated log files to keep. Oldest files will be deleted first. # 保留日志文件周期。 默认 7天。值范围为2 到 1024 #keepfiles: 7 # Enable debug output for selected components. To enable all selectors use ["*"] # Other available selectors are beat, publish, service # Multiple selectors can be chained. #selectors: [ ] # Sets log level. The default log level is error. # Available log levels are: critical, error, warning, info, debug # 日志级别,默认是error #level: error下一篇介绍Kibana: IT学习笔记--日志收集系统EFK之Kibana
参考文章:
日志搜集系统从ELK到EFK;
efk日志系统搭建;
Filebeat中文指南;
Elasticsearch 快速开始;
开始使用Filebeat;
Logstash 性能及其替代方案;
这篇关于IT学习笔记--日志收集系统EFK的文章就介绍到这儿,希望我们推荐的文章对编程师们有所帮助!


