本文主要是介绍【D3.js 学习记录】——Force 力导图数据可视化,希望对大家解决编程问题提供一定的参考价值,需要的开发者们随着小编来一起学习吧!
Force 力导图
- 对数据结构要求比较严格
- forceSimulation() 与一般的data join不太一样,可以理解为它是d3这么一个大的可视化库中的一个小库
运作机制
输入一批结点List
let nodes = [{},{},{},{}]
set simulation = d3.forceSimulation(nodes)
定义simulation后会发生:
- 补全 nodes 中每个结点的数据结构
index(编号),x,y(相对于画布的坐标),vx,vy(两个方向上的速度) - 开始模拟粒子运动
- 粒子质量为1
- 不断通过内部 timer 触发 ‘tick’ 事件
- 根据一系列的 ‘力’ 来计算每个粒子的加速度,速度,位置
三个属性
d3.forceManyBody
- 粒子之间两两作用的力,如果为正就互相吸引,为负就互相排斥
- strength 为正互相吸引,为负则互相排斥
即规定是万有引力还是万有斥力,数值是力的大小
d3.forceCenter
- 指向某一个中心的力,会尽可能让粒子向中心靠近或重合(通常定位画布中央)
d3.forceLink
- 粒子之间两两的作用力
- 让互相之间有link的节点保持一个特定的距离
在保持一定距离的前提下,没有力
若超出该范围,就会多增加一个力 - 给图连边用的,最后要设置strength和distance,strength规定了力的大小,distance规定了两两结点连边的距离范围
tick事件
d3.forceSimulation()通过tick事件来更新节点的状态的,状态包括位置,速度,加速度等
更新后的状态仅仅为状态
- 不会反映到任何图元
- 仅对数据进行修改
人为设置每次tick要如何更新图元
simulation.on('tick',ticked);
配置simulation
- 在初始化每个图元后,只要为simulation配置了’tick’的回调,simulation会自动开始模拟。
- 注意:simulation.stop()会停止timer的tick循环
配置simulation一般用上文介绍的三个属性:
- d3.forceLink
- d3.forceCenter
- d3.forceManyBody
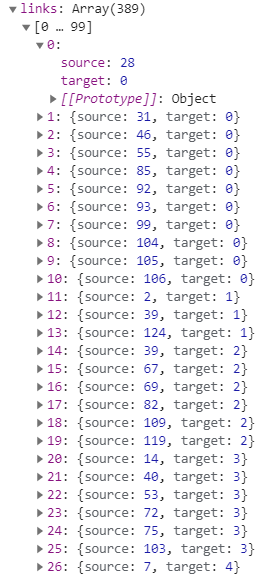
图形数据
外层object
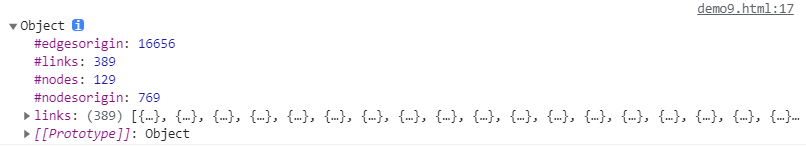
内层links
代码实现
实现分为4个步骤
数据预处理
links = data.links //边的集合
//创建一个节点的集合
nodes = [];
for (let i  = 0 ; i < data['#nodes'] ; i++){nodes.push({'index': i })
}
图元初始化,data join
const render_init = function(){lines = svg.selectAll('line').data(links).join('line').attr('stroke', 'black').attr('opacity', 1).attr('stroke-width', 1);circles = svg.selectAll('circle').data(nodes).enter().append('circle').attr('r', 5).attr('fill', 'blue')// .call(drag);
}
力模拟
simulation = d3.forceSimulation(nodes).force('manybody', d3.forceManyBody().strength(-30)).force('center', d3.forceCenter(width/2,height/2)).force('link',d3.forceLink(links).strength(0.1).distance(100))
将模拟的力反应在图元上,用ticked更新图元
let circle,line;
const ticked = function(){
lines.attr('x1', d => d.source.x)
.attr('y1', d => d.source.y)
.attr('x2', d => d.target.x)
.attr('y2', d => d.target.y);
circles
.attr('cx', d => d.x)
.attr('cy', d => d.y);
};simulation.on('tick',ticked)
所有调用流程如下
d3.json('datapath').then(data => {data-preprocessing();//预处理render_init();//图元初始化simulation();//力模拟simulation.on('tick',tick);//tick
})
可视化代码
<!DOCTYPE html>
<html><head><title>Force</title><script src="./js/d3.min.js"></script></head><body><svg width="1800" height="920" id="mainsvg" class="svgs"></svg><script>let svg = d3.select('#mainsvg');var width = svg.attr('width'), height = svg.attr('height');let nodes, links;let circles, lines;let simulation;const render_init = function(){lines = svg.selectAll('line').data(links).join('line').attr('stroke', 'black').attr('opacity', 1).attr('stroke-width', 1);circles = svg.selectAll('circle').data(nodes).enter().append('circle').attr('r', 5).attr('fill', 'blue')// .call(drag);}const ticked = function(){lines.attr('x1', d => d.source.x).attr('y1', d => d.source.y).attr('x2', d => d.target.x).attr('y2', d => d.target.y);circles.attr('cx', d => d.x).attr('cy', d => d.y);}d3.json('./data/socfb-Caltech36.json').then(data => {links = data.links//创建一个节点的集合nodes = [];for (let i  = 0 ; i < data['#nodes'] ; i++){nodes.push({'index': i })}console.log(nodes);render_init(); //图元初始化,datajoin line 和 circlesimulation = d3.forceSimulation(nodes).force('manybody', d3.forceManyBody().strength(-30)).force('center', d3.forceCenter(width/2,height/2)).force('link',d3.forceLink(links).strength(0.1).distance(100)).on('tick',ticked)})</script></body>
</html>
可视化效果

这篇关于【D3.js 学习记录】——Force 力导图数据可视化的文章就介绍到这儿,希望我们推荐的文章对编程师们有所帮助!


