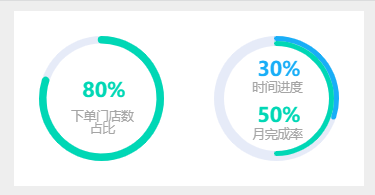
本文主要是介绍vue环进度图、双环进度图 - echart图表,希望对大家解决编程问题提供一定的参考价值,需要的开发者们随着小编来一起学习吧!
如图所示:

代码如下:(复制另存txt,修改.html直接运行)
<!DOCTYPE html>
<html>
<head><meta charset="utf-8"><title>环进度图、双环进度图 - echart图表</title><!-- 引入样式 --><link rel="stylesheet" href="https://unpkg.com/element-ui/lib/theme-chalk/index.css"><style>#app{display: flex;justify-content: center;}.testChart{width: 100px;height: 100px;background: #fff;padding: 20px;}</style>
</head>
<body style="background: #eee;"><div id="app"><div ref="testOne" class="testChart"></div><div ref="testTwo" class="testChart"></div></div>
</body><script src="https://lib.baomitu.com/vue/2.6.14/vue.js"></script>
<!-- 引入组件库 -->
<script src="https://unpkg.com/element-ui/lib/index.js"></script>
<!-- 引入 echart -->
<script src="https://lib.baomitu.com/echarts/5.2.0/echarts.min.js"></script><script>new Vue({el: '#app',data() {return { myTestOneChart:{},myTestTwoChart:{},}},mounted(){this.testOneChart()this.testTwoChart()window.onresize = ()=>{ //窗口变化自动重载this.myTestOneChart.resize()this.myTestTwoChart.resize()}},methods: {testOneChart(){this.myTestOneChart = echarts.init(this.$refs.testOne);let option = {series: [{type: 'gauge',radius: '100%',startAngle: 90,endAngle: -270,pointer: {show: false},progress: {show: true,overlap: false,roundCap: true,clip: true,itemStyle: {// borderWidth: 10,// borderColor: ['#FFC16B','#0050E7']}},axisLine: {lineStyle: {width: 6,borderColor: '#04BEFB'}},splitLine: {show: false,distance: 0,length: 10},axisTick: {show: false},axisLabel: {show: false,distance: 5},color:"#00D7B5",data: [{value: 80,name: '下单门店数\n占比',title: {offsetCenter: ['1%', '40%'],},detail: {offsetCenter: ['4%', '-10%']}},],title: {fontSize: 10,color: '#A5A5A5',},detail: {width: 15,height: 6,fontSize: 16,color: 'auto',borderColor: 'auto',fontFamily: "FinFont-Bold, FinFont",// borderRadius: 20,// borderWidth: 8,formatter: '{value}%'}}]}// 使用刚指定的配置项和数据显示图表。this.myTestOneChart.setOption(option);},testTwoChart(){this.myTestTwoChart = echarts.init(this.$refs.testTwo);let option = {series: [{type: 'gauge',radius: '100%',startAngle: 90,endAngle: -270,pointer: {show: false},progress: {show: true,overlap: false,roundCap: true,clip: true,itemStyle: {// borderWidth: 10,// borderColor: ['#FFC16B','#0050E7']}},axisLine: {lineStyle: {width: 8,borderColor: '#04BEFB'}},splitLine: {show: false,distance: 0,length: 10},axisTick: {show: false},axisLabel: {show: false,distance: 5},color:["#19AEF7","#00D7B5"],data: [{value: 30,name: '时间进度',title: {offsetCenter: ['1%', '-15%']},detail: {offsetCenter: ['4%', '-45%']},itemStyle: {fontSize: 13,}},{value: 50,name: '月完成率',title: {offsetCenter: ['1%', '60%'],},detail: {offsetCenter: ['4%', '30%']}},],title: {fontSize: 10,color: '#A5A5A5',},detail: {width: 15,height: 6,fontSize: 16,color: 'auto',borderColor: 'auto',fontFamily: "FinFont-Bold, FinFont",// borderRadius: 20,// borderWidth: 8,formatter: '{value}%'}}]}// 使用刚指定的配置项和数据显示图表。this.myTestTwoChart.setOption(option);},}})
</script>
</html>
备注:
来隔壁部门支援,我的天呐,他们真的是996,震惊!!!
这篇关于vue环进度图、双环进度图 - echart图表的文章就介绍到这儿,希望我们推荐的文章对编程师们有所帮助!


