本文主要是介绍vue 实现水波进度条和环形进度条效果,希望对大家解决编程问题提供一定的参考价值,需要的开发者们随着小编来一起学习吧!
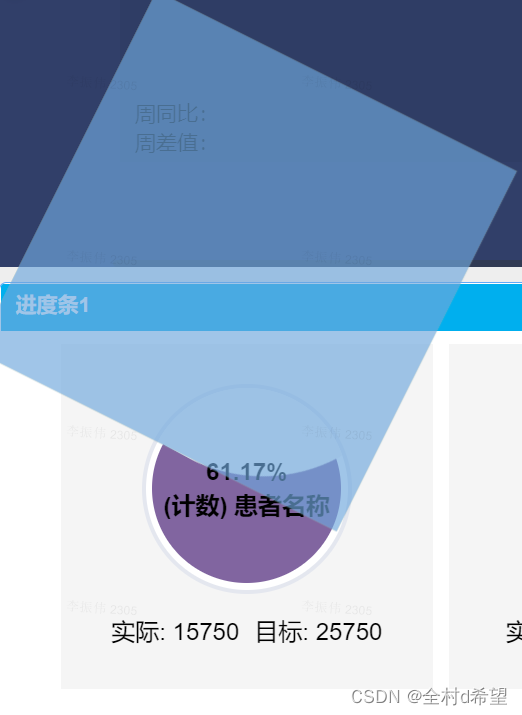
一. 水波进度条具体效果

先说下具体实现思路
首选使用div画出一个圆, 把外轮廓画出来
下面是是html结构
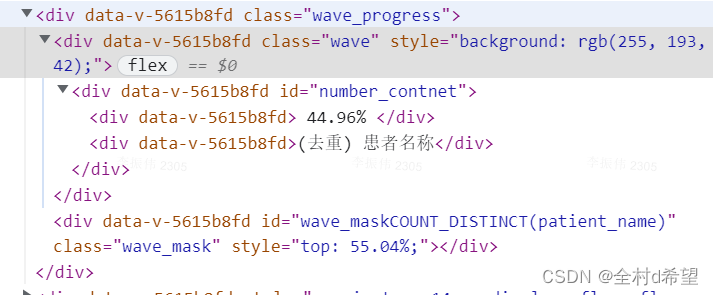
颜色可以根据自己的需要设置, 具体波浪实现思路是, 画一个带有圆角的div, 定位到这个原型的上面,然后使用css动画来进行无限旋转即可
然后贴上全部代码
<!-- eslint-disable vue/multi-word-component-names -->
<template><divclass="wave_content":style="{height: height + 'px', background: styles.compConfig.type === 'dark' ? '#2f3d65' : '#f5f5f5'}"><div class="wave_progress"><divclass="wave":style="{background: color}"><div id="number_contnet"><div> {{ percent }} </div><div>{{ title }}</div></div></div><div:id="'wave_mask' + index"class="wave_mask":style="{top: 100 - percentage === 0 ? (-90000 + '%') : 100 - percentage + '%'}"/></div><div style="margin-top: 14px; display:flex; flex-wrap:wrap"><spanv-show="showActual"style="font-weight: 500;margin-right: 10px">实际: {{ actual }}</span><spanv-show="showObjective"style="font-weight: 500">目标: {{ objective }}</span></div></div>
</template><script>
export default {props: {data: {type: Object,default: () => {}},height: { // 可以动态设置高度type: [Number, String],default: 230},index: { // 使用v-for渲染时 index要唯一type: [String, Number],default: 0},percentage: { // 进度为 0 - 100 type: [Number],default: 0},percent: { // 自己计算的百分比type: [Number, String],default: 0},title: {type: String,default: ''},actual: { // 实际值type: String,default: ''},objective: { // 目标值type: String,default: ''},showActual: {type: Boolean,default: true},showObjective: {type: Boolean,default: true},color: { // 背景颜色type: String,default: ''}},data() {return {styles: this.data.styles,};},mounted() {},destroyed() {},methods: {}
};
</script><style lang="less" scoped>
@keyframes spin {50% {transform: translate(-50%, -101%) rotate(500deg);}100% {transform: translate(-50%, -101%) rotate(1000deg);}
}
.wave_content {width: 100%;display: flex;justify-content: center;flex-direction: column;align-items: center;padding: 0 10px;box-sizing: border-box;
}
.wave_progress {width: 140px;height: 140px;border-radius: 50%;background: #ffffff;overflow: hidden;position: relative;border: 3px solid #e4e7ef;padding: 4px;box-sizing: border-box;.wave {position: relative;width: 100%;height: 100%;// background-image: linear-gradient(-180deg, #07c2b7 13%, #07c2b7 100%);border-radius: 50%;display: flex;flex-direction: column;align-items: center;justify-content: center;box-sizing: border-box;}.wave_mask {position: absolute;width: 200%;height: 200%;top: 0;left: 50%;border-radius: 40%;transform: translate(-50%, -101%) rotate(0);animation-name: spin;animation-timing-function: linear;animation-delay: 0s;animation-duration: 16s;animation-iteration-count: infinite;z-index: 20;background-color: #f5f5f5;}
}
#number_contnet {position: absolute;color: #000;font-size: 16px;font-weight: bold;text-align: center;z-index: 100;
}
</style>
二. 环形进度条
实现效果
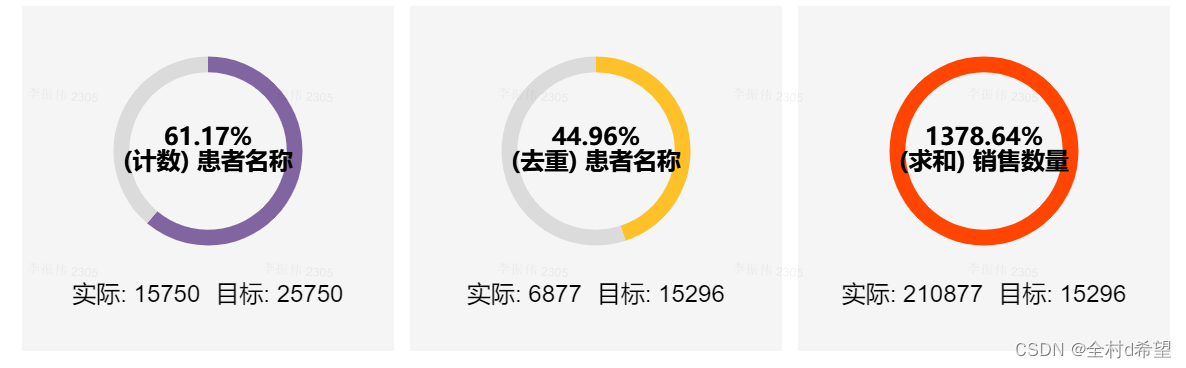
实现思路是使用echarts的pie扇形图来绘制
主要是设置radius: [‘75%’, ‘90%’],来实现镂空效果
贴上代码
<!-- eslint-disable vue/multi-word-component-names -->
<template><divclass="percentloop":style="{height: height + 'px',background: styles.compConfig.type === 'dark' ? '#2f3d65' : '#f5f5f5'}"><div:id="forId(index)":ref="forId(index)":key="index"style="height: 140px;width: 140px"class="chart-box"/><div style="margin-top: 14px; display:flex; flex-wrap:wrap"><spanv-show="showActual"style="font-weight: 500;margin-right: 10px">实际: {{ actual }}</span><spanv-show="showObjective"style="font-weight: 500">目标: {{ objective }}</span></div></div>
</template><script>
// import echarts from 'src/utils/echartsLoader.js';
import echarts from 'echarts';export default {props: {data: {type: Object,default: () => {}},height: {type: [Number, String],default: 230},index: { // 使用时要保证index 唯一type: [String, Number],default: 0},percentage: { // 进度不必是0-100,值随意, 因为下面有处理type: [Number],default: 0},percent: { // 百分比type: [Number, String],default: 0},title: {type: String,default: ''},actual: { // 实际值type: String,default: ''},objective: { // 目标值type: String,default: ''},showActual: {type: Boolean,default: true},showObjective: {type: Boolean,default: true},color: {type: String,default: ''},},data () {return {styles: this.data.styles};},watch: {percent: { // 百分比变化重新绘制, 可根据业务自行修改要监听的数据handler() {this.$nextTick(() => {this.init();});}},color: { // 颜色变化重新绘制handler() {this.$nextTick(() => {this.init();});}},},mounted() {this.init(); // 渲染完成后绘制},methods: {handlerNumber(num) {  // 函数可处理带% 和千分位的数据, 转化成number给echarts使用, 因为echarts 只能接收number 类型的数据let strNum = JSON.parse(JSON.stringify(num));if (strNum.includes(',')) {strNum = strNum.split(',').reduce((pre, item) => {return pre += item;}, '');}if (strNum.includes('%')) {strNum = strNum.split('%')[0] / 100;}return +strNum;},init() {const actual = this.handlerNumber(this.actual);const objective = this.handlerNumber(this.objective);// console.log('还原的数', actual, objective);// const dom = this.$refs[this.forId(this.index)];const dom = document.getElementById(this.forId(this.index));const chart = echarts.init(dom);// 使用镂空饼图模拟进度条chart.setOption({color: [this.color, '#dbdbdb'],tooltip: {show: false,trigger: 'item',formatter: '{b} : {c} ({d}%)',},legend: {show: false,},series: [{name: '详情',type: 'pie',radius: ['75%', '90%'],hoverAnimation: false,label: {show: true,position: 'center',normal: {show: true,position: 'center',formatter: () => {const str = `${this.percent}\n${this.title}`; // 图中间内容 \n 进行换行return str;},rich: {b: {fontSize: 20,color: 'green',fontWeight: 'bold',},c: {fontSize: 13,color: 'skyblue',lineHeight: 30,},},textStyle: {fontSize: 16,fontWeight: 600,color: '#000',},},},data: [{value: actual, // 实际值},{// 如果实际值为0 则直接用目标值的进度沾满整个进度条value: actual !== 0 ? objective - actual < 0 ? 0 : objective - actual : 100, // 目标值}],silent: true,// emphasis: {//   itemStyle: {//     shadowBlur: 10,//     shadowOffsetX: 0,//     shadowColor: 'rgba(0, 0, 0, 0.5)',//   },// },},],});},forId(index) { // 主要是为了创建唯一id, 可根据业务自行调整return this.data.i + index;},}
};
</script><style scoped lang="less">
.percentloop {width: 100%;display: flex;flex-direction: column;align-items: center;justify-content: center;background: #f5f5f5;
}
</style>
这篇关于vue 实现水波进度条和环形进度条效果的文章就介绍到这儿,希望我们推荐的文章对编程师们有所帮助!


