本文主要是介绍Prometheus 通过 Telegraf 将数据远程写入 InfluxDB 2.x 存储(InfluxDB 2.x 不同于 1.x),希望对大家解决编程问题提供一定的参考价值,需要的开发者们随着小编来一起学习吧!
前言
Prometheus 的本地存储在可伸缩性和持久性方面受到单个节点的限制。Prometheus 并没有尝试从本地存储中解决这个问题,它提供了写入远程存储的方式(支持多种不同的远程存储)。
本文以写入 InfluxDB 2.x 版本为例进行说明,InfluxDB 2.x 和 InfluxDB 1.x 写入方式完全不同,主要总结为如下两点:
- InfluxDB 1.x 提供了直接写入数据的 http 接口,Prometheus 可以直接写入,但是 InfluxDB 2.x 删除了这个接口。
- InfluxDB 2.x 引入了新的组件 Telegraf,必须借助 Telegraf 才可以将 Prometheus 的数据写入到 InfluxDB 2.x 中。
InfluxDB 官网对 2.0 版本的架构进行了说明,架构图如下所示:
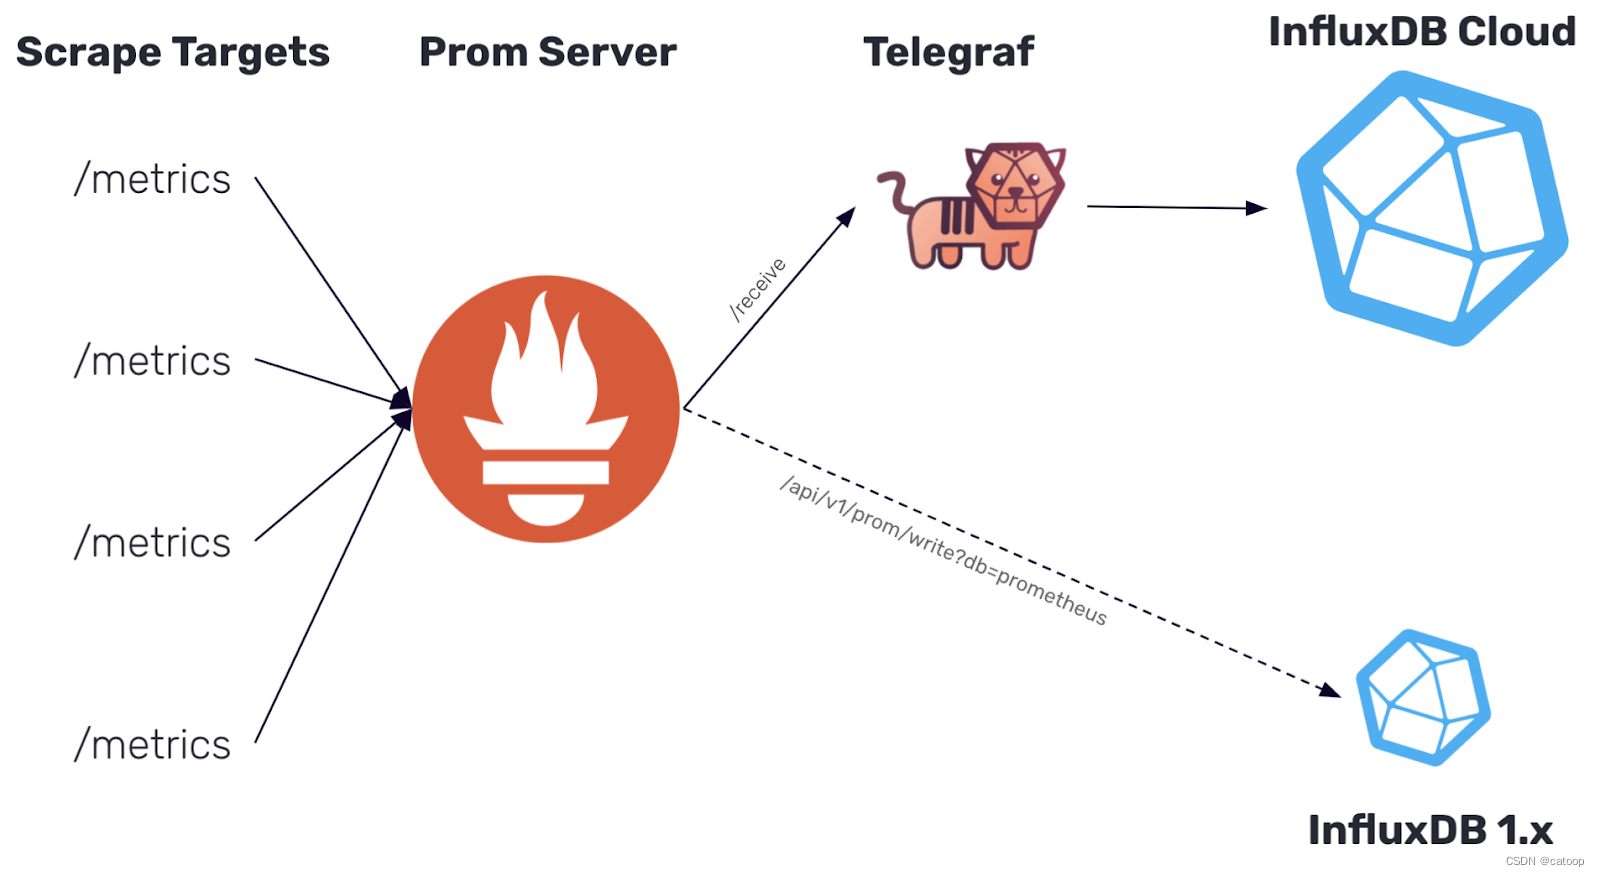
如上图所示中,如果我们把 Prometheus 拿掉,把 ScrapeTargets 和 Telegraf 连接起来。对 Telegraf 来说也是可以工作直接从源头获取指标数据的。是不是有一种要建立自己体系的节奏。
所以说,Telegraf 在一定程度上可以取代 Prometheus,这个具体还要看你的实际需求而定。毕竟 Prometheus 的能力和社区程度还是很不错的。同时 Telegraf 的 Grafana 面板较少(更准确来说是 InfluxDB 的 Grafana 面板,因为 Grafana 的数据源连接 InfluxDB 获取数据),我们可能需要花费时间去手工制作面板。
- Prometheus 通过 exportor 从各种中间件获取数据,Telegraf 已经提供了很多直接从各种常见中间件获取数据的配置(为了兼容 Prometheus 也提供了从 Prometheus 接收数据的方法),也支持自定义扩展开发。
- 一个服务器上有多个中间件,使用 Prometheus 方式读取指标数据时,需要为每个中间件运行对应的 exportor,如果使用 telegraf,只运行一个 telegraf 就可以读取大部分常用的中间件服务指标,这是一个明显的优势。
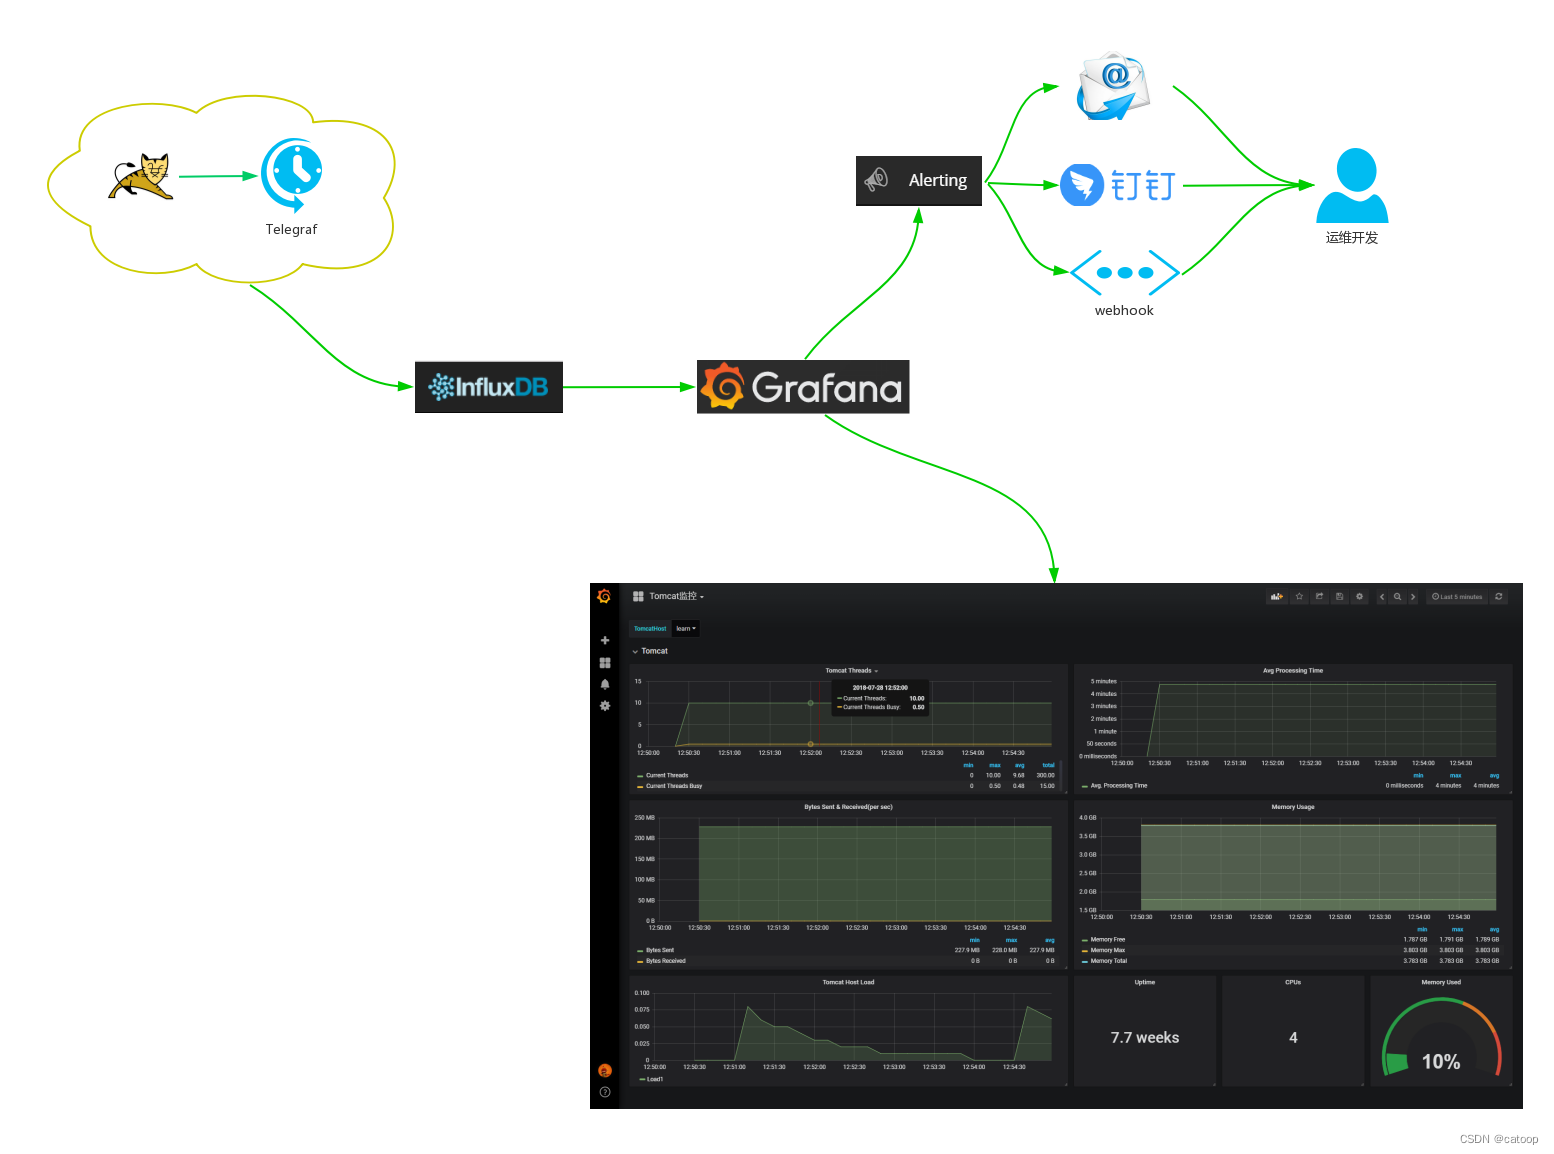
所以你在需要将数据存入 InfluxDB,并且没有必须要使用 Prometheus 特有功能的需求的情况下,如果 telegraf + grafana 能满足你的需求,可以参考使用如下所示的架构图来构建你的监控系统:
Telegraf
上面对 Telegraf 的应用场景和能力做了简单介绍,这里陈述一下 Telegraf 的主要组件和过程。
Telegraf 采用了这种编程模式,其主要有 4 个 stage,分别为 Inputs、Processors、Aggregators 和 Outputs。
- Inputs:负责采集原始监控指标,包括主动采集和被动采集。
- Processors:负责处理 Inputs 收集的数据,包括去重、重命名、格式转换等。
- Aggregators:负责聚合 Processors 处理后的数据,并对聚合后的数据计算。
- Outputs:负责接收处理 Processors 或 Aggregators 输出的数据,并导出到其他媒介,例如文件、数据库等。
且它们彼此之间也是由 channel 相互链接的,其架构图如下所示:
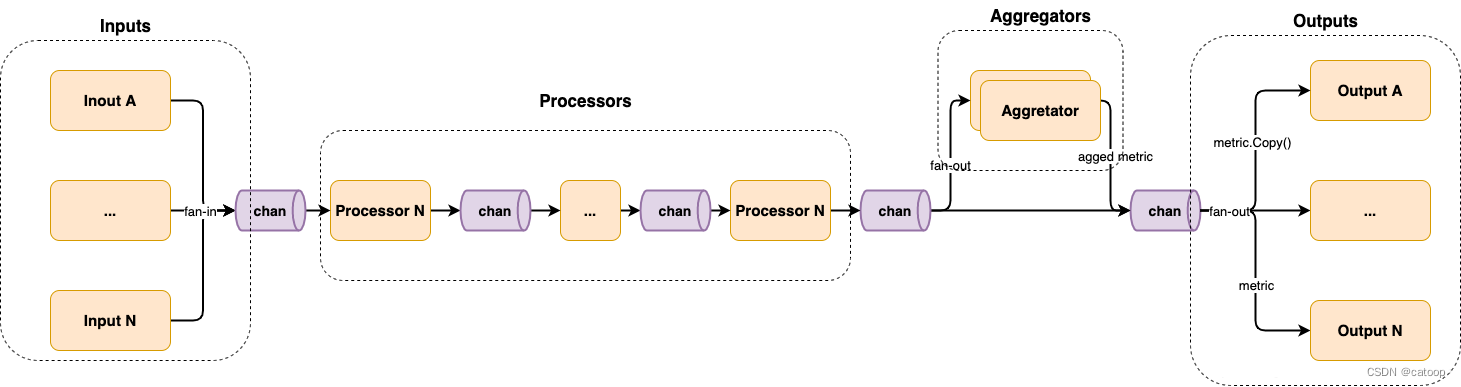
如图,其整体上采用的就是 pipeline 并发编程模式,它的运作机制如下:
- 第一个 stage 为 Inputs,每个 input 生成一个 goroutine,各自采集数据并扇入(fan-in)到 channel 中。
- 第二个 stage 为 Processors,每个 processor 生成一个 goroutine,并按顺序彼此用 channel 连接。
- 第三个 stage 为 Aggregators,每个 aggregator 生成一个 goroutine,并消费 Processors 产生的数据,并扇出(fan-out)到各个 aggregator。
- 最后一个 stage 为 Outputs,每个 output 生成一个 goroutine,并消费由 Processors 或 Aggregators 产生的数据,并扇出到各个 output。
扇入(fan-in):多个函数输出数据到一个 channel,并由某个函数读取该 channel 直到其被关闭。
扇出(fan-out):多个函数读取同一个 channel 直到其被关闭。
本文案例说明
上面做了一个简单的对比介绍,下面还是言归正传,按照我们标题的内容进行一个部署过程,案例既包含了 Prometheus 也包含了 Telegraf。
本例的 Telegraf 示例包含三种数据的读取和一种数据的输出:
- 直接读取本地指标,Telegraf 已经内置了很多读取各种中间件指标的方法配置(本例读取cpu和内存信息)
- 从 http://localhost:9090/metrics 这种输出指标的 URL 中直接读取指标(本例读取 Prometheus 服务本身的指标)
- 提供监听接口,让 prometheus 可以直接输送数据过来(在 Prometheus 中进行配置将 Prometheus 采集的数据传输到 Telegraf 中)
- 将所有数据输出到 InfluxDB 中(所有数据最终存入 InfluxDB 中)
最后在 Grafana 中添加 InfluxDB 数据源后,通过 Dashboard 面板显示指标数据。
安装部署
为了方便操作,本文使用了 Windows 安装包,这几个中间件都是单二进制文件,可以直接运行,也不存在复杂的安装部署操作。
安装 InfluxDB 2.x
1、下载地址:https://portal.influxdata.com/downloads/
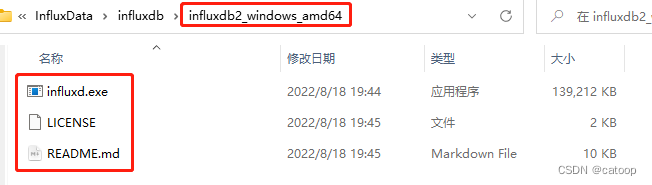
2、下载后的压缩包解压后,直接通过命令行启动服务:
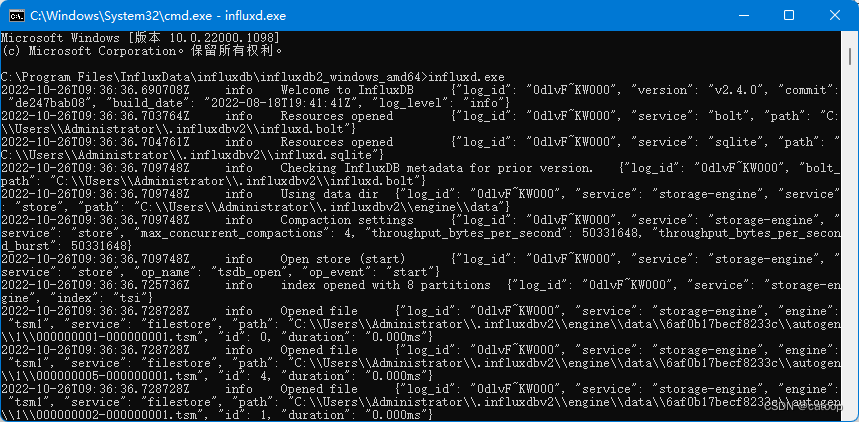
3、服务启动很快,服务启动后即可通过浏览器访问系统: http://127.0.0.1:8086
4、首次访问系统需要设置账号、密码、primary 组织、primary bucket,这里的组织名称后面要用到,例如组织名称为 shanhy。
5、补充一下 InfluxDB2 的相关名词概念
- org:组织,多租户
- bucket:类似influxdb1.x中databse的概念
- measurement:table,类似于表
- field:field key、field value,具体的值数据
- field set:值数据字段的集合
- tag:指标,标签字段,类似索引
- tag set:指标字段的集合(多个指标字段)
- telegraf:数据收集(类似prometheus exporter)
- user:用户
安装 Telegraf
1、下载地址:https://portal.influxdata.com/downloads/
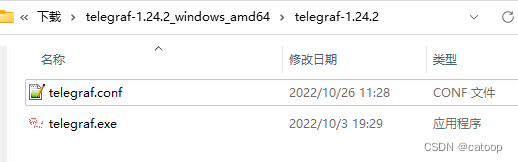
2、下载后解压压缩包:
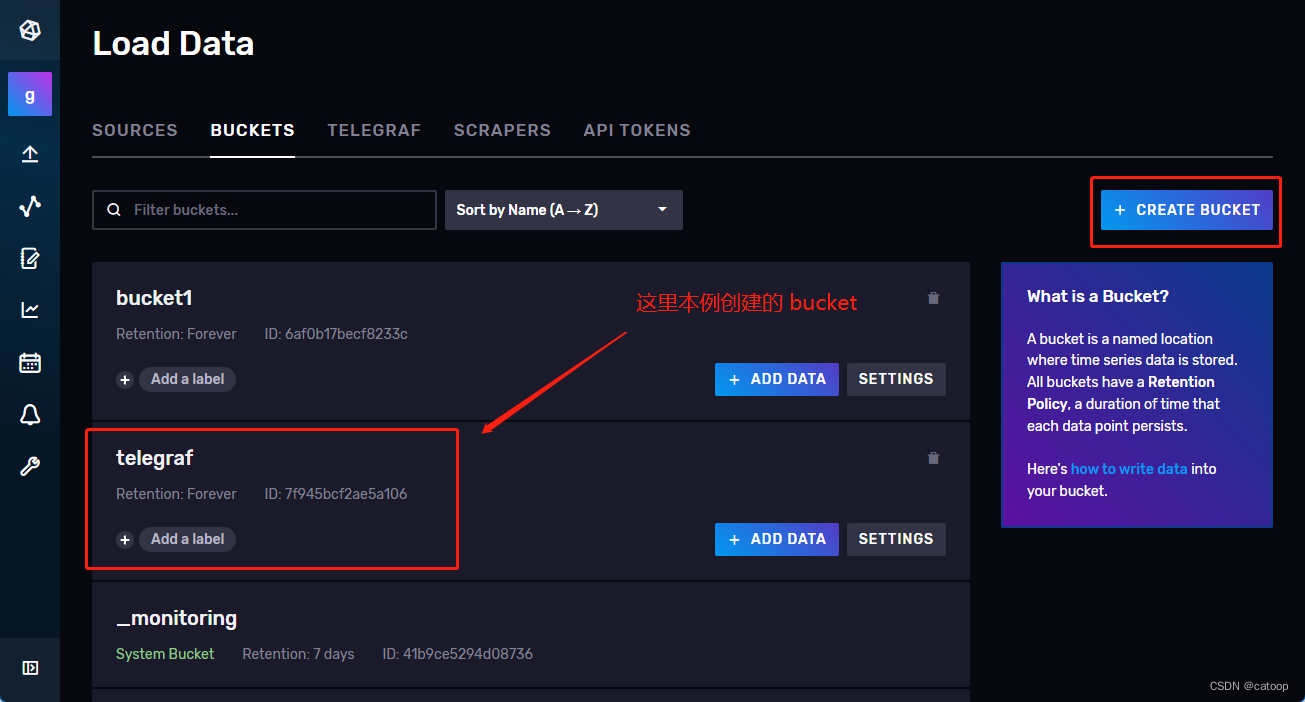
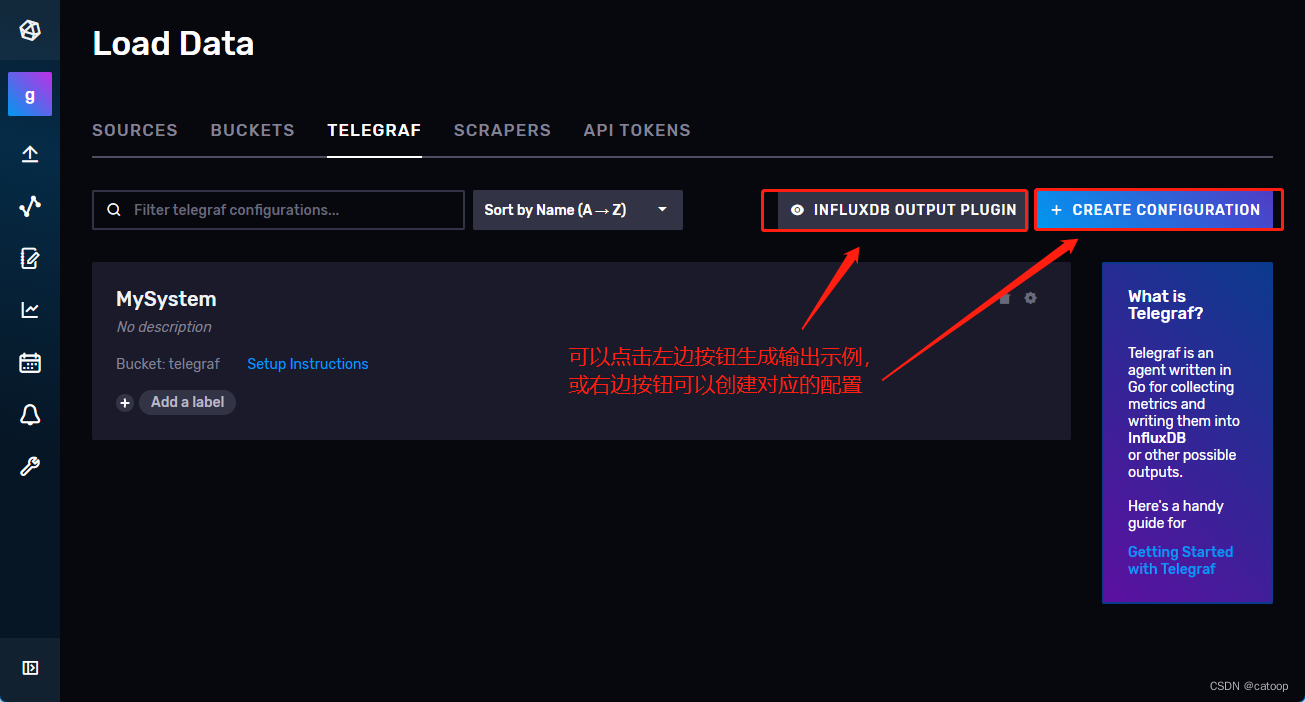
3、在 InfluxDB 中创建 Bucket,名称按需即可
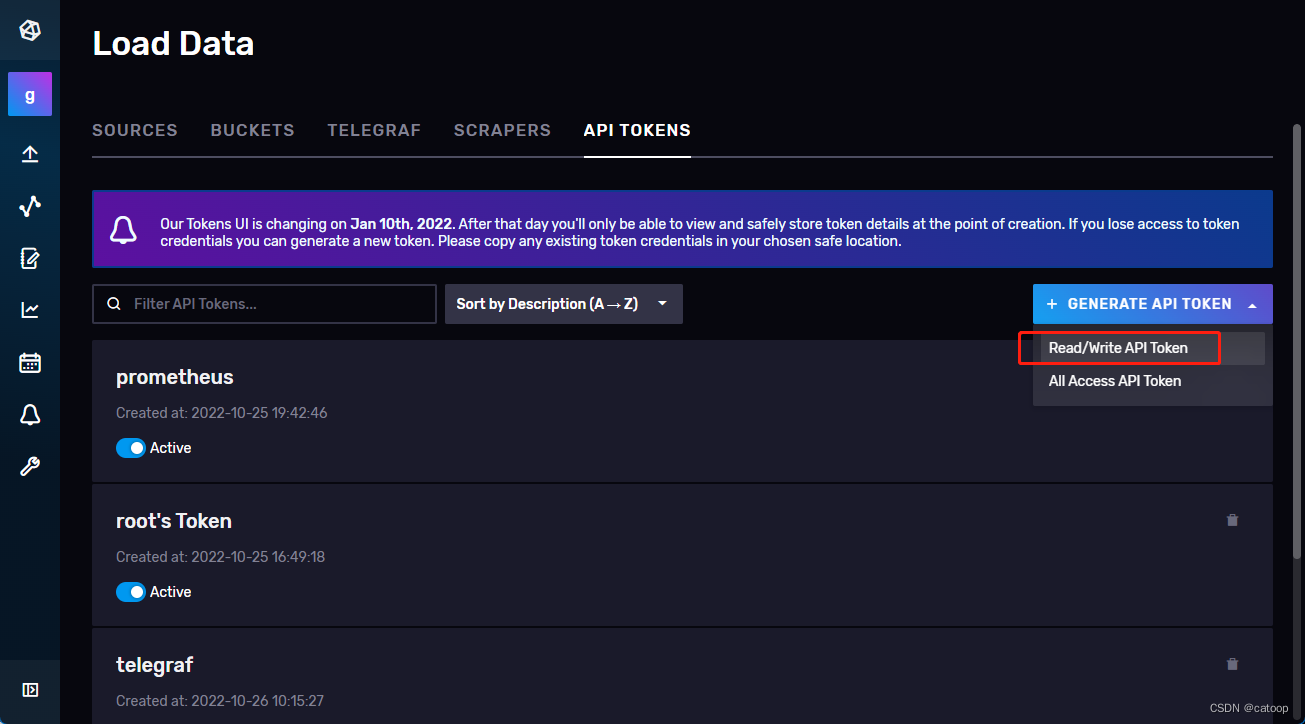
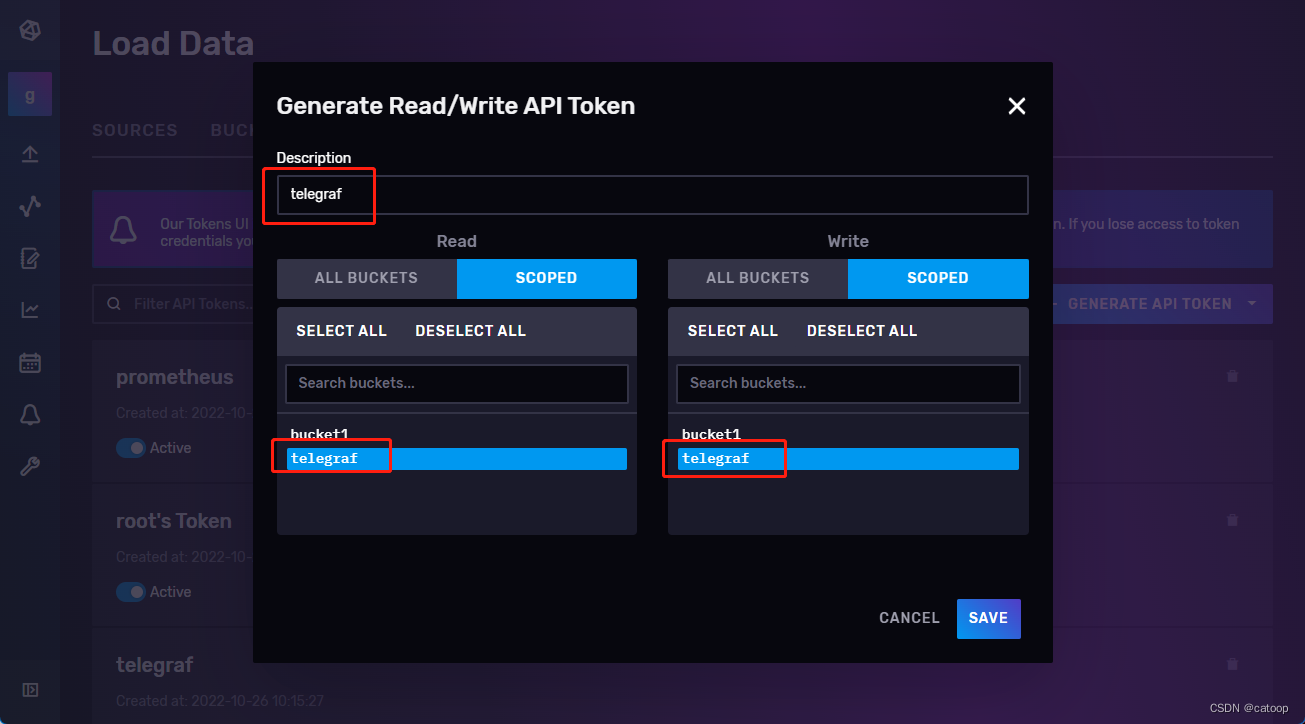
4、在 InfluxDB 中创建 Token(读写权限即可),并制定权限到对应的 bucket
5、在配置文件中配置内容
本例完整配置文件内容如下:
# Telegraf Configuration
#
# Telegraf is entirely plugin driven. All metrics are gathered from the
# declared inputs, and sent to the declared outputs.
#
# Plugins must be declared in here to be active.
# To deactivate a plugin, comment out the name and any variables.
#
# Use 'telegraf -config telegraf.conf -test' to see what metrics a config
# file would generate.
#
# Environment variables can be used anywhere in this config file, simply surround
# them with ${}. For strings the variable must be within quotes (ie, "${STR_VAR}"),
# for numbers and booleans they should be plain (ie, ${INT_VAR}, ${BOOL_VAR})# Global tags can be specified here in key="value" format.
[global_tags]# dc = "us-east-1" # will tag all metrics with dc=us-east-1# rack = "1a"## Environment variables can be used as tags, and throughout the config file# user = "$USER"# Configuration for telegraf agent
[agent]## Default data collection interval for all inputsinterval = "10s"## Rounds collection interval to 'interval'## ie, if interval="10s" then always collect on :00, :10, :20, etc.round_interval = true## Telegraf will send metrics to outputs in batches of at most## metric_batch_size metrics.## This controls the size of writes that Telegraf sends to output plugins.metric_batch_size = 1000## Maximum number of unwritten metrics per output.  Increasing this value## allows for longer periods of output downtime without dropping metrics at the## cost of higher maximum memory usage.metric_buffer_limit = 10000## Collection jitter is used to jitter the collection by a random amount.## Each plugin will sleep for a random time within jitter before collecting.## This can be used to avoid many plugins querying things like sysfs at the## same time, which can have a measurable effect on the system.collection_jitter = "0s"## Collection offset is used to shift the collection by the given amount.## This can be be used to avoid many plugins querying constraint devices## at the same time by manually scheduling them in time.# collection_offset = "0s"## Default flushing interval for all outputs. Maximum flush_interval will be## flush_interval + flush_jitterflush_interval = "10s"## Jitter the flush interval by a random amount. This is primarily to avoid## large write spikes for users running a large number of telegraf instances.## ie, a jitter of 5s and interval 10s means flushes will happen every 10-15sflush_jitter = "0s"## Collected metrics are rounded to the precision specified. Precision is## specified as an interval with an integer + unit (e.g. 0s, 10ms, 2us, 4s).## Valid time units are "ns", "us" (or "µs"), "ms", "s".#### By default or when set to "0s", precision will be set to the same## timestamp order as the collection interval, with the maximum being 1s:##   ie, when interval = "10s", precision will be "1s"##       when interval = "250ms", precision will be "1ms"#### Precision will NOT be used for service inputs. It is up to each individual## service input to set the timestamp at the appropriate precision.precision = "0s"## Log at debug level.# debug = false## Log only error level messages.# quiet = false## Log target controls the destination for logs and can be one of "file",## "stderr" or, on Windows, "eventlog".  When set to "file", the output file## is determined by the "logfile" setting.# logtarget = "file"## Name of the file to be logged to when using the "file" logtarget.  If set to## the empty string then logs are written to stderr.# logfile = ""## The logfile will be rotated after the time interval specified.  When set## to 0 no time based rotation is performed.  Logs are rotated only when## written to, if there is no log activity rotation may be delayed.# logfile_rotation_interval = "0h"## The logfile will be rotated when it becomes larger than the specified## size.  When set to 0 no size based rotation is performed.# logfile_rotation_max_size = "0MB"## Maximum number of rotated archives to keep, any older logs are deleted.## If set to -1, no archives are removed.# logfile_rotation_max_archives = 5## Pick a timezone to use when logging or type 'local' for local time.## Example: America/Chicago# log_with_timezone = ""## Override default hostname, if empty use os.Hostname()hostname = ""## If set to true, do no set the "host" tag in the telegraf agent.omit_hostname = false## Method of translating SNMP objects. Can be "netsnmp" which## translates by calling external programs snmptranslate and snmptable,## or "gosmi" which translates using the built-in gosmi library.# snmp_translator = "netsnmp"###############################################################################
#                            OUTPUT PLUGINS                                   #
################################################################################ Configuration for sending metrics to InfluxDB 2.0
# 配置将指标输出到 InfluxDB 2.0
[[outputs.influxdb_v2]]# 这里的 urls 指向 InfluxDB 的地址,可以是多个urls = ["http://127.0.0.1:8086"]# 这里的 Token 为 InfluxDB 中创建的 Token# 推荐使用环境变量的方式传入,本例为了方便直接把 token 写到配置文件中了#token = "$INFLUX_TOKEN"token = "nknqns3p1otr7HznsEaKWDpimXerxxxxxxxxxxxxxxxxxxxxxxx=="# InfluxDB 的 organization 名称organization = "goodcol"# 数据要输出到的 bucket 名称bucket = "telegraf"# 配置监听端口和path,使之可以接收数据,这里会应用到Prometheus的配置文件中
[[inputs.http_listener_v2]]## Address and port to host HTTP listener on# 监听端口service_address = ":8087"## Path to listen to.# 设置接收数据的path,对应的HTTP地址为 http://ip:8087/receivepath = "/receive"## Data format to consume. # 接收从Prometheus中出入过来的格式数据data_format = "prometheusremotewrite"# Read metrics from one or many prometheus clients
# 读取 Prometheus 这个服务自身的指标数据(跟 Prometheus 写入数据到 InfluxDB 没有关系)
[[inputs.prometheus]]## An array of urls to scrape metrics from.# 本例顺便采集一下 prometheus 这个服务的指标数据,可以观察是否能正常写入数据到 bucket 中# 该 url 为本例安装的 Prometheus 服务的指标地址,数组格式可以是多个urls = ["http://localhost:9090/metrics"]# Telegraf 提供了很多 inputs.xxxx 获取服务指标的插件可以直接使用,详见官网
# 以下配置随便获取一些本机数据
[[inputs.cpu]]percpu = truetotalcpu = truecollect_cpu_time = falsereport_active = false
[[inputs.disk]]ignore_fs = ["tmpfs", "devtmpfs", "devfs", "iso9660", "overlay", "aufs", "squashfs"]
[[inputs.diskio]]fieldpass = ["read_bytes","write_bytes","reads","writes"]
[[inputs.mem]]  fieldpass = ["available","total","available_percent","cached","buffered"]
[[inputs.net]]interfaces = ["eth*"]fieldpass = ["bytes_recv","bytes_sent"]
[[inputs.processes]]interval = "10m"fielddrop = ["wait","idle","unknown"]
[[inputs.swap]]# no configuration
[[inputs.system]]interval = "2m"fielddrop = ["uptime_format"]
配置文件中最主要的两段配置
[[outputs.influxdb_v2]]和[[inputs.http_listener_v2]]中已经做了中文注释说明,其他配置均为示例并不重要。
6、至此,即可启动 Telegraf 服务
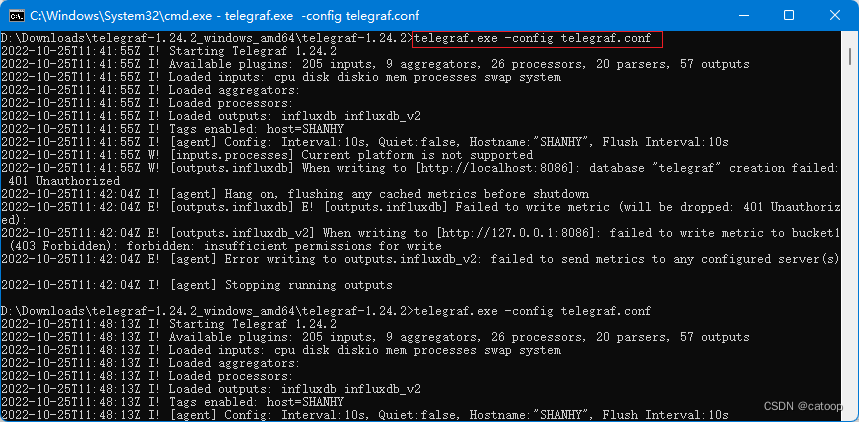
在实际应用中,会跟进实际需要收集相关服务指标的数据而在不同的服务器上分别启动多个 Telegraf 服务,这些 Telegraf 各自独立的将采集到的指标数据输出到 InfluxDB 中。
安装 Prometheus
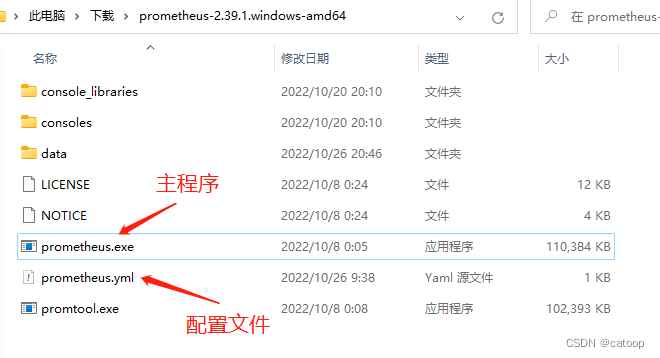
1、下载地址:https://prometheus.io/download/
2、下载后解压缩:
3、修改配置文件,为了将输入写入到 InfluxDB2 中,我们需要配置 remote_write 指向 Telegraf(因为 InfluxDB2 开始不再提供直接写入数据的接口,需要通过 Telegraf 来写入)
# my global config
global:scrape_interval: 15s # Set the scrape interval to every 15 seconds. Default is every 1 minute.evaluation_interval: 15s # Evaluate rules every 15 seconds. The default is every 1 minute.# scrape_timeout is set to the global default (10s).# Alertmanager configuration
alerting:alertmanagers:- static_configs:- targets:# - alertmanager:9093# Load rules once and periodically evaluate them according to the global 'evaluation_interval'.
rule_files:# - "first_rules.yml"# - "second_rules.yml"# A scrape configuration containing exactly one endpoint to scrape:
# Here it's Prometheus itself.
scrape_configs:# The job name is added as a label `job=<job_name>` to any timeseries scraped from this config.- job_name: "prometheus"# metrics_path defaults to '/metrics'# scheme defaults to 'http'.static_configs:- targets: ["localhost:9090"]# 配置写入到远程,写入到 Telegraf,通过 Telegraf 来写入到 InfluxDB2 中
remote_write:- url: "http://127.0.0.1:8087/receive"
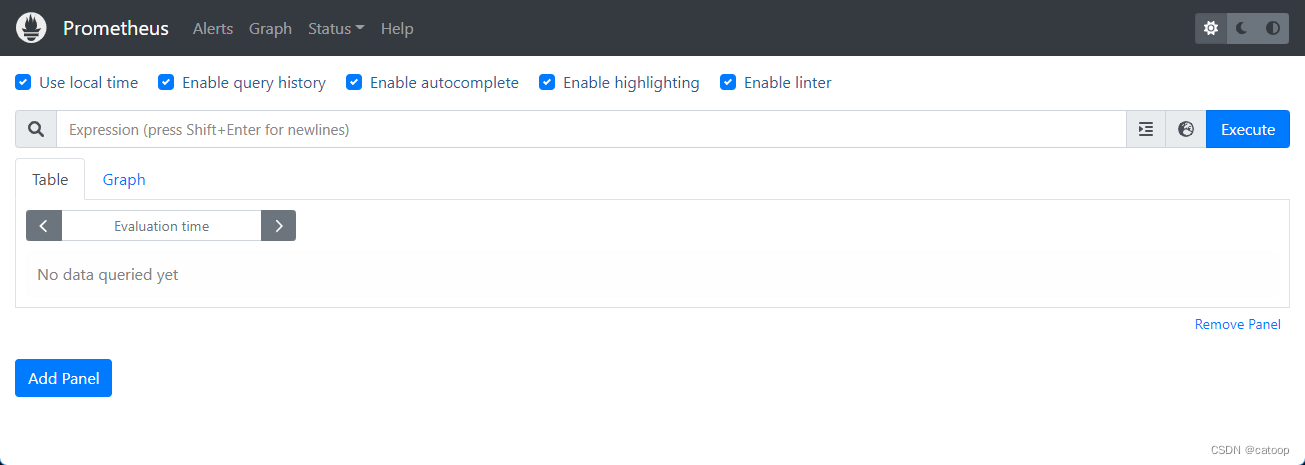
4、直接运行 Prometheus 主程序启动服务
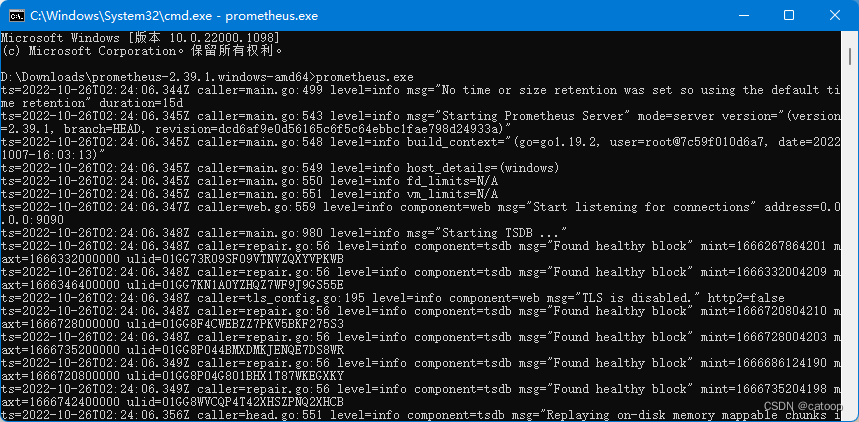
服务启动后,Prometheus 的默认访问地址为: http://localhost:9090/,启动服务时可以通过追加参数
--web.listen-address自定义端口
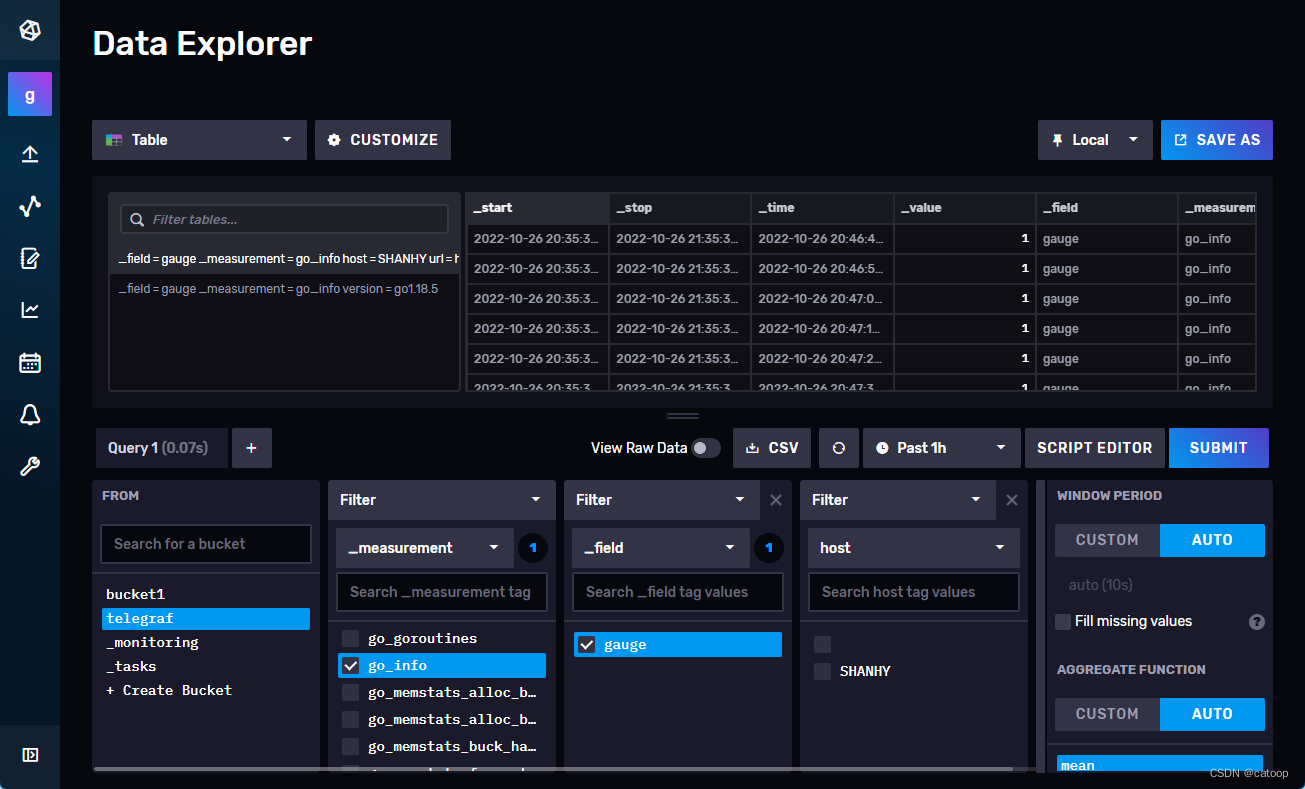
至此,Prometheus、Telegraf、InfluxDB2 均已经启动,你可以登录 InfluxDB2 的页面,在对应的 Bucket 中确认是否有数据写入,如果下图所示已经写入了很多指标数据。
安装 Grafana
Grafana 只是一个读取 InfluxDB 数据展示图表的工具,于相关数据的采集过程没有任何关联,本文省略。
下图为在 Grafana 中将 InfluxDB 添加到数据源的截图:
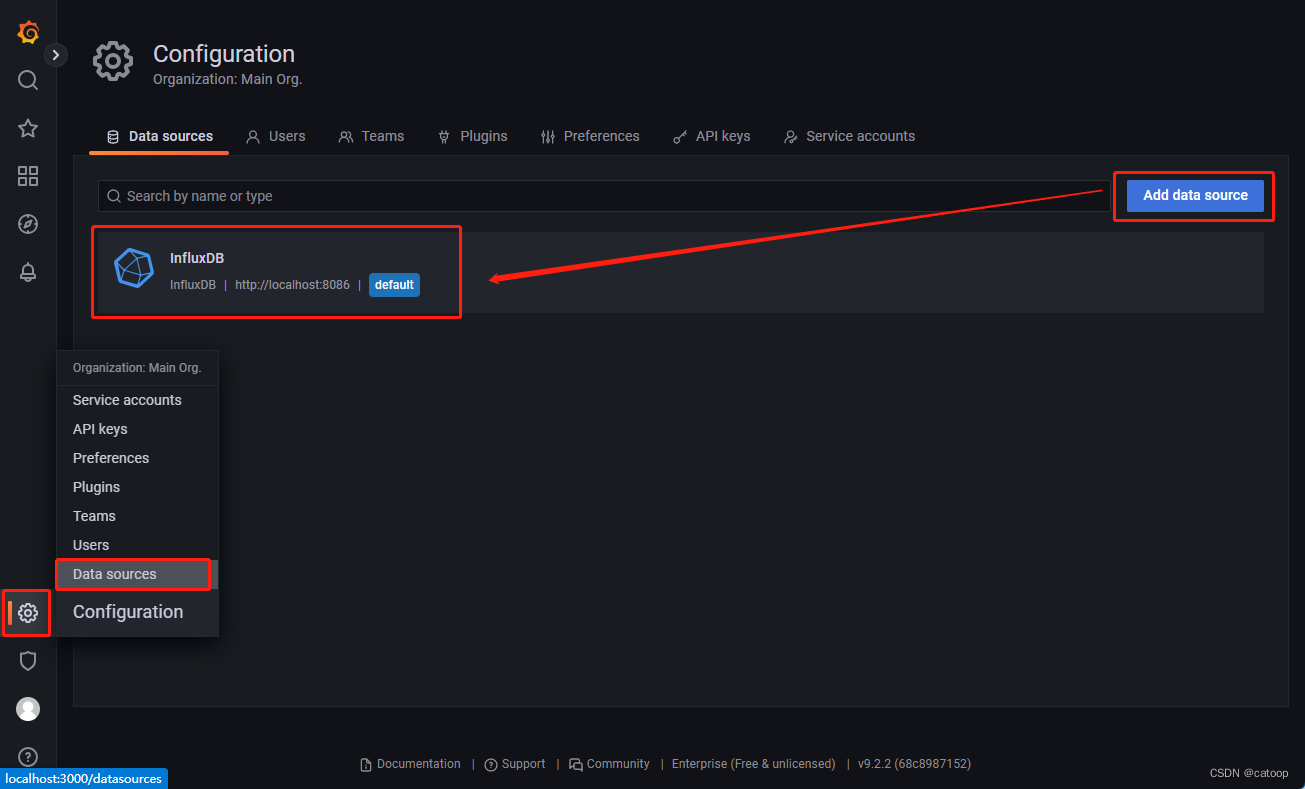
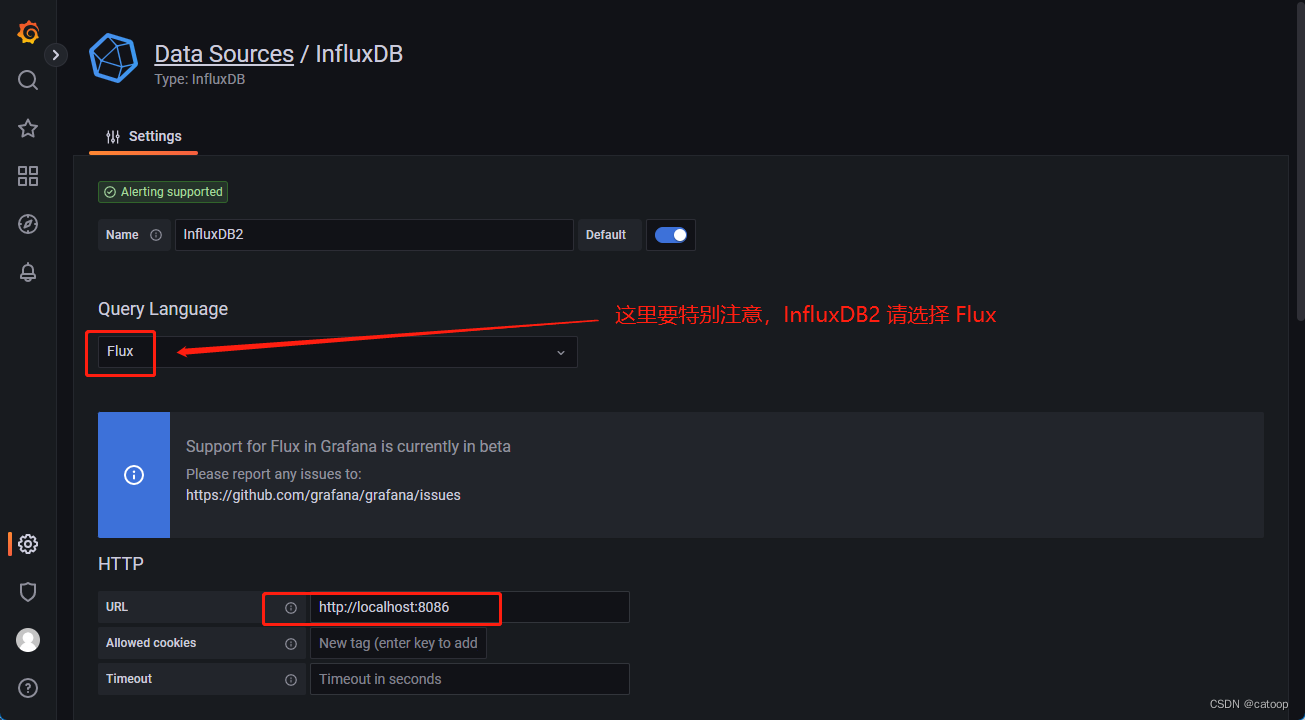
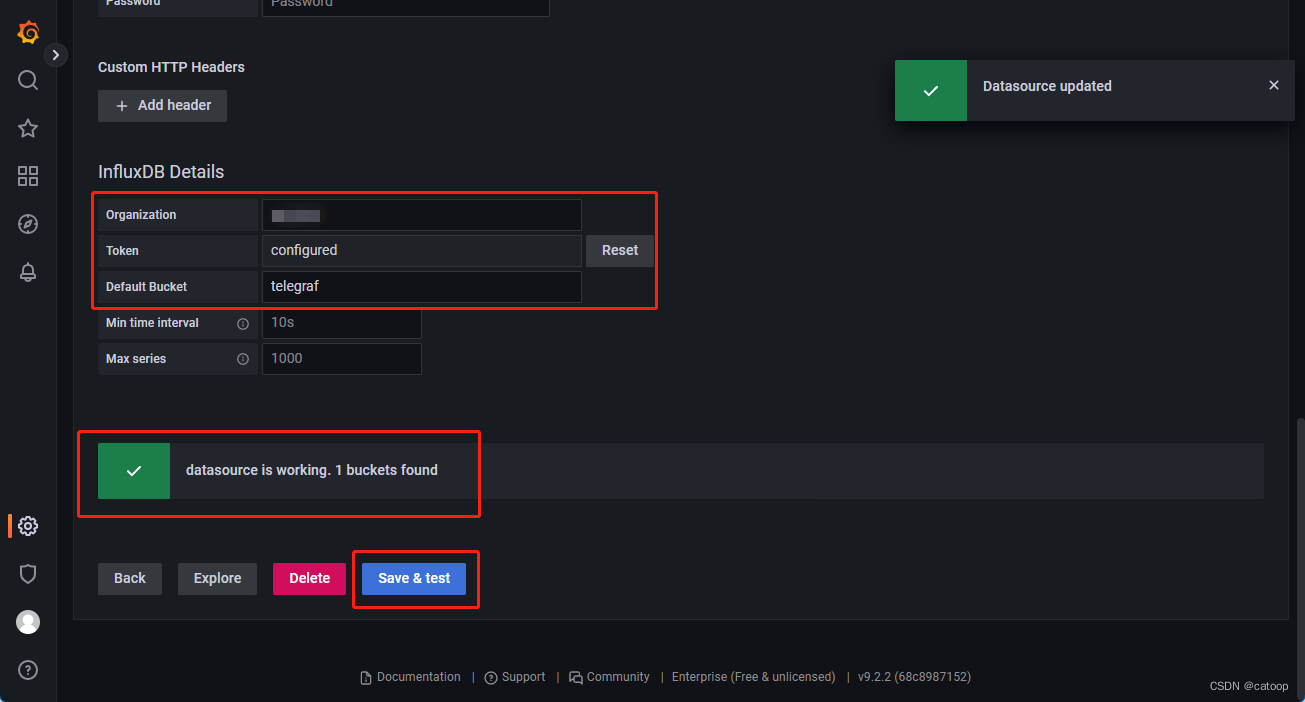
关于 Grafana 的具体使用,查阅相关资料即可。
官方文档
https://docs.influxdata.com/
https://docs.influxdata.com/telegraf
https://github.com/influxdata/telegraf
https://www.influxdata.com/blog/prometheus-remote-write-support-with-influxdb-2-0/
(END)
这篇关于Prometheus 通过 Telegraf 将数据远程写入 InfluxDB 2.x 存储(InfluxDB 2.x 不同于 1.x)的文章就介绍到这儿,希望我们推荐的文章对编程师们有所帮助!


