本文主要是介绍python笔记:pandas/geopandas DataFrame逐行遍历,希望对大家解决编程问题提供一定的参考价值,需要的开发者们随着小编来一起学习吧!
在Pandas和GeoPandas中,可以使用几种不同的方法来遍历DataFrame的每一行
0 数据
import pandas as pddata = {'column1': range(1, 1001),'column2': range(1001, 2001)
}
df = pd.DataFrame(data)
df 
1 iterrows
for index, row in df.iterrows():print(index)print(row)
'''
0
column1       1
column2    1001
Name: 0, dtype: int64
1
column1       2
column2    1002
Name: 1, dtype: int64
2
column1       3
column2    1003
Name: 2, dtype: int64
3
column1       4
column2    1004
Name: 3, dtype: int64
...
'''- 优点:简单直观,可以同时获取行索引和数据。
- 缺点:比其他方法慢,尤其是在大数据集上,因为它逐行遍历。
2 itertuples
for row in df.itertuples():print(row)print(row.Index) print(row.column1)print(row.column2)
'''
Pandas(Index=0, column1=1, column2=1001)
0
1
1001
Pandas(Index=1, column1=2, column2=1002)
1
2
1002
Pandas(Index=2, column1=3, column2=1003)
2
3
1003
...
'''- 优点:比
iterrows()快,因为它返回命名元组,遍历的是元组而不是Series对象。 - 缺点:仍然比向量化操作慢,稍微复杂一点。
3 apply
def process_row(row):print(row)df.apply(process_row, axis=1)
'''
column1       1
column2    1001
Name: 0, dtype: int64
column1       2
column2    1002
Name: 1, dtype: int64
column1       3
column2    1003
Name: 2, dtype: int64
...
'''- 优点:可以方便地应用一个函数到每一行或每一列。
- 缺点:比
itertuples()慢,而且在使用上可能比直接遍历更复杂一些。
4 applymap
def process_row(element):print(element)df.applymap(process_row)
'''
1
2
3
4
5
6
7
8
9
10
...
'''- 优点:可以方便地应用一个函数到DataFrame的每个元素。
- 缺点:可能不如其他方法高效,尤其是在大数据集上。
5 逐元素at
for i in range(len(df)):print(df.at[i,'column1'],df.at[i,'column2'])
'''
1 1001
2 1002
3 1003
4 1004
5 1005
...
'''
6 使用timeit 分别计算运行时间
python 笔记: timeit (测量代码运行时间)-CSDN博客zhiguan
import timeit
def row_at(df):for i in range(len(df)):df.at[i,'column1']df.at[i,'column2']def iter_row(df):for index,row in df.iterrows():indexrowdef iter_tuple(df):for row in df.itertuples():rowdef apply_df(df):df.apply(lambda x:x,axis=1)def apply_map_df(df):df.applymap(lambda x:x)time_at=timeit.timeit("row_at(df)", globals=globals(),number=1000)
time_iterrow=timeit.timeit('iter_row(df)',globals=globals(),number=1000)
time_itertuple=timeit.timeit('iter_tuple(df)',globals=globals(),number=1000)
time_apply=timeit.timeit('apply_df(df)',globals=globals(),number=1000)
time_applymap=timeit.timeit('apply_map_df(df)',globals=globals(),number=1000)time_at,time_iterrow,time_itertuple,time_apply,time_applymap
'''
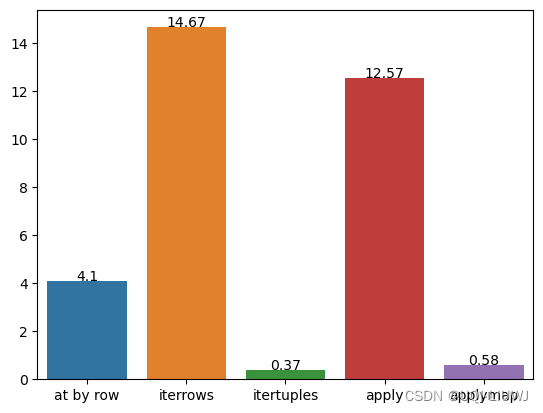
(4.100567077999585,14.672198772001138,0.37428459300281247,12.572721185002592,0.5845120449957903)
'''
直观可视化
import seaborn as sns
import matplotlib.pyplot as pltx = ['at by row','iterrows','itertuples','apply','applymap']
y = [time_at,time_iterrow,time_itertuple,time_apply,time_applymap]  # 请将这些值替换为你实际的时间数据sns.barplot(x=x, y=y)
# 创建 barplotfor i, val in enumerate(y):plt.text(i, val + 0.01, round(val, 2), ha='center')
# 添加标签(x轴、y轴、text的label)# 显示图形
plt.show()

这篇关于python笔记:pandas/geopandas DataFrame逐行遍历的文章就介绍到这儿,希望我们推荐的文章对编程师们有所帮助!


