本文主要是介绍交互式数据可视化工具Boken介绍,希望对大家解决编程问题提供一定的参考价值,需要的开发者们随着小编来一起学习吧!
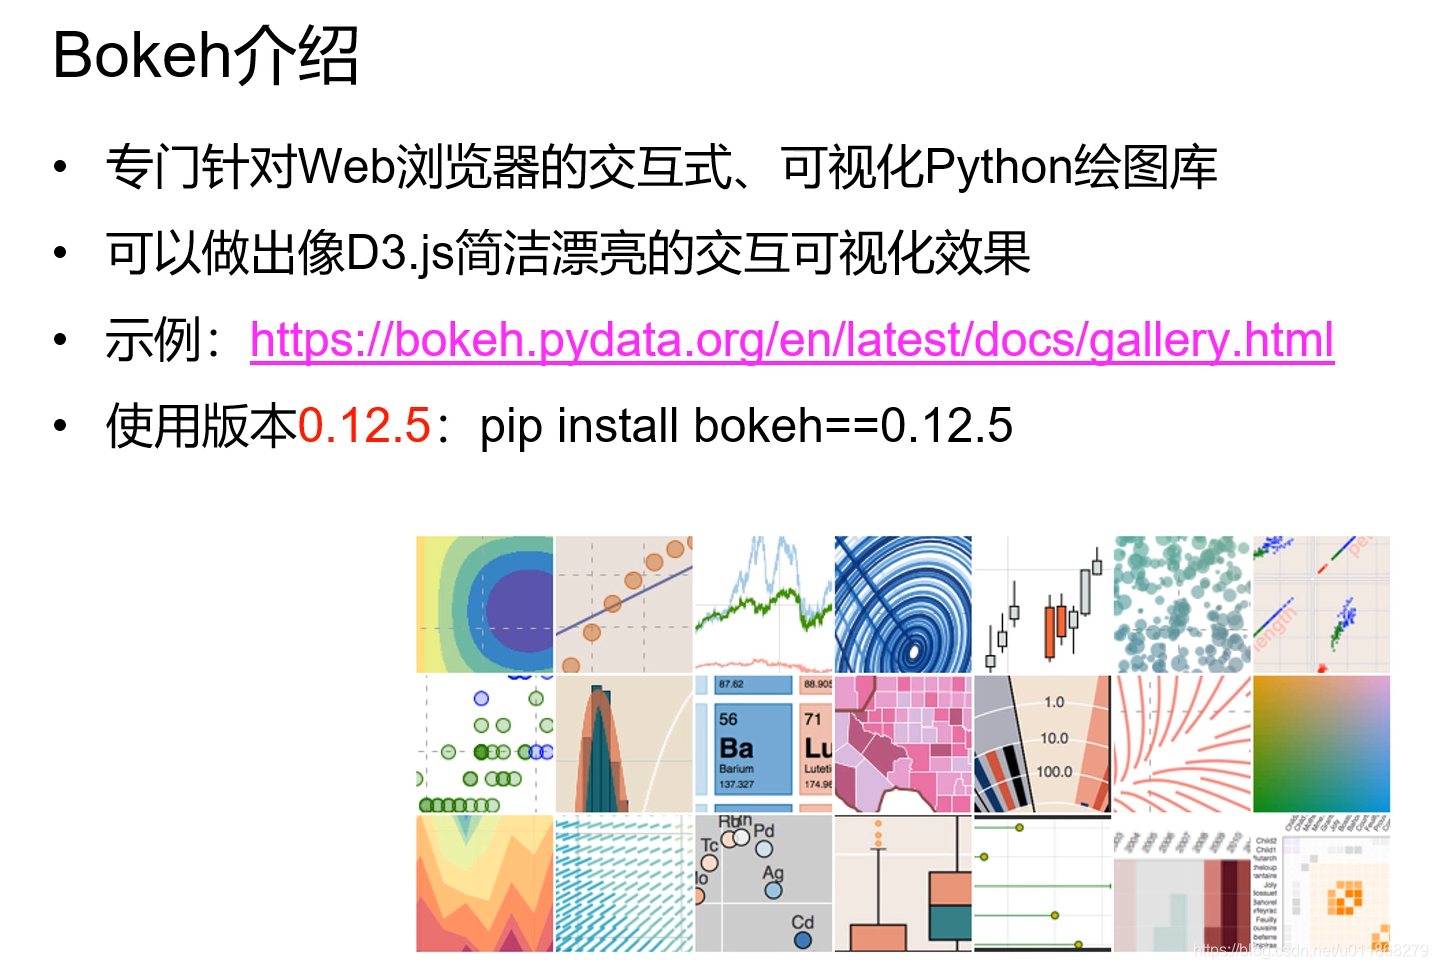


可视化工具
In [1]:
import bokeh
# 检查版本是否为0.12.5
bokeh.__version__
Out[1]:
'0.12.5'
In [2]:
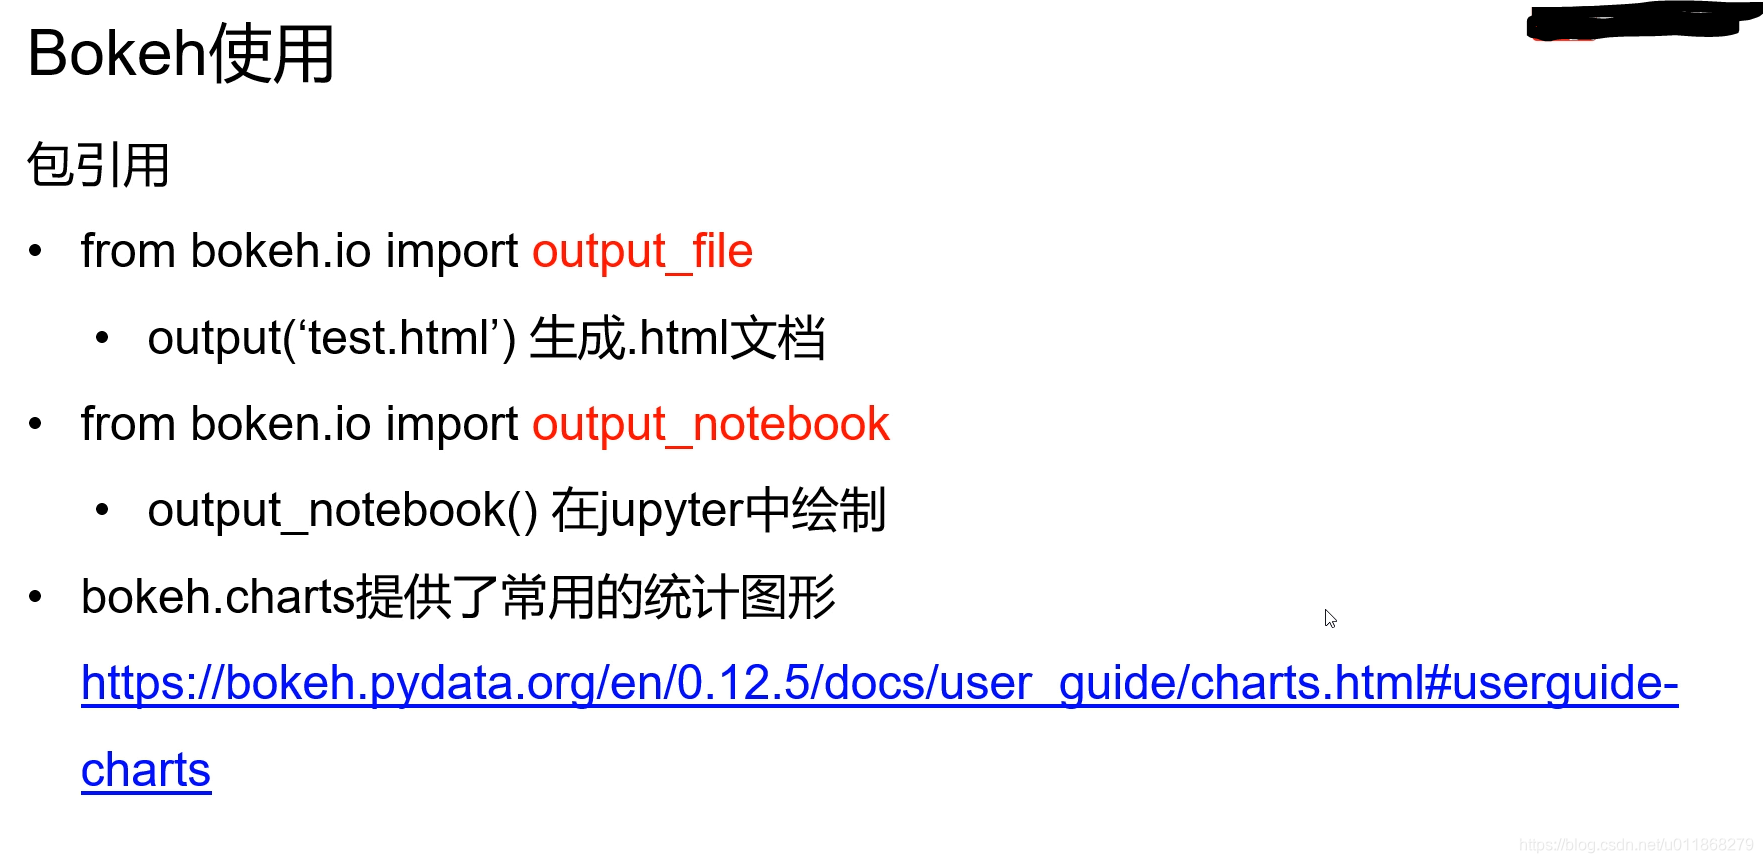
from bokeh.io import output_notebook,output_file,show
from bokeh.charts import Scatter,Bar,BoxPlot,Chord
import seaborn as sns
In [3]:
# 导入数据
exe_data = sns.load_dataset('exercise')
exe_data.head()
Out[3]:
| Unnamed: 0 | id | diet | pulse | time | kind | |
|---|---|---|---|---|---|---|
| 0 | 0 | 1 | low fat | 85 | 1 min | rest |
| 1 | 1 | 1 | low fat | 85 | 15 min | rest |
| 2 | 2 | 1 | low fat | 88 | 30 min | rest |
| 3 | 3 | 2 | low fat | 90 | 1 min | rest |
| 4 | 4 | 2 | low fat | 92 | 15 min | rest |
In [4]:
output_notebook()
#output_file('test.html')
BokehJS 0.12.5 successfully loaded.
In [6]:
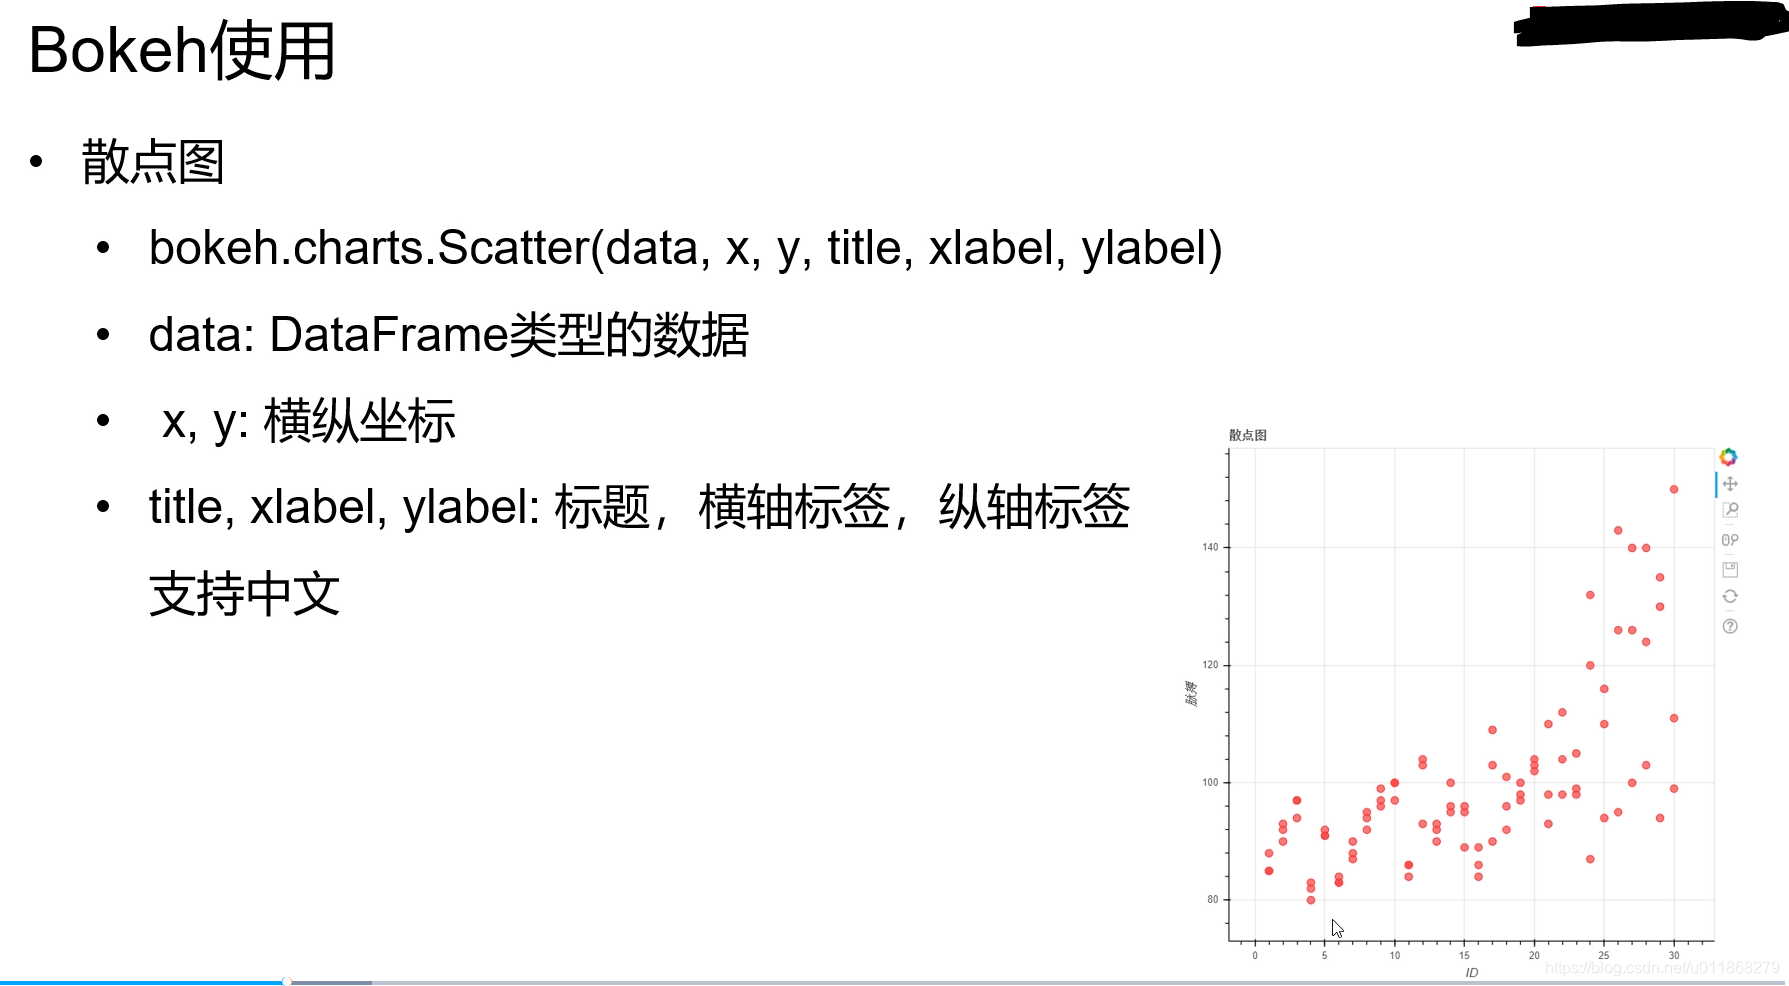
p = Scatter(data=exe_data, x='id',y='pulse',title='散点图',xlabel='ID',ylabel='脉搏')
show(p)
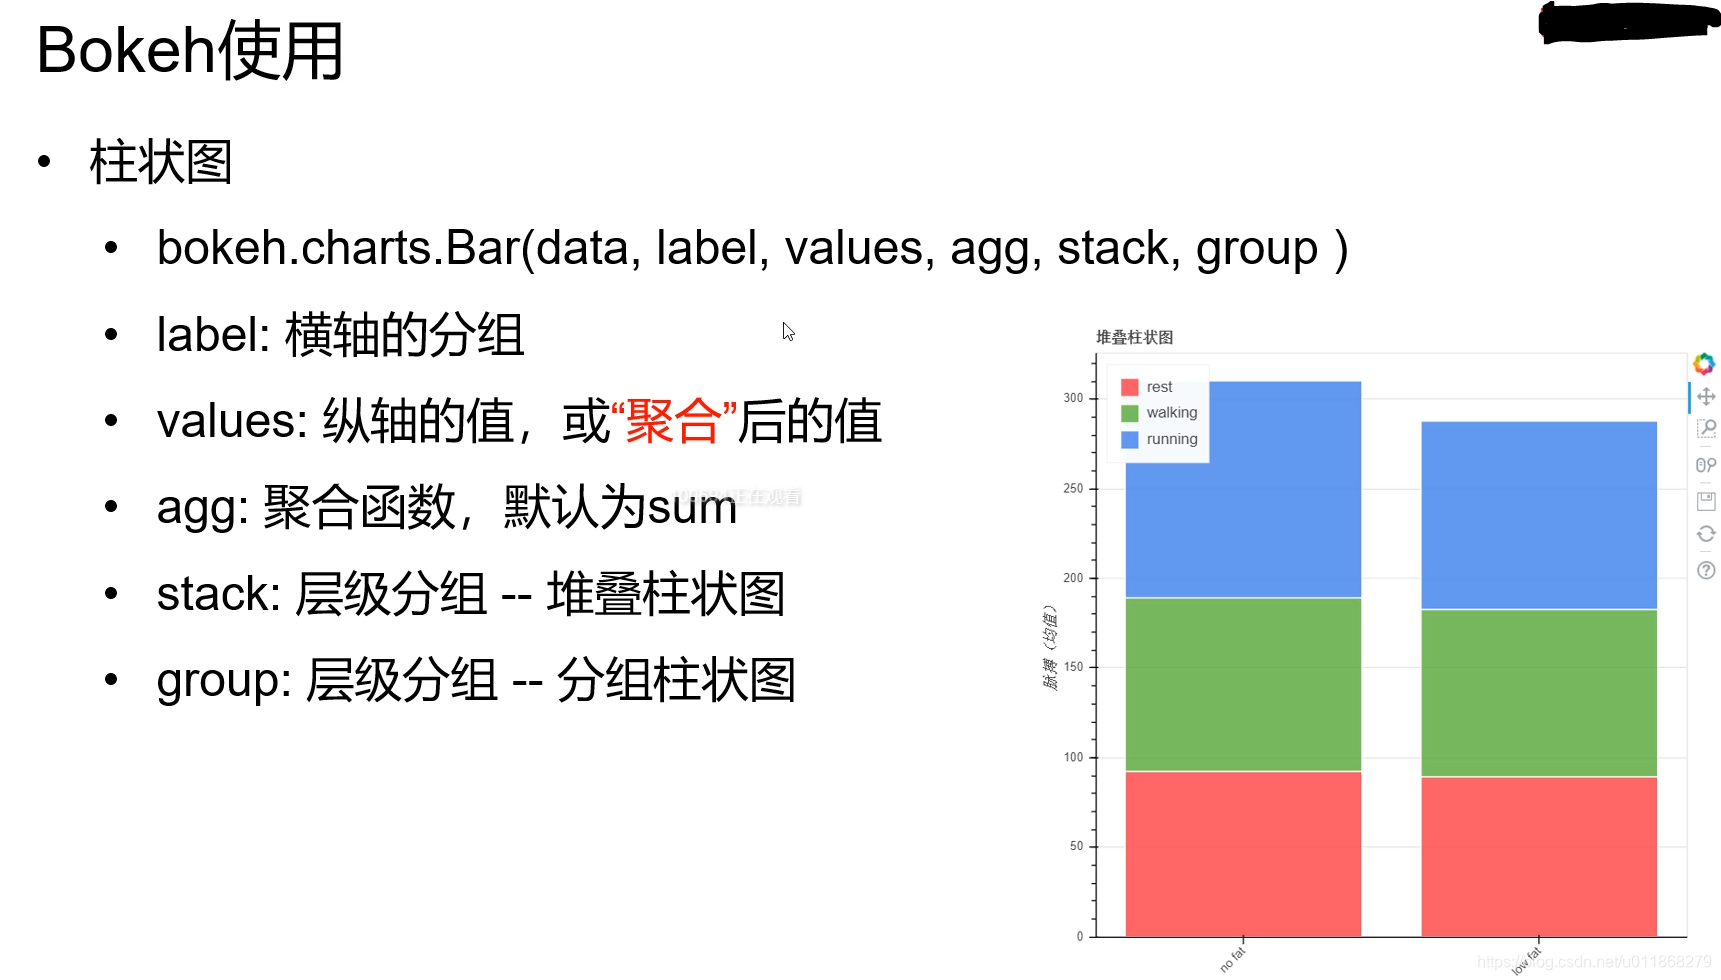
柱状图
In [7]:
p = Bar(data=exe_data, label='id',values='pulse',title='柱状图')
show(p)
In [8]:
p = Bar(data=exe_data, label='diet',values='pulse',title='柱状图')
show(p)
In [10]:
p = Bar(data=exe_data,values='pulse', label='diet',stack='kind', title='堆叠柱状图', agg='mean',xlabel='饮食',ylabel='脉搏(均值)')
show(p)
In [11]:
p = Bar(data=exe_data,values='pulse', label='diet',group='kind', title='分组柱状图', agg='mean',xlabel='饮食',ylabel='脉搏均值)')
show(p)
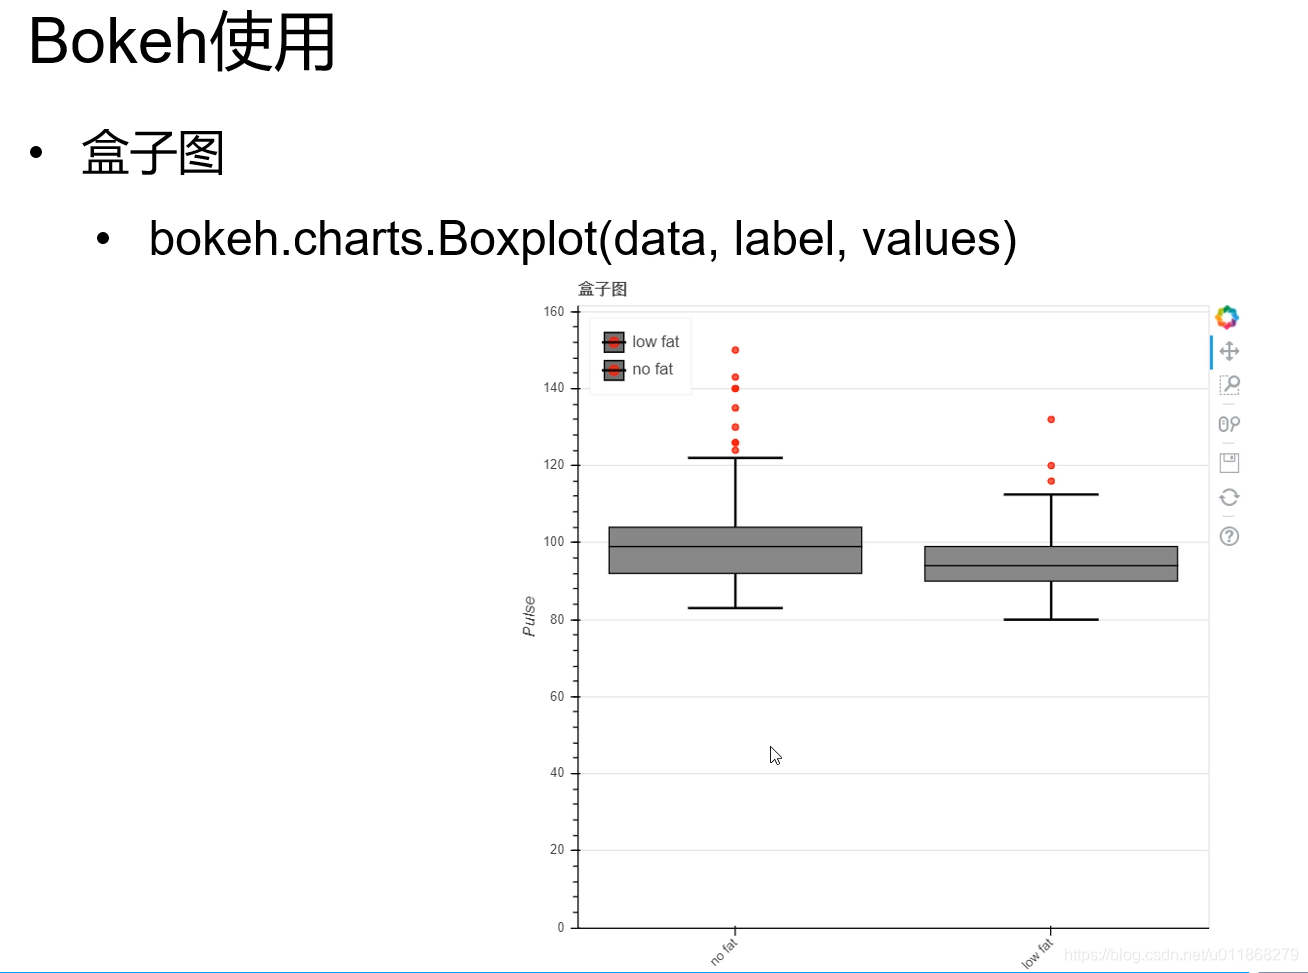
盒子图
In [12]:
# 盒子图
box = BoxPlot(data=exe_data,values='pulse',label='diet',title='盒子图')
show(box)
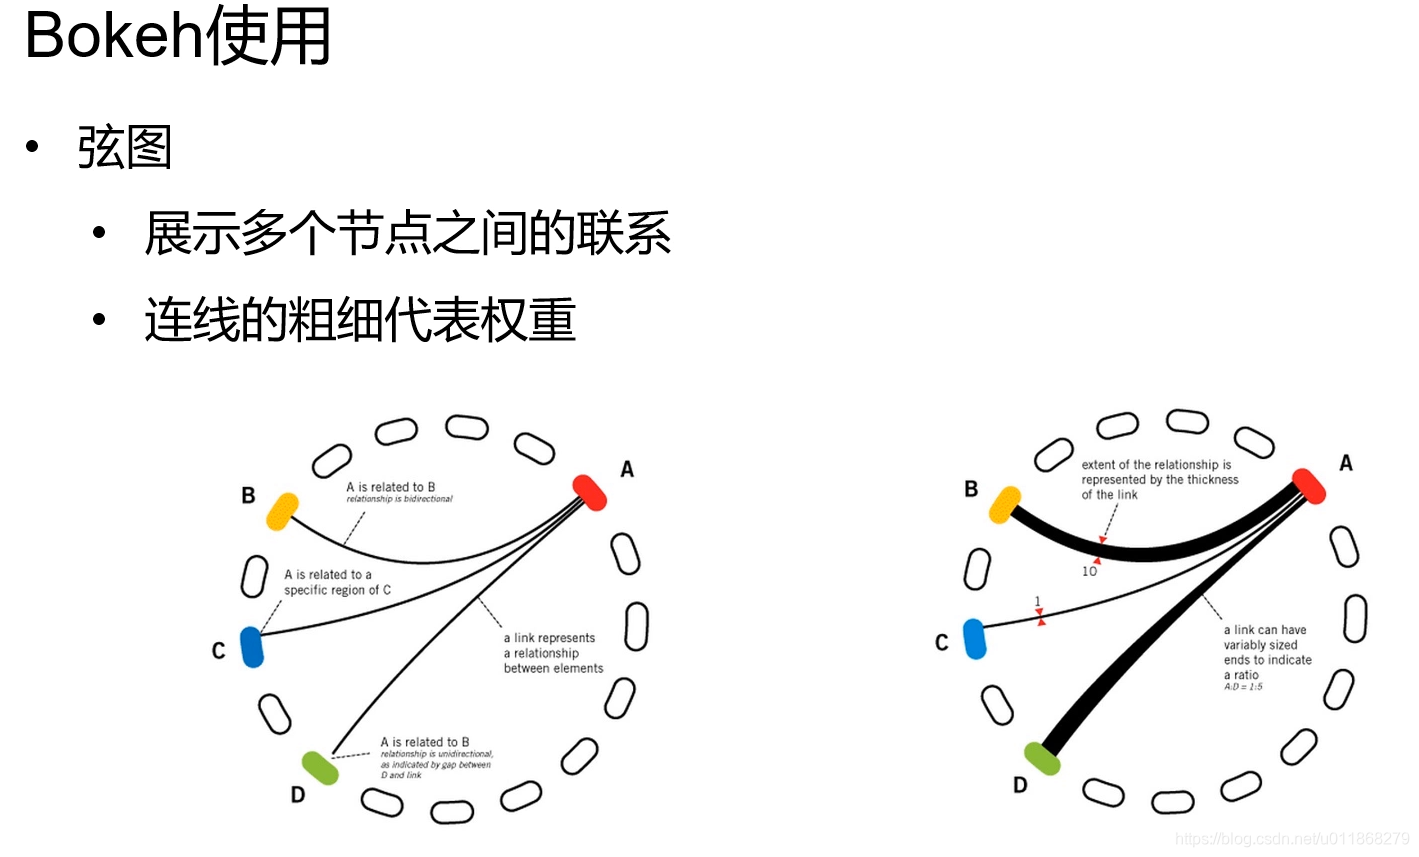
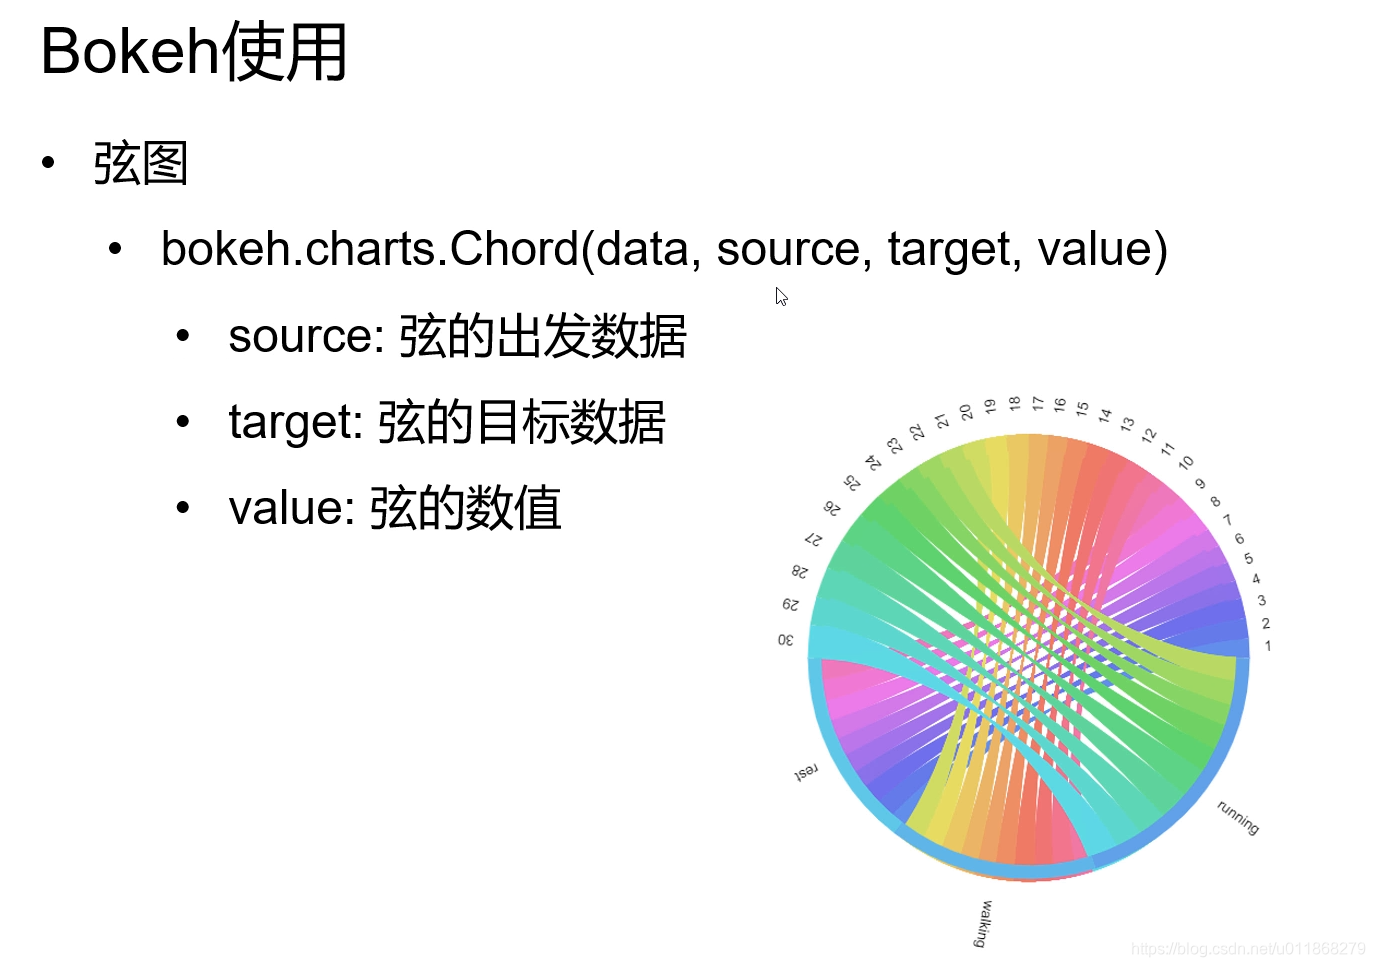
弦线Chord
In [16]:
chord = Chord(data=exe_data, source='id', target='kind', value='pulse')
show(chord)
---------------------------------------------------------------------------
AttributeError                            Traceback (most recent call last)
<ipython-input-16-c32cc5b7881b> in <module>
----> 1 chord = Chord(data=exe_data, source='id', target='kind', value='pulse')2 show(chord)C:\software\ANACONDA\Anaconda3\lib\site-packages\bokeh\charts\builders\chord_builder.py in Chord(data, source, target, value, square_matrix, label, xgrid, ygrid, **kw)304     kw['ygrid'] = ygrid305
--> 306     chart = create_and_build(ChordBuilder, data, **kw)307 308     chart.left[0].visible = FalseC:\software\ANACONDA\Anaconda3\lib\site-packages\bokeh\charts\builder.py in create_and_build(builder_class, *data, **kws)54     chart_kws = {k: v for k, v in kws.items() if k not in builder_props}55     chart = Chart(**chart_kws)
---> 56     chart.add_builder(builder)57     chart.start_plot()58 C:\software\ANACONDA\Anaconda3\lib\site-packages\bokeh\charts\chart.py in add_builder(self, builder)151     def add_builder(self, builder):152         self._builders.append(builder)
--> 153         builder.create(self)154 155     def add_ranges(self, dim, range):C:\software\ANACONDA\Anaconda3\lib\site-packages\bokeh\charts\builder.py in create(self, chart)503         """504         # call methods that allow customized setup by subclasses
--> 505         self.setup()506         self.process_data()507 C:\software\ANACONDA\Anaconda3\lib\site-packages\bokeh\charts\builders\chord_builder.py in setup(self)118                     for _, row in self.values._data.iterrows():119                         m[row[self.origin]][row[self.destination]] = row[self.value]
--> 120                     self.matrix = m.get_values().T121         else:122             # It's already a square matrixC:\software\ANACONDA\Anaconda3\lib\site-packages\pandas\core\generic.py in __getattr__(self, name)5137             if self._info_axis._can_hold_identifiers_and_holds_name(name):5138                 return self[name]
-> 5139             return object.__getattribute__(self, name)5140 5141     def __setattr__(self, name: str, value) -> None:AttributeError: 'DataFrame' object has no attribute 'get_values'
Bokeh 绘制常用图形元素
In [17]:
from bokeh.plotting import figure
from bokeh.io import output_notebook,output_file,show
import numpy as np
In [18]:
output_notebook()
BokehJS 0.12.5 successfully loaded.
In [21]:
p = figure(plot_width=400,plot_height=400)
#圆形
p.circle(np.random.randint(1,10,5),np.random.randint(1,10,5),size=10,color='green')
# 方形
p.square(np.random.randint(1,10,5),np.random.randint(1,10,5),size=10,color='navy')
# 折形
p.line(np.random.randint(1,10,5),np.random.randint(1,10,5),size=10,color='red')
show(p)
---------------------------------------------------------------------------
AttributeError                            Traceback (most recent call last)
<ipython-input-21-e16157b7fbfd> in <module>9 10 # 折形
---> 11 p.line(np.random.randint(1,10,5),np.random.randint(1,10,5),size=10,color='red')12 13 show(p)fakesource in line(self, x, y, **kwargs)C:\software\ANACONDA\Anaconda3\lib\site-packages\bokeh\plotting\helpers.py in func(self, **kwargs)559             mglyph_ca = None560
--> 561         glyph = _make_glyph(glyphclass, kwargs, glyph_ca)562         nsglyph = _make_glyph(glyphclass, kwargs, nsglyph_ca)563         sglyph = _make_glyph(glyphclass, kwargs, sglyph_ca)C:\software\ANACONDA\Anaconda3\lib\site-packages\bokeh\plotting\helpers.py in _make_glyph(glyphclass, kws, extra)152     kws = kws.copy()153     kws.update(extra)
--> 154     return glyphclass(**kws)155 156 C:\software\ANACONDA\Anaconda3\lib\site-packages\bokeh\model.py in __init__(self, **kwargs)224         self._id = kwargs.pop("id", make_id())225         self._document = None
--> 226         super(Model, self).__init__(**kwargs)227         default_theme.apply_to_model(self)228 C:\software\ANACONDA\Anaconda3\lib\site-packages\bokeh\core\has_props.py in __init__(self, **properties)239 240         for name, value in properties.items():
--> 241             setattr(self, name, value)242 243     def __setattr__(self, name, value):C:\software\ANACONDA\Anaconda3\lib\site-packages\bokeh\core\has_props.py in __setattr__(self, name, value)274                 matches, text = props, "possible"275
--> 276             raise AttributeError("unexpected attribute '%s' to %s, %s attributes are %s" %277                 (name, self.__class__.__name__, text, nice_join(matches)))278 AttributeError: unexpected attribute 'size' to Line, possible attributes are js_event_callbacks, js_property_callbacks, line_alpha, line_cap, line_color, line_dash, line_dash_offset, line_join, line_width, name, subscribed_events, tags, x or y
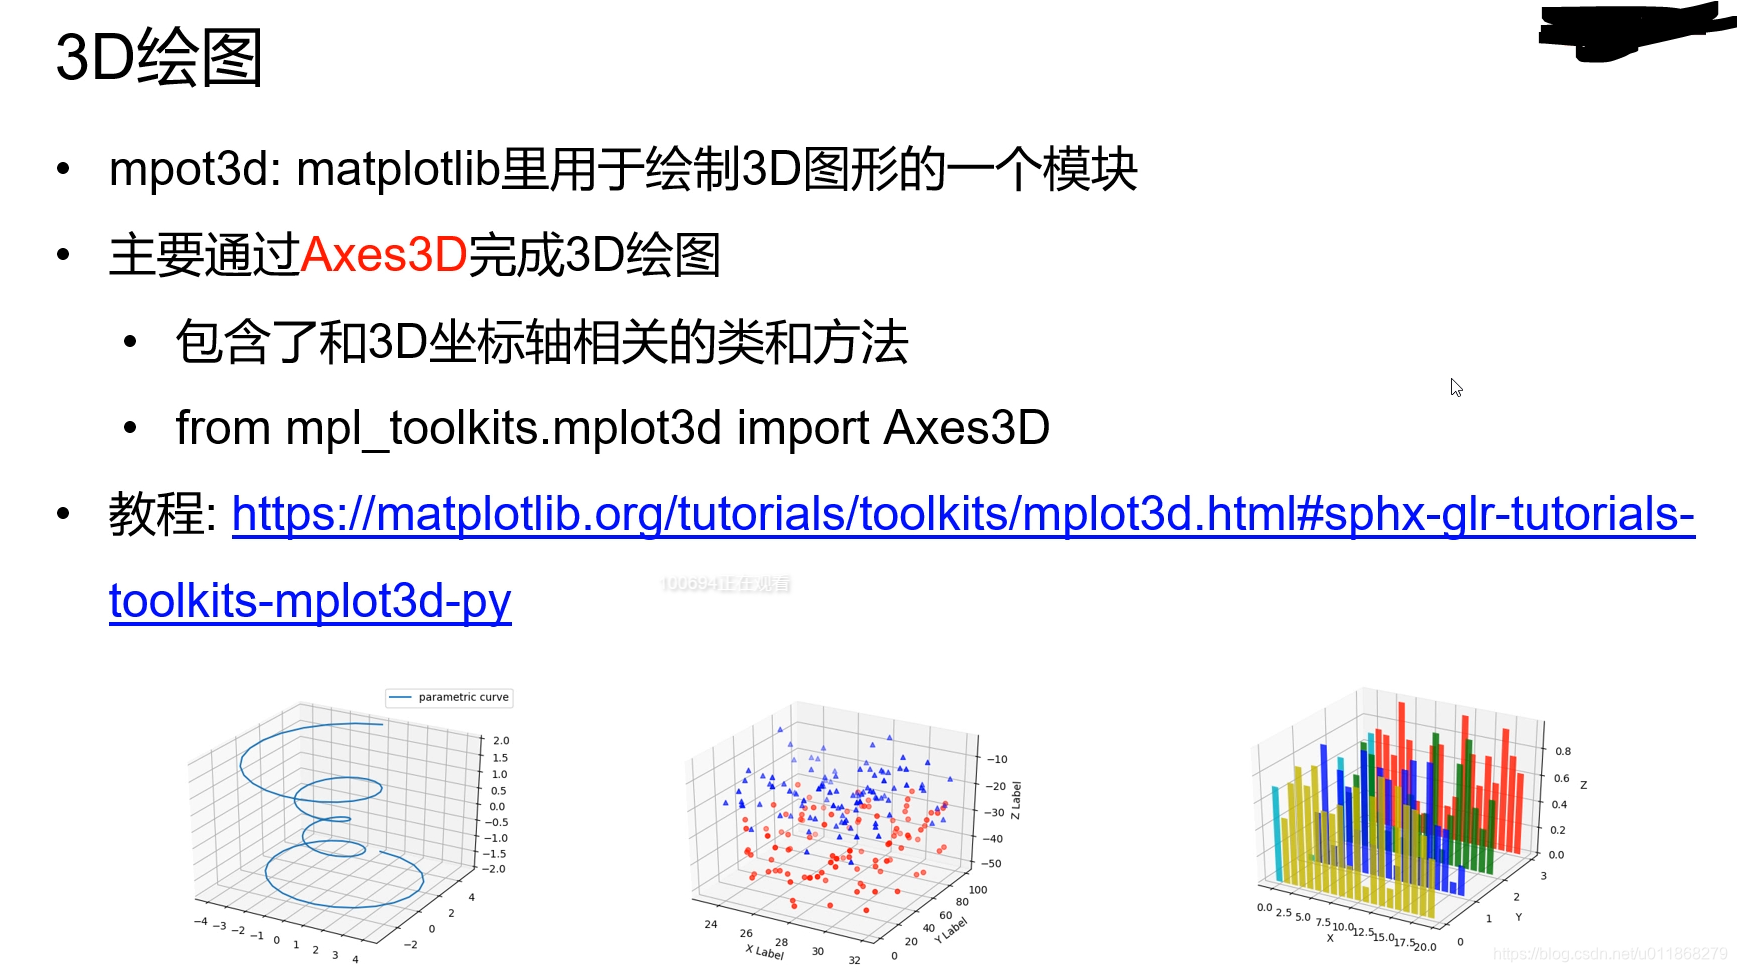
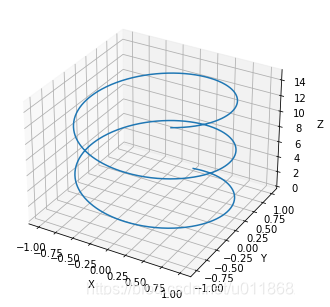
3D绘图--mplot3d
3D曲线可视化
In [22]:
import numpy as np
from mpl_toolkits.mplot3d import Axes3D
import matplotlib.pyplot as plt
In [23]:
# 准备数据
zline = np.linspace(0,15,1000)
xline = np.sin(zline)
yline = np.cos(zline)
In [24]:
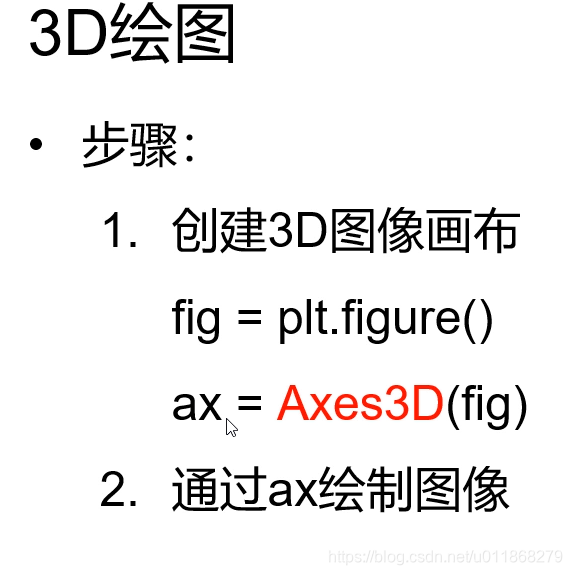
# 创建3D图像对象
fig = plt.figure()
ax = Axes3D(fig)
# 绘制图像
ax.plot(xline, yline, zline)
ax.set_xlabel('X')
ax.set_ylabel('Y')
ax.set_zlabel('Z')
plt.show()
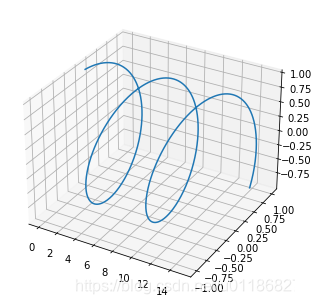
In [25]:
# 创建3D图像对象
fig = plt.figure()
ax = Axes3D(fig)
# 绘制图像,以X轴为竖轴
ax.plot(xline,yline,zline,zdir='x')
plt.show()
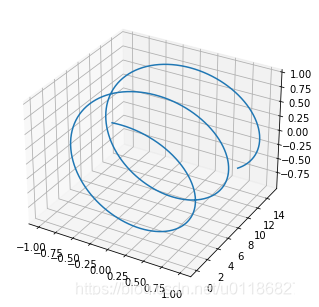
In [26]:
# 创建3D图像对象
fig = plt.figure()
ax = Axes3D(fig)
# 绘制图像,以X轴为竖轴
ax.plot(xline,yline,zline,zdir='y')
plt.show()
In [27]:
# 创建3D图像对象
fig = plt.figure()
ax = Axes3D(fig)
# 绘制图像,以X轴为竖轴
ax.plot(xline,yline,zline,zdir='z')
plt.show()

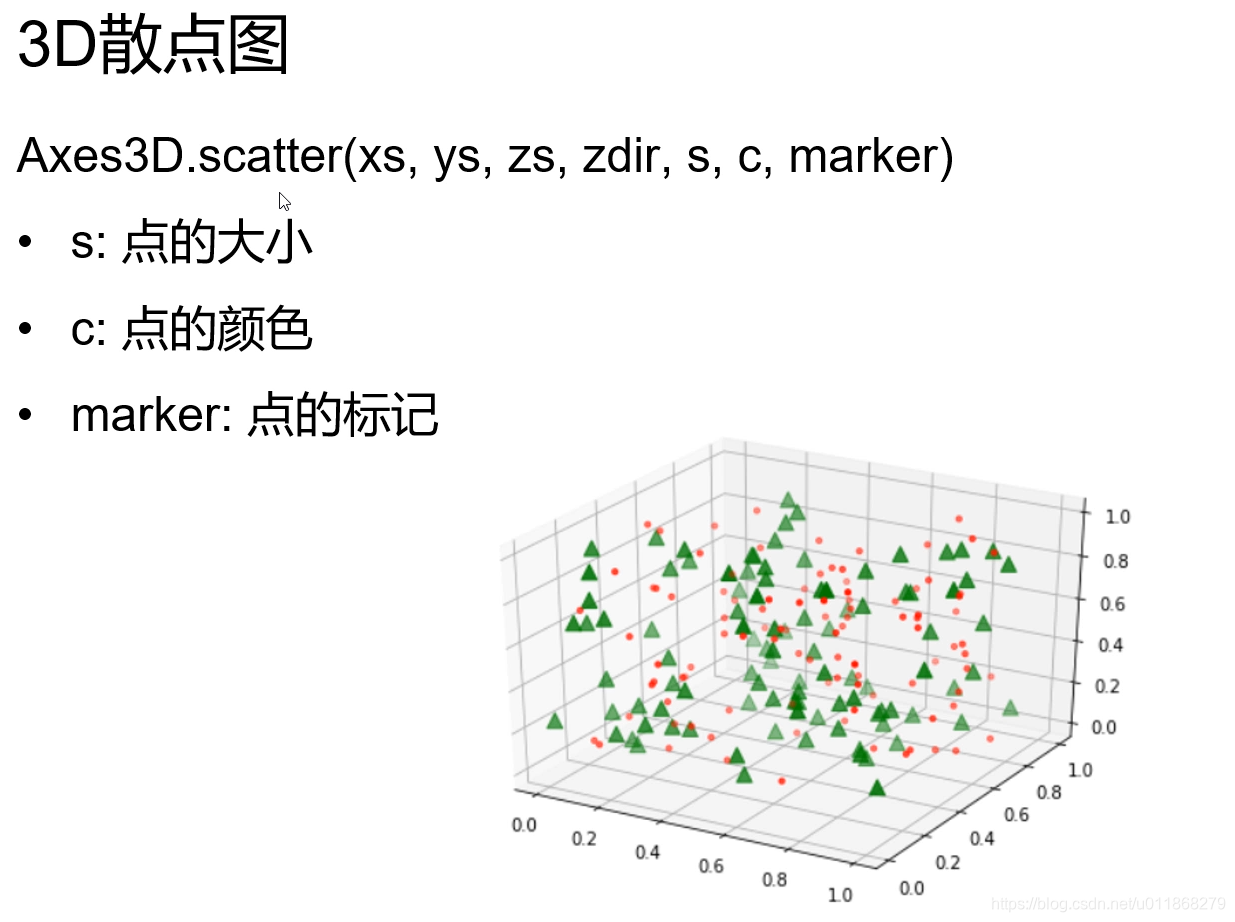
3D 散点图可视化
In [28]:
import numpy as np
from mpl_toolkits.mplot3d import Axes3D
import matplotlib.pyplot as plt
In [29]:
# 准备2组散点数据
x1 = np.random.rand(100)
y1 = np.random.rand(100)
z1 = np.random.rand(100)
x2 = np.random.rand(100)
y2 = np.random.rand(100)
z2 = np.random.rand(100)
In [30]:
# 创建3D图像对象
fig = plt.figure()
ax = Axes3D(fig)
# 绘制图像
ax.scatter(x1, y1, z1, s=10, c='r',marker='o')
ax.scatter(x2, y2, z2, s=80, c='g',marker='^')
plt.show()
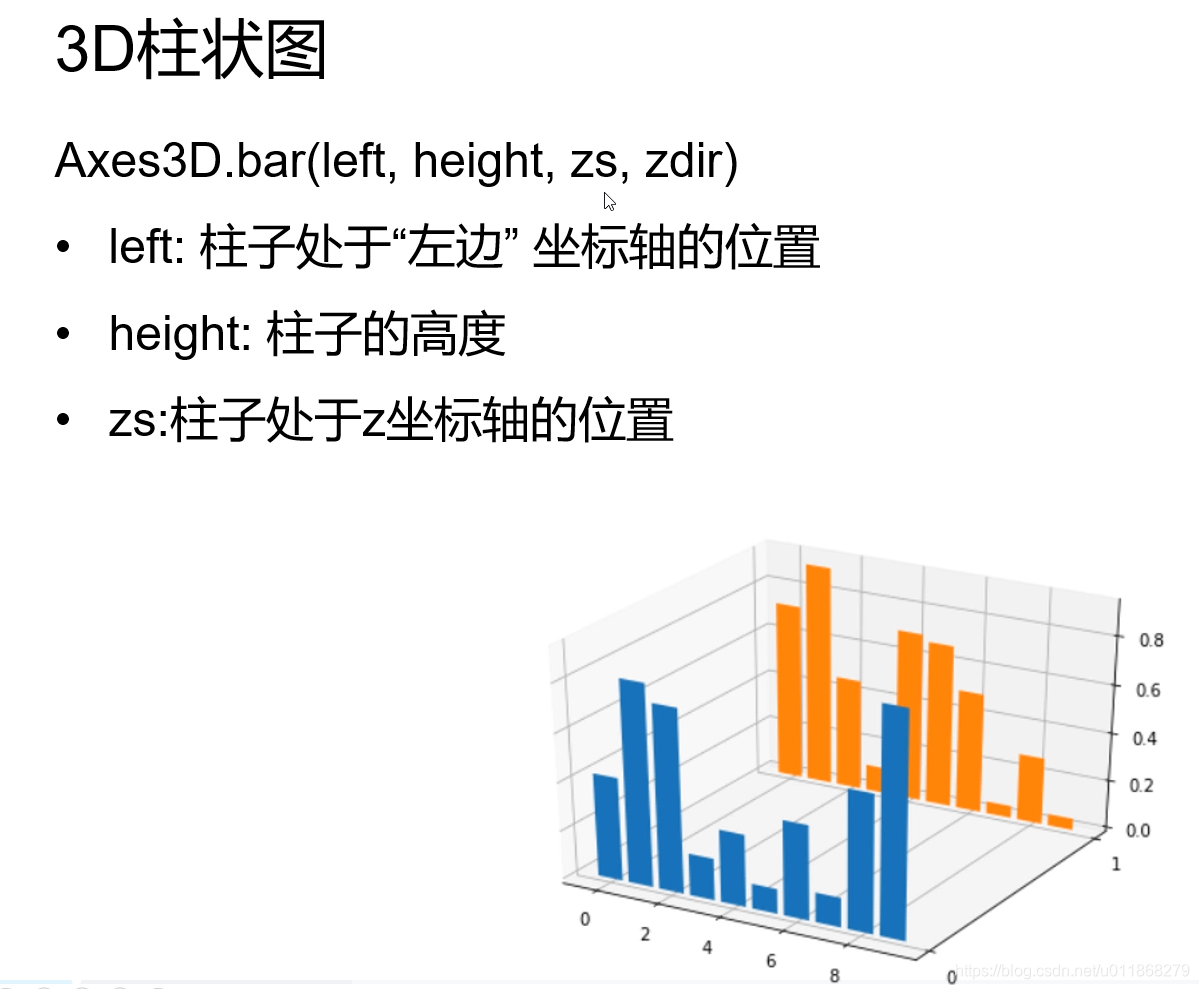
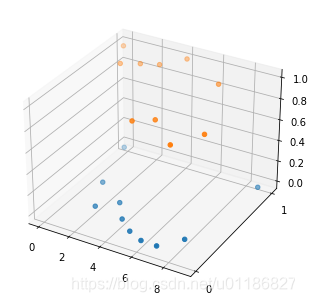
3D 柱状图可视化
In [31]:
import numpy as np
from mpl_toolkits.mplot3d import Axes3D
import matplotlib.pyplot as plt
In [32]:
# 准备数据
x = np.arange(10)
y1 = np.random.rand(10)
y2 = np.random.rand(10)
In [33]:
# 创建3D图像对象
fig = plt.figure()
ax = Axes3D(fig)
# 绘制图像
ax.scatter(x, y1,0)
ax.scatter(x, y2,1)
ax.set_yticks([0, 1])
plt.show()
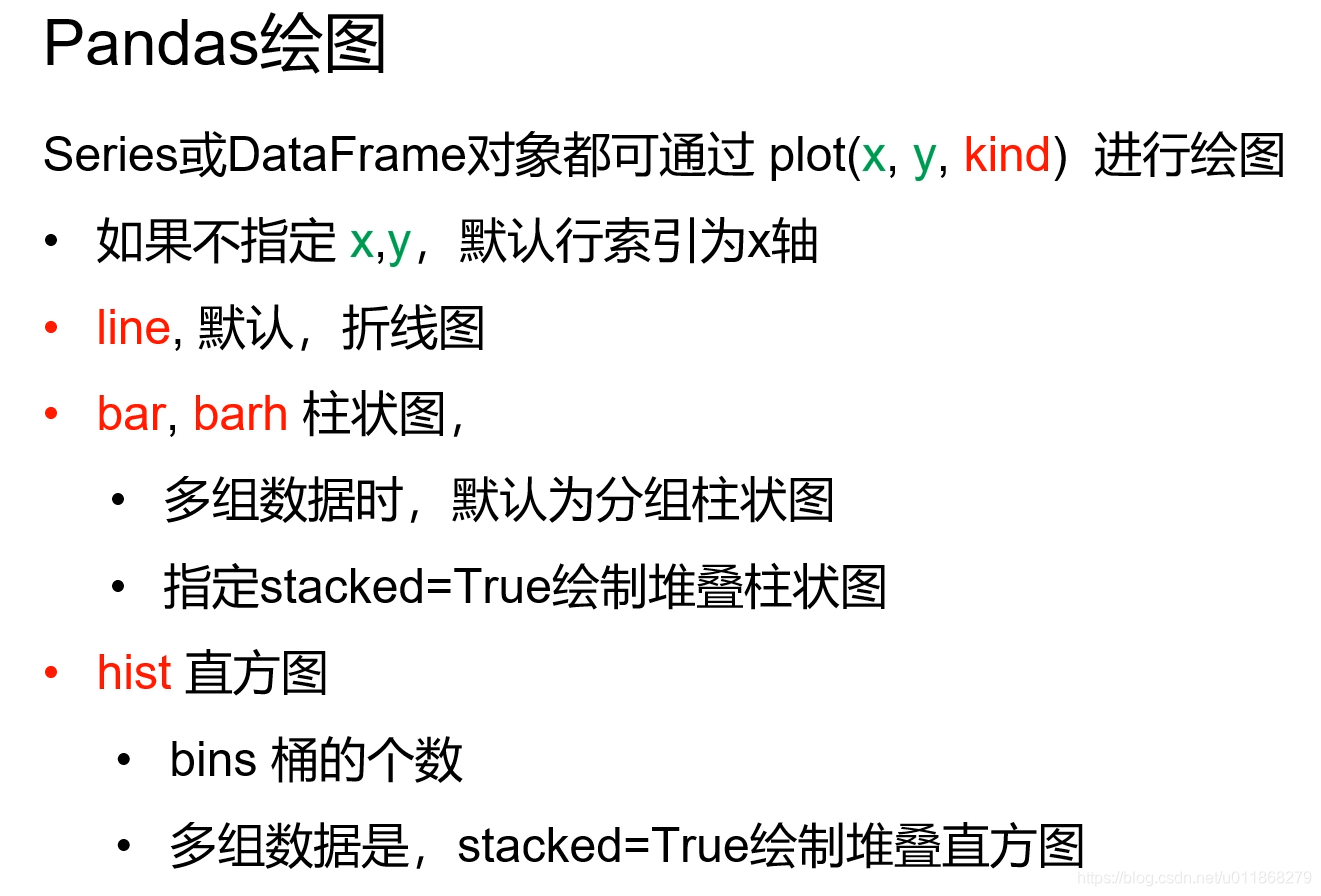
Pandas 绘图
In [34]:
import matplotlib.pyplot as plt
import pandas as pd
In [36]:
# 加载鸢尾花数据集
iris_data = pd.read_csv(r'C:\Users\ML Learning\Projects\第四章-数据分析预习内容\第四章-数据分析预习内容\第三节-数据可视化\lesson_07\lesson_07\examples\dataset\iris.csv')
iris_data.head()
Out[36]:
| sepal_length | sepal_width | petal_length | petal_width | species | |
|---|---|---|---|---|---|
| 0 | 5.1 | 3.5 | 1.4 | 0.2 | setosa |
| 1 | 4.9 | 3.0 | 1.4 | 0.2 | setosa |
| 2 | 4.7 | 3.2 | 1.3 | 0.2 | setosa |
| 3 | 4.6 | 3.1 | 1.5 | 0.2 | setosa |
| 4 | 5.0 | 3.6 | 1.4 | 0.2 | setosa |
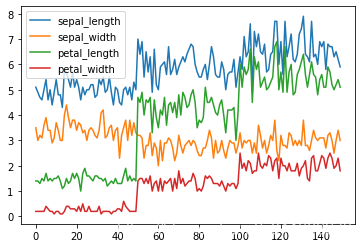
折线图
In [37]:
iris_data.plot()
Out[37]:
<AxesSubplot:>
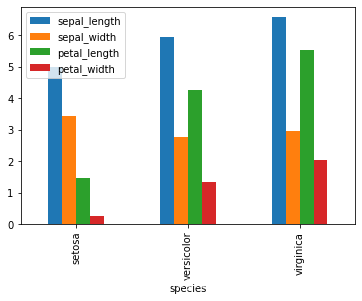
柱状图
In [39]:
# 分组柱状图
iris_data.groupby('species').mean().plot(kind='bar')
Out[39]:
<AxesSubplot:xlabel='species'>
In [40]:
# 堆叠柱状图
iris_data.groupby('species').mean().plot(kind='bar',stacked=True)
Out[40]:
<AxesSubplot:xlabel='species'>
In [ ]:
这篇关于交互式数据可视化工具Boken介绍的文章就介绍到这儿,希望我们推荐的文章对编程师们有所帮助!


