本文主要是介绍关于微软C#中的CHART图表控件的简单使用,希望对大家解决编程问题提供一定的参考价值,需要的开发者们随着小编来一起学习吧!
http://www.cnblogs.com/winshe/articles/6604406.html
https://blog.csdn.net/akof1314/article/details/5710866
http://www.360doc.com/content/13/1016/10/9981262_321805184.shtml
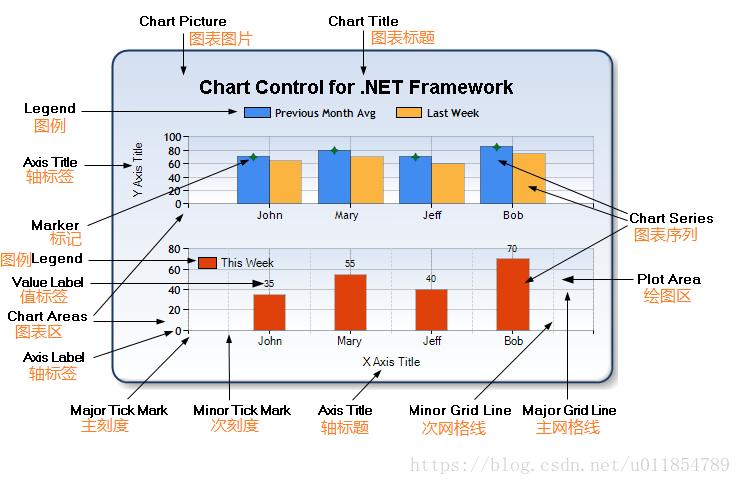
在.NET环境下微软提供了强大了图表控件,并给多了很多实例,关于图表的基本元素如下:
并且MSDN给出了创建图表的示例步骤,原文地址:http://msdn.microsoft.com/en-us/library/dd489237.aspx
在这里,我仅作为自己理解的,并实践的,以中文方式写出步骤,未免出错,还请参照MSDN。添加一个图表控件到应用程序:
1,在设计视图下,打开“工具箱
”;
2,在“Data
”分类下,拖动一个图表控件到设计区域;
3,在其属性中展开“ChartAreas
”子属性,弹出的“ChartAreas 集合编辑器
”中,这里包含了当前图表控件的所有图表区,并且注意此时此集合器已经包含了一个图表区,名称为"ChartArea1
";
4,点击“添加
”,新增一个图表区,请注意,在设计区域的图表缩小到原来的一半大小。这是因为新创建的图表区是放置在底部,但不包含一个数据系列;
5,在图表控件的“Series
”子属性,展开弹出“Series 集合编辑器
”,注意这里已经包含了一个序列,名称为”Series1
“;
6,点击”添加
“,新增一个序列,在其右边设置其属性,“ChartArea
”属性为ChartArea2
,“ChartType
”属性为Bar
,“Name
”属性为BarChart
,点击“确定
”完成。此时运行程序未出现任何结果,因为还没有数据;
添加数据到图表:
1,打开“Series 集合编辑器
”,在左边的”成员“中选择”Series1
“,在右边的属性区域点击展开”Points
“,弹出”DataPoint 集合编辑器
“;
2,点击”添加
“,在其右边属性的”YValues
“属性中输入值,重复这一步知道添加了5个数据点;
3,点击”确定
“,然后对”BarChart
“序列进行与第2步一样的操作;
4,”确定
“完成,运行程序可以在图表控件上看到两个图表区,显示着刚刚创建的两个序列的数据点。请注意这两个序列的不同图表类型。
添加图例到图表:
1,在图表控件属性中,点击”Legends
“,展开”Legend 集合编辑器
“,如果没有已存在的一个图例,那么就添加一个;
2,设置这个图例属性,其中”DockedToChartArea
“值为”ChartArea1
“,”Docking
“值为”Right
“,”IsDockedInsideChartArea
“值为”False
“;
3,再添加一个图例,设置属性其中”DockedToChartArea
“值为”ChartArea2
“,”Docking
“值为”Right
“;
4,点击”确定
“完成。此时图表区域的第二个图例显示为空。默认所有的序列都分配到第一个图例,你也可以分配每个序列到不同的图例;
5,打开”Series 集合编辑器
”,选择“BarChart
”项,在其“Legend
”属性中下拉列表选择“Legend2
”,完成运行程序。
添加标题到图表:
1,在图表控件属性中,点击“Titles
”,展开“Title 集合编辑器
”,点击“添加
”,在右边的属性“Text
”中输入图表的标题;
2,点击“确定
”,运行程序看效果。
使用注解标记图表上的数据点:
1,在图表控件属性中,点击“Annotations
”,展开“Annotation 集合编辑器
”;
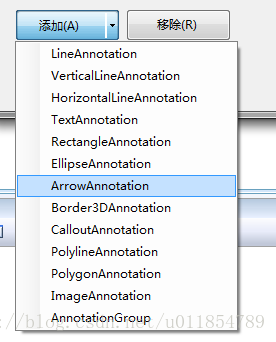
2,点击“添加
”的下拉列表,选择“ArrowAnnotation
”,如图:
3,在右边的属性“定位点
”分类下,下列选择“AnchorDataPoint
”值为第一个序列的第一个数据点;
4,其具体属性“Height
”值为-5,“Width
”值为0,“AnchorOffSetY
”值为-2.5;
5,在其属性“杂项
”展开“SmartLabelStyle
”子属性,设置“IsOverlappedHidden
”为”False“;
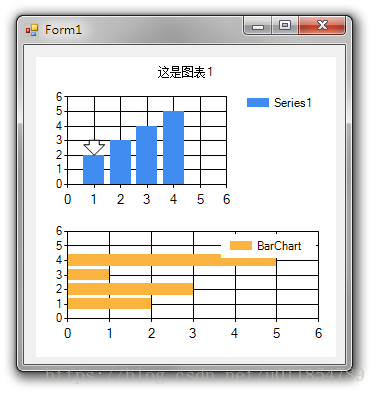
6,点击”确定
“,运行程序。
程序效果如图:
最近公司项目要用到Chart图表控件,这是一个比较老的东西了,目前网络上似乎已经不太流行这个控件,但是只要配置了相关的属性,效果还是可以的。前前后后摸索了好久,接下来谈谈这个件控件最重要的几个属性。
1.ChartAreas属性
ChartAreas属性指绘图区,一个控件可以有多个绘图区,比如我要在同一个控件内显示饼图和柱状图,肯定不能放在同一个ChartAreas区域内,应该在同一个Chart控件里增加两个ChartAreas并分别绑定Series对象。所以ChartAreas属性对应的是一个集合。
2.Series属性
Series属性就是各种图表的图形啦,比如我们要显示某月的天气变化,那么应该有这样两组数据,一组是天数,一组是每天对应的温度值,同时绑定到Series对象中,再将Series对象Add()到Chart控件的Series属性里即可。为了横向比较,例如我要看本月与上月的天气曲线变化图,并同时显示在同一个ChartAreas中,那该怎么办呢?很简单,再实例一个Series对象,将上月的天数数组与温度值数组绑定到一个新的Series2实例中,再将Series2实例Add()到Chart控件的Series属性里,此时,Chart控件的第一个绘图区ChartArea里就会有两条曲线。
3.Legends属性
Legend就是指一个图标的图例,当一个Series属性有多个Series时,或是一个Series有几组数据时,为了区分各自的颜色,通常每个Serie对象一种颜色,这就需要用到图例来指明哪个颜色的代表的是什么数据。如下图所示:
4.关于数据的绑定
将要显示的X轴和Y轴的数据分别放到两个数组里在, 然后绑定即可。
cht1.Series[0].Points.DataBindXY(x, y);
完整的代码如下:
复制代码
using System;
using System.Collections.Generic;
using System.Linq;
using System.Web;
using System.Web.UI;
using System.Web.UI.WebControls;
using System.Drawing;
using System.Web.UI.DataVisualization.Charting;
public partial class _Default : System.Web.UI.Page
{
protected void Page_Load(object sender, EventArgs e)
{
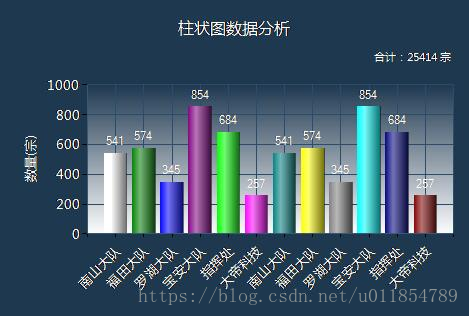
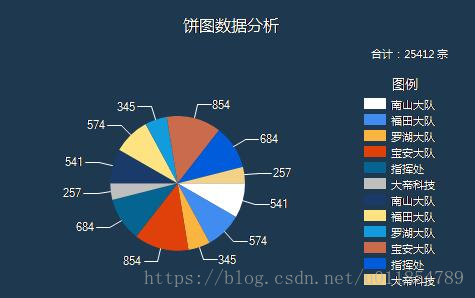
string[] x = new string[] { “南山大队”, “福田大队”, “罗湖大队”, “宝安大队”, “指挥处”, “大帝科技”, “南山大队”, “福田大队”, “罗湖大队”, “宝安大队”, “指挥处”, “大帝科技”};
double[] y = new double[] { 541, 574, 345, 854, 684, 257, 541, 574, 345, 854, 684, 257 };
string[] z = new string[] { “”, “”, “”, “”, “”, “”, “”, “”, “”, “”, “”, “” };
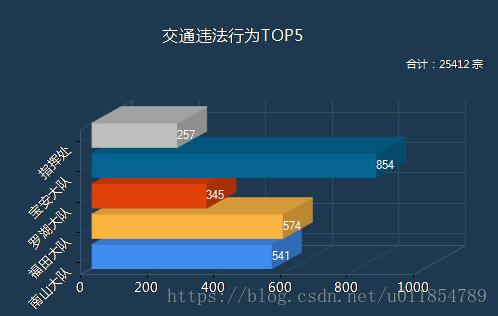
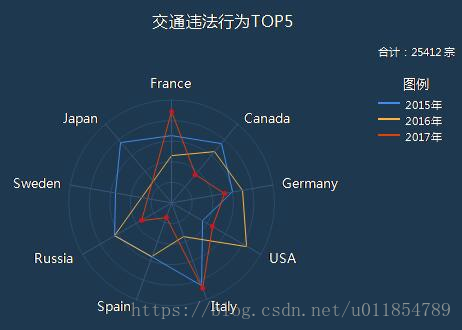
string[] a = new string[] { "南山大队", "福田大队", "罗湖大队", "宝安大队", "指挥处", };double[] b = new double[] { 541, 574, 345, 854, 257 };#region 柱状图//标题cht1.Titles.Add("柱状图数据分析"); cht1.Titles[0].ForeColor = Color.White;cht1.Titles[0].Font = new Font("微软雅黑", 12f, FontStyle.Regular);cht1.Titles[0].Alignment = ContentAlignment.TopCenter;cht1.Titles.Add("合计:25414 宗");cht1.Titles[1].ForeColor = Color.White;cht1.Titles[1].Font = new Font("微软雅黑", 8f, FontStyle.Regular);cht1.Titles[1].Alignment = ContentAlignment.TopRight;//控件背景cht1.BackColor = Color.Transparent;//图表区背景cht1.ChartAreas[0].BackColor = Color.Transparent;cht1.ChartAreas[0].BorderColor = Color.Transparent;//X轴标签间距cht1.ChartAreas[0].AxisX.Interval = 1;cht1.ChartAreas[0].AxisX.LabelStyle.IsStaggered = true;cht1.ChartAreas[0].AxisX.LabelStyle.Angle = -45;cht1.ChartAreas[0].AxisX.TitleFont = new Font("微软雅黑", 14f, FontStyle.Regular);cht1.ChartAreas[0].AxisX.TitleForeColor = Color.White;//X坐标轴颜色cht1.ChartAreas[0].AxisX.LineColor = ColorTranslator.FromHtml("#38587a"); ;cht1.ChartAreas[0].AxisX.LabelStyle.ForeColor = Color.White;cht1.ChartAreas[0].AxisX.LabelStyle.Font = new Font("微软雅黑", 10f, FontStyle.Regular);//X坐标轴标题//cht1.ChartAreas[0].AxisX.Title = "数量(宗)";//cht1.ChartAreas[0].AxisX.TitleFont = new Font("微软雅黑", 10f, FontStyle.Regular);//cht1.ChartAreas[0].AxisX.TitleForeColor = Color.White;//cht1.ChartAreas[0].AxisX.TextOrientation = TextOrientation.Horizontal;//cht1.ChartAreas[0].AxisX.ToolTip = "数量(宗)";//X轴网络线条cht1.ChartAreas[0].AxisX.MajorGrid.Enabled = true;cht1.ChartAreas[0].AxisX.MajorGrid.LineColor = ColorTranslator.FromHtml("#2c4c6d");//Y坐标轴颜色cht1.ChartAreas[0].AxisY.LineColor = ColorTranslator.FromHtml("#38587a"); cht1.ChartAreas[0].AxisY.LabelStyle.ForeColor = Color.White; cht1.ChartAreas[0].AxisY.LabelStyle.Font = new Font("微软雅黑", 10f, FontStyle.Regular);//Y坐标轴标题cht1.ChartAreas[0].AxisY.Title = "数量(宗)";cht1.ChartAreas[0].AxisY.TitleFont = new Font("微软雅黑", 10f, FontStyle.Regular);cht1.ChartAreas[0].AxisY.TitleForeColor = Color.White;cht1.ChartAreas[0].AxisY.TextOrientation = TextOrientation.Rotated270;cht1.ChartAreas[0].AxisY.ToolTip = "数量(宗)";//Y轴网格线条cht1.ChartAreas[0].AxisY.MajorGrid.Enabled = true;cht1.ChartAreas[0].AxisY.MajorGrid.LineColor = ColorTranslator.FromHtml("#2c4c6d");cht1.ChartAreas[0].AxisY2.LineColor = Color.Transparent;cht1.ChartAreas[0].BackGradientStyle = GradientStyle.TopBottom;Legend legend = new Legend("legend");legend.Title = "legendTitle";cht1.Series[0].XValueType = ChartValueType.String; //设置X轴上的值类型cht1.Series[0].Label = "#VAL"; //设置显示X Y的值 cht1.Series[0].LabelForeColor = Color.White;cht1.Series[0].ToolTip = "#VALX:#VAL"; //鼠标移动到对应点显示数值cht1.Series[0].ChartType = SeriesChartType.Column; //图类型(折线)cht1.Series[0].Color = Color.Lime;cht1.Series[0].LegendText = legend.Name;cht1.Series[0].IsValueShownAsLabel = true;cht1.Series[0].LabelForeColor = Color.White;cht1.Series[0].CustomProperties = "DrawingStyle = Cylinder";cht1.Legends.Add(legend);cht1.Legends[0].Position.Auto = false;//绑定数据cht1.Series[0].Points.DataBindXY(x, y);cht1.Series[0].Points[0].Color = Color.White;cht1.Series[0].Palette = ChartColorPalette.Bright;#endregion#region 饼图//标题cht2.Titles.Add("饼图数据分析");cht2.Titles[0].ForeColor = Color.White;cht2.Titles[0].Font = new Font("微软雅黑", 12f, FontStyle.Regular);cht2.Titles[0].Alignment = ContentAlignment.TopCenter;cht2.Titles.Add("合计:25412 宗");cht2.Titles[1].ForeColor = Color.White;cht2.Titles[1].Font = new Font("微软雅黑", 8f, FontStyle.Regular);cht2.Titles[1].Alignment = ContentAlignment.TopRight;//控件背景cht2.BackColor = Color.Transparent;//图表区背景cht2.ChartAreas[0].BackColor = Color.Transparent;cht2.ChartAreas[0].BorderColor = Color.Transparent;//X轴标签间距cht2.ChartAreas[0].AxisX.Interval = 1;cht2.ChartAreas[0].AxisX.LabelStyle.IsStaggered = true;cht2.ChartAreas[0].AxisX.LabelStyle.Angle = -45;cht2.ChartAreas[0].AxisX.TitleFont = new Font("微软雅黑", 14f, FontStyle.Regular);cht2.ChartAreas[0].AxisX.TitleForeColor = Color.White;//X坐标轴颜色cht2.ChartAreas[0].AxisX.LineColor = ColorTranslator.FromHtml("#38587a"); ;cht2.ChartAreas[0].AxisX.LabelStyle.ForeColor = Color.White;cht2.ChartAreas[0].AxisX.LabelStyle.Font = new Font("微软雅黑", 10f, FontStyle.Regular);//X坐标轴标题cht2.ChartAreas[0].AxisX.Title = "数量(宗)";cht2.ChartAreas[0].AxisX.TitleFont = new Font("微软雅黑", 10f, FontStyle.Regular);cht2.ChartAreas[0].AxisX.TitleForeColor = Color.White;cht2.ChartAreas[0].AxisX.TextOrientation = TextOrientation.Horizontal;cht2.ChartAreas[0].AxisX.ToolTip = "数量(宗)";//X轴网络线条cht2.ChartAreas[0].AxisX.MajorGrid.Enabled = true;cht2.ChartAreas[0].AxisX.MajorGrid.LineColor = ColorTranslator.FromHtml("#2c4c6d");//Y坐标轴颜色cht2.ChartAreas[0].AxisY.LineColor = ColorTranslator.FromHtml("#38587a");cht2.ChartAreas[0].AxisY.LabelStyle.ForeColor = Color.White;cht2.ChartAreas[0].AxisY.LabelStyle.Font = new Font("微软雅黑", 10f, FontStyle.Regular);//Y坐标轴标题cht2.ChartAreas[0].AxisY.Title = "数量(宗)";cht2.ChartAreas[0].AxisY.TitleFont = new Font("微软雅黑", 10f, FontStyle.Regular);cht2.ChartAreas[0].AxisY.TitleForeColor = Color.White;cht2.ChartAreas[0].AxisY.TextOrientation = TextOrientation.Rotated270;cht2.ChartAreas[0].AxisY.ToolTip = "数量(宗)";//Y轴网格线条cht2.ChartAreas[0].AxisY.MajorGrid.Enabled = true;cht2.ChartAreas[0].AxisY.MajorGrid.LineColor = ColorTranslator.FromHtml("#2c4c6d");cht2.ChartAreas[0].AxisY2.LineColor = Color.Transparent;//背景渐变cht2.ChartAreas[0].BackGradientStyle = GradientStyle.None;//图例样式Legend legend2 = new Legend("#VALX");legend2.Title = "图例";legend2.TitleBackColor = Color.Transparent;legend2.BackColor = Color.Transparent;legend2.TitleForeColor = Color.White;legend2.TitleFont = new Font("微软雅黑", 10f, FontStyle.Regular);legend2.Font = new Font("微软雅黑", 8f, FontStyle.Regular);legend2.ForeColor = Color.White; cht2.Series[0].XValueType = ChartValueType.String; //设置X轴上的值类型cht2.Series[0].Label = "#VAL"; //设置显示X Y的值 cht2.Series[0].LabelForeColor = Color.White;cht2.Series[0].ToolTip = "#VALX:#VAL(宗)"; //鼠标移动到对应点显示数值cht2.Series[0].ChartType = SeriesChartType.Pie; //图类型(折线)cht2.Series[0].Color = Color.Lime;cht2.Series[0].LegendText = legend2.Name;cht2.Series[0].IsValueShownAsLabel = true;cht2.Series[0].LabelForeColor = Color.White;cht2.Series[0].CustomProperties = "DrawingStyle = Cylinder";cht2.Series[0].CustomProperties = "PieLabelStyle = Outside";cht2.Legends.Add(legend2);cht2.Legends[0].Position.Auto = true;cht2.Series[0].IsValueShownAsLabel = true;//是否显示图例cht2.Series[0].IsVisibleInLegend = true;cht2.Series[0].ShadowOffset = 0;//饼图折线cht2.Series[0]["PieLineColor"] = "White"; //绑定数据cht2.Series[0].Points.DataBindXY(x, y);cht2.Series[0].Points[0].Color = Color.White;//绑定颜色cht2.Series[0].Palette = ChartColorPalette.BrightPastel;#endregion#region Bar图//标题cht3.Titles.Add("交通违法行为TOP5");cht3.Titles[0].ForeColor = Color.White;cht3.Titles[0].Font = new Font("微软雅黑", 12f, FontStyle.Regular);cht3.Titles[0].Alignment = ContentAlignment.TopCenter;cht3.Titles.Add("合计:25412 宗 ");cht3.Titles[1].ForeColor = Color.White;cht3.Titles[1].Font = new Font("微软雅黑", 8f, FontStyle.Regular);cht3.Titles[1].Alignment = ContentAlignment.TopRight;//控件背景cht3.BackColor = Color.Transparent;//图表区背景cht3.ChartAreas[0].BackColor = Color.Transparent;cht3.ChartAreas[0].BorderColor = Color.Transparent;//X轴标签间距cht3.ChartAreas[0].AxisX.Interval = 1;cht3.ChartAreas[0].AxisX.LabelStyle.IsStaggered = true;cht3.ChartAreas[0].AxisX.LabelStyle.Angle = -45;cht3.ChartAreas[0].AxisX.TitleFont = new Font("微软雅黑", 14f, FontStyle.Regular);cht3.ChartAreas[0].AxisX.TitleForeColor = Color.White;//X坐标轴颜色cht3.ChartAreas[0].AxisX.LineColor = ColorTranslator.FromHtml("#38587a"); ;cht3.ChartAreas[0].AxisX.LabelStyle.ForeColor = Color.White;cht3.ChartAreas[0].AxisX.LabelStyle.Font = new Font("微软雅黑", 10f, FontStyle.Regular);//X坐标轴标题//cht3.ChartAreas[0].AxisX.Title = "数量(宗)";//cht3.ChartAreas[0].AxisX.TitleFont = new Font("微软雅黑", 10f, FontStyle.Regular);//cht3.ChartAreas[0].AxisX.TitleForeColor = Color.White;//cht3.ChartAreas[0].AxisX.TextOrientation = TextOrientation.Auto;//cht3.ChartAreas[0].AxisX.ToolTip = "数量(宗)";//X轴网络线条cht3.ChartAreas[0].AxisX.MajorGrid.Enabled = true;cht3.ChartAreas[0].AxisX.MajorGrid.LineColor = ColorTranslator.FromHtml("#2c4c6d");//Y坐标轴颜色cht3.ChartAreas[0].AxisY.LineColor = ColorTranslator.FromHtml("#38587a");cht3.ChartAreas[0].AxisY.LabelStyle.ForeColor = Color.White;cht3.ChartAreas[0].AxisY.LabelStyle.Font = new Font("微软雅黑", 10f, FontStyle.Regular);//Y坐标轴标题//cht3.ChartAreas[0].AxisY.Title = "数量(宗)";//cht3.ChartAreas[0].AxisY.TitleFont = new Font("微软雅黑", 10f, FontStyle.Regular);//cht3.ChartAreas[0].AxisY.TitleForeColor = Color.White;//cht3.ChartAreas[0].AxisY.TextOrientation = TextOrientation.Auto;//cht3.ChartAreas[0].AxisY.ToolTip = "数量(宗)";//Y轴网格线条cht3.ChartAreas[0].AxisY.MajorGrid.Enabled = true;cht3.ChartAreas[0].AxisY.MajorGrid.LineColor = ColorTranslator.FromHtml("#2c4c6d");cht3.ChartAreas[0].AxisY2.LineColor = Color.Transparent;cht3.ChartAreas[0].AxisX.IsMarginVisible = false;cht3.ChartAreas[0].Area3DStyle.Enable3D = true;//背景渐变cht2.ChartAreas[0].BackGradientStyle = GradientStyle.None;//图例样式Legend legend3 = new Legend("#VALX");legend3.Title = "图例";legend3.TitleBackColor = Color.Transparent;legend3.BackColor = Color.Transparent;legend3.TitleForeColor = Color.White;legend3.TitleFont = new Font("微软雅黑", 10f, FontStyle.Regular);legend3.Font = new Font("微软雅黑", 8f, FontStyle.Regular);legend3.ForeColor = Color.White;cht3.Series[0].XValueType = ChartValueType.String; //设置X轴上的值类型cht3.Series[0].Label = "#VAL"; //设置显示X Y的值 cht3.Series[0].LabelForeColor = Color.White;cht3.Series[0].ToolTip = "#VALX:#VAL(宗)"; //鼠标移动到对应点显示数值cht3.Series[0].ChartType = SeriesChartType.Bar; //图类型(折线)cht3.Series[0].Color = Color.Lime;//cht3.Series[0].LegendText = legend3.Name;cht3.Series[0].IsValueShownAsLabel = true;cht3.Series[0].LabelForeColor = Color.White;cht3.Series[0].CustomProperties = "DrawingStyle = Cylinder";cht3.Series[0].CustomProperties = "PieLabelStyle = Outside";//cht3.Legends.Add(legend3);//cht3.Legends[0].Position.Auto = true;//是否显示图例cht3.Series[0].IsVisibleInLegend = true;cht3.Series[0].ShadowOffset = 0;//饼图折线cht3.Series[0]["PieLineColor"] = "White";//绑定数据cht3.Series[0].Points.DataBindXY(a, b);//cht3.Series[0].Points[0].Color = Color.White;//绑定颜色cht3.Series[0].Palette = ChartColorPalette.BrightPastel;//for (int n = 0; n < x.Length; n++)//{// int ptIdx = cht3.Series[0].Points.AddY(Convert.ToDouble(y[n]));// DataPoint pt = this.cht3.Series[0].Points[ptIdx];// pt.LegendText = x[n] + " " + "#PERCENT{P2}" + " [ " + "#VAL{D} 次" + " ]";//右边标签列显示的文字 // pt.Label = x[n] + " " + "#PERCENT{P2}" + " [ " + "#VAL{D} 次" + " ]"; //圆饼外显示的信息 // // pt.LabelToolTip = "#PERCENT{P2}"; // //pt.LabelBorderColor = Color.Red;//文字背景色 //}#endregion#region 雷达图// //标题cht4.Titles.Add("交通违法行为TOP5");cht4.Titles[0].ForeColor = Color.White;cht4.Titles[0].Font = new Font("微软雅黑", 12f, FontStyle.Regular);cht4.Titles[0].Alignment = ContentAlignment.TopCenter;cht4.Titles.Add("合计:25412 宗 ");cht4.Titles[1].ForeColor = Color.White;cht4.Titles[1].Font = new Font("微软雅黑", 8f, FontStyle.Regular);cht4.Titles[1].Alignment = ContentAlignment.TopRight;//控件背景cht4.BackColor = Color.Transparent;cht4.ChartAreas[0].BackColor = Color.Transparent;cht4.ChartAreas[0].BorderColor = Color.Transparent;//X轴标签间距cht4.ChartAreas[0].AxisX.Interval = 1;cht4.ChartAreas[0].AxisX.LabelStyle.IsStaggered = true;cht4.ChartAreas[0].AxisX.LabelStyle.Angle = -45;cht4.ChartAreas[0].AxisX.TitleFont = new Font("微软雅黑", 14f, FontStyle.Regular);cht4.ChartAreas[0].AxisX.TitleForeColor = Color.White;//X坐标轴颜色cht4.ChartAreas[0].AxisX.LineColor = ColorTranslator.FromHtml("#38587a"); ;cht4.ChartAreas[0].AxisX.LabelStyle.ForeColor = Color.White;cht4.ChartAreas[0].AxisX.LabelStyle.Font = new Font("微软雅黑", 10f, FontStyle.Regular);//X坐标轴标题//cht4.ChartAreas[0].AxisX.Title = "数量(宗)";//cht4.ChartAreas[0].AxisX.TitleFont = new Font("微软雅黑", 10f, FontStyle.Regular);//cht4.ChartAreas[0].AxisX.TitleForeColor = Color.White;//cht4.ChartAreas[0].AxisX.TextOrientation = TextOrientation.Auto;//cht4.ChartAreas[0].AxisX.ToolTip = "数量(宗)";//X轴网络线条cht4.ChartAreas[0].AxisX.MajorGrid.Enabled = true;cht4.ChartAreas[0].AxisX.MajorGrid.LineColor = ColorTranslator.FromHtml("#2c4c6d");//Y坐标轴颜色cht4.ChartAreas[0].AxisY.LineColor = ColorTranslator.FromHtml("#38587a");cht4.ChartAreas[0].AxisY.LabelStyle.ForeColor = Color.White;cht4.ChartAreas[0].AxisY.LabelStyle.Font = new Font("微软雅黑", 10f, FontStyle.Regular);//Y坐标轴标题//cht4.ChartAreas[0].AxisY.Title = "数量(宗)";//cht4.ChartAreas[0].AxisY.TitleFont = new Font("微软雅黑", 10f, FontStyle.Regular);//cht4.ChartAreas[0].AxisY.TitleForeColor = Color.White;//cht4.ChartAreas[0].AxisY.TextOrientation = TextOrientation.Auto;//cht4.ChartAreas[0].AxisY.ToolTip = "数量(宗)";//Y轴网格线条cht4.ChartAreas[0].AxisY.MajorGrid.Enabled = true;cht4.ChartAreas[0].AxisY.MajorGrid.LineColor = ColorTranslator.FromHtml("#2c4c6d");cht4.ChartAreas[0].AxisY2.LineColor = Color.Transparent;cht4.ChartAreas[0].AxisX.IsMarginVisible = false;cht4.ChartAreas[0].Area3DStyle.Enable3D = true;cht4.ChartAreas[0].AxisX.IsInterlaced = false;cht4.ChartAreas[0].AxisX.IsMarginVisible = false;//刻度线cht4.ChartAreas[0].AxisY.MajorTickMark.Enabled = false;//cht4.ChartAreas[0].AxisX.MajorGrid.Enabled = false;//cht4.ChartAreas[0].AxisY.MajorGrid.Enabled = false;//cht4.ChartAreas[0].AxisX.MajorTickMark.Enabled = false;cht4.ChartAreas[0].AxisY.LabelStyle.Enabled = false;//背景渐变cht4.ChartAreas[0].BackGradientStyle = GradientStyle.None;//cht4.ChartAreas[0].AxisX2.InterlacedColor = Color.Red;//cht4.ChartAreas[0].AxisY2.InterlacedColor = Color.Red;//cht4.ChartAreas[0].BorderWidth = 0;//cht4.ChartAreas[0].BackSecondaryColor = Color.Red;//cht4.ChartAreas[0].BackImageTransparentColor = Color.Red;//cht4.ChartAreas[0].AxisX.InterlacedColor = Color.Red;//cht4.ChartAreas[0].AxisX.LineColor = Color.Red;//cht4.ChartAreas[0].AxisX2.LineColor = Color.Red;//cht4.ChartAreas[0].AxisX2.MajorGrid.LineColor = Color.Red;//cht4.ChartAreas[0].AxisX2.MajorTickMark.LineColor = Color.Red;//cht4.ChartAreas[0].AxisX2.MinorTickMark.LineColor = Color.Red;//cht4.ChartAreas[0].AxisY.InterlacedColor = Color.Red;//cht4.ChartAreas[0].AxisY.LineColor = Color.Red;//cht4.ChartAreas[0].AxisY2.InterlacedColor = Color.Red;//cht4.ChartAreas[0].AxisY2.LineColor = Color.Red;//cht4.ChartAreas[0].AxisY2.MajorGrid.LineColor = Color.Red;//cht4.ChartAreas[0].AxisY2.MajorTickMark.LineColor = Color.Red;//cht4.ChartAreas[0].AxisY2.MinorTickMark.LineColor = Color.Red;//图例样式Legend legend4 = new Legend();legend4.Title = "图例";legend4.TitleBackColor = Color.Transparent;legend4.BackColor = Color.Transparent;legend4.TitleForeColor = Color.White;legend4.TitleFont = new Font("微软雅黑", 10f, FontStyle.Regular);legend4.Font = new Font("微软雅黑", 8f, FontStyle.Regular);legend4.ForeColor = Color.White;cht4.Legends.Add(legend4);cht4.Legends[0].Position.Auto = true;//Series1cht4.Series[0].XValueType = ChartValueType.String; cht4.Series[0].Label = "#VAL"; cht4.Series[0].LabelForeColor = Color.White;cht4.Series[0].ToolTip = "#LEGENDTEXT:#VAL(宗)"; cht4.Series[0].ChartType = SeriesChartType.Radar; cht4.Series[0]["RadarDrawingStyle"] = "Line"; cht4.Series[0].LegendText = "2015年";cht4.Series[0].IsValueShownAsLabel = true;//Series2cht4.Series.Add(new Series("Series2"));cht4.Series[1].Label = "#VAL"; cht4.Series[1].LabelForeColor = Color.White;cht4.Series[1].ToolTip = "#LEGENDTEXT:#VAL(宗)"; cht4.Series[1].ChartType = SeriesChartType.Radar; cht4.Series[1]["RadarDrawingStyle"] = "Line";cht4.Series[1].LegendText = "2016年";cht4.Series[1].IsValueShownAsLabel = true;//Series3cht4.Series.Add(new Series("Series3"));cht4.Series[2].Label = "#VAL"; cht4.Series[2].LabelForeColor = Color.White;cht4.Series[2].ToolTip = "#LEGENDTEXT:#VAL(宗)"; cht4.Series[2].ChartType = SeriesChartType.Radar; cht4.Series[2]["RadarDrawingStyle"] = "Line";cht4.Series[2].LegendText = "2017年";cht4.Series[2].IsValueShownAsLabel = true;double[] yValues = { 65.62, 75.54, 60.45, 34.73, 85.42, 55.9, 63.6, 55.2, 77.1 };string[] xValues = { "France", "Canada", "Germany", "USA", "Italy", "Spain", "Russia", "Sweden", "Japan" };//Seris2 double[] y2 = { 45.62, 65.54, 70.45, 84.73, 35.42, 55.9, 63.6 };double[] y3 = { 88.62, 35.54, 52.45, 45.73, 88.42, 14.9, 33.6 };this.cht4.Series[0].Points.DataBindXY(xValues, yValues);this.cht4.Series[1].Points.DataBindY(y2);this.cht4.Series[2].Points.DataBindY(y3);//设置X轴显示间隔为1,X轴数据比较多的时候比较有用 cht4.ChartAreas[0].AxisX.LabelStyle.Interval = 1;//设置XY轴标题的名称所在位置位远 cht4.ChartAreas[0].AxisX.TitleAlignment = StringAlignment.Near;for (int i = 0; i < cht4.Series[2].Points.Count; i++){cht4.Series[2].Points[i].MarkerStyle = MarkerStyle.Circle;//设置折点的风格 cht4.Series[2].Points[i].MarkerColor = Color.Red;//设置seires中折点的颜色 // cht4.Series[1].Points[i].MarkerStyle = MarkerStyle.Square;//设置折点的风格 // cht4.Series[1].Points[i].MarkerColor = Color.Blue;//设置seires中折点的颜色 // cht4.Series[2].Points[i].MarkerStyle = MarkerStyle.Square;//设置折点的风格 // cht4.Series[2].Points[i].MarkerColor = Color.Green;//设置seires中折点的颜色 }for (int i = 0; i < cht4.Series.Count; i++){for (int j = 0; j < cht4.Series[i].Points.Count; j++){cht4.Series[i].Points[j].Label = " ";//cht4.Series[i].Points[j].LabelToolTip = "string.Empty";}}//cht4.ImageType = ChartImageType.Jpeg;//反锯齿 cht4.AntiAliasing = AntiAliasingStyles.All;//调色板 磨沙:SemiTransparent cht4.Palette = ChartColorPalette.BrightPastel;cht4.Series[0].ChartType = SeriesChartType.Radar;cht4.Series[1].ChartType = SeriesChartType.Radar;cht4.Series[2].ChartType = SeriesChartType.Radar;cht4.Width = 500;cht4.Height = 350;#endregion/* #VALX 显示当前图例的X轴的对应文本(或数据) #VAL, #VALY, 显示当前图例的Y轴的对应文本(或数据) #VALY2, #VALY3, 显示当前图例的辅助Y轴的对应文本(或数据) #SER: 显示当前图例的名称 #LABEL 显示当前图例的标签文本 #INDEX 显示当前图例的索引 #PERCENT 显示当前图例的所占的百分比 #TOTAL 总数量 #LEGENDTEXT 图例文本 */ }
}
这篇关于关于微软C#中的CHART图表控件的简单使用的文章就介绍到这儿,希望我们推荐的文章对编程师们有所帮助!


