本文主要是介绍windbg - Getting Started with WinDBG - Part3,希望对大家解决编程问题提供一定的参考价值,需要的开发者们随着小编来一起学习吧!
In this series of blog posts we’ve walked you through getting WinDBG installed, setup, and got you started by attaching to a process and setting breakpoints. Our next step is the actual debugging part where we’re stepping through a program and looking at memory.
- Part 1 - Installation, Interface, Symbols, Remote/Local Debugging, Help, Modules, and Registers
- Part 2 - Breakpoints
- Part 3 - Inspecting Memory, Stepping Through Programs, and General Tips and Tricks
Stepping
Really the whole reason you’re using a debugger is to inspect the state of a process during a specific operation or function. Just about every instruction that gets executed alters the program state in some way which means having the ability to execute an instruction then inspect the state is extremely important. The first part of this is “stepping” - executing instructions then pausing. WinDBG offers a number of different stepping commands depending on where you are in the program and where you want to go.
Most debuggers use the following terms that describe how you can navigate through a program and its functions:
- Step-Into - When the instruction is a call, follow the call and pause at the first instruction in the called function.
- Step-Over - When the instruction is a call, execute the function and all subfunctions, pausing at the instruction in the current function after the call.
- Step-Out - Execute all instructions and pause after the current function is complete (ret at the end of the current function)
A note to make here is that both Step-Into and Step-Over will execute a single instruction and pause - behavior only changes when a call instruction is reached.
Go
The g (Go) command is more of a breakpoint command but its functionality blurs the lines between breakpoints and stepping commands. It’s used to resume execution of program but unlike most of the stepping commands, it not really meant to be used on an instruction by instruction basis. g will resume the program until a breakpoint or exception occurs. Really, you would use g to execute all of the instructions up to a breakpoint, whereas with stepping commands you’re executing instructions without setting a breakpoint. However, to clarify, debuggers will pause when hitting a breakpoint regardless if you use a stepping command or something like g.
g is straightforward to use:
0:001> gWhile the program is running, WinDBG will give you a message in the command input box:

If you know the address you’d like to execute until then just provide it as an argument to g:
0:001> g notepad!WinMainCRTStartupStep Stepping
Executing a single instruction, then pausing is called Single Stepping. This can be achieved by either using the “Step-Into” or “Step-Over” commands since both behave the same on non-call instructions. Rather then show them both here, let’s look at these commands individually.
Step-Into
0:001> t To Step-Into with WinDBG, use the t (Trace) command. Each step will show you the state of the registers and the instructions that will be executed. In this example we’ll pause at the program’s entry point (notepad!WinMainCRTStartup) and look at the first few instructions to be executed (u eip). The first instruction is a call to the notepad!__security_init_cookie function. Let’s see how debugger behaves when Stepping-Into with t:
0:000> u eip
notepad!WinMainCRTStartup:
006a3689 e8c5f9ffff      call    notepad!__security_init_cookie (006a3053)
006a368e 6a58            push    58h
006a3690 68a0376a00      push    offset notepad!GetFileVersionInfoSizeExW+0x2c (006a37a0)
006a3695 e872040000      call    notepad!_SEH_prolog4 (006a3b0c)
006a369a 33db            xor     ebx,ebx
006a369c 895de4          mov     dword ptr [ebp-1Ch],ebx
006a369f 895dfc          mov     dword ptr [ebp-4],ebx
006a36a2 8d4598          lea     eax,[ebp-68h]
0:000> t
eax=77143c33 ebx=7ffd5000 ecx=00000000 edx=006a3689 esi=00000000 edi=00000000
eip=006a3053 esp=000eff60 ebp=000eff6c iopl=0         nv up ei pl zr na pe nc
cs=001b  ss=0023  ds=0023  es=0023  fs=003b  gs=0000             efl=00000246
notepad!__security_init_cookie:
006a3053 8bff            mov     edi,edi
Here we can see that we were running within notepad!WinMainCRTStartup, then on the call we used t to follow the call into the notepad!__security_init_cookie function, where we paused on the first instruction.
Step-Over
0:001> p WinDBG uses the p command to step over a function call. This means that the call and all subinstructions within the called function will be executed and the program will pause on the next instruction within the current function (e.g. notepad!WinMainCRTStartup). Let’s look at the same scenario, but this time we’ll use p:
0:000> p
eax=77143c33 ebx=7ffd5000 ecx=00000000 edx=006a3689 esi=00000000 edi=00000000
eip=006a3055 esp=000eff60 ebp=000eff6c iopl=0         nv up ei pl zr na pe nc
cs=001b  ss=0023  ds=0023  es=0023  fs=003b  gs=0000             efl=00000246
notepad!__security_init_cookie+0x2:
006a3055 55              push    ebp
Here we can see that the instruction after the call to notepad!__security_init_cookie is push 58h. When we Step-Over with p we automatically execute everything within the notepad!__security_init_cookie function, then pause at the push after it.
Step-Out
0:001> gu Stepping-Out with WinDBG can be achieved with the gu (Go Up) command. This command scans the current function for a ret then pauses after it gets executed. This an important behavior, because if, for whatever reason, the function doesn’t end in a ret or a code path doesn’t lead to one, you could experience unexpected results with gu. Let’s see what it looks like:
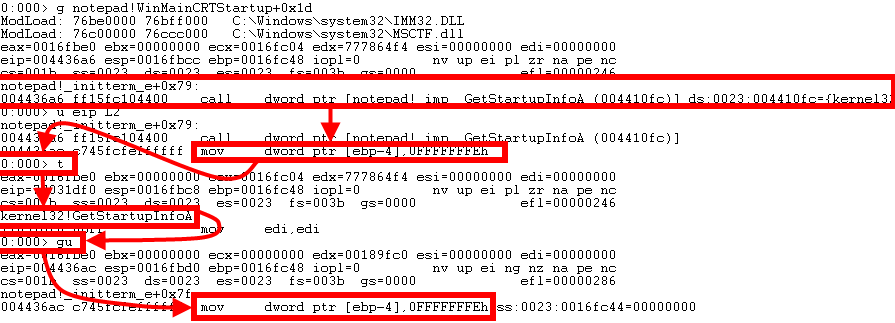
Here we’ve paused on notepad!WinMainCRTStartup+0x1d which is a call to notepad!_imp__GetStartupInfoA. We can see (u eip L2) that the instruction after the call is mov dword ptr [ebp-4],0FFFFFFFEh. So we’ll single step (t) into the function and pause at the first instruction. Now we use gu to execute all instructions and function calls in our child function then pause on the next instruction in the parent function, which is our mov dword ptr [ebp-4],0FFFFFFFEh.
Executing until Return
gu is good and all, but sometimes you want to look at the stack right before the function returns, in this scenario, you’ll need to use either tt (Trace to Next Return) or pt. Both are easy to call:
0:001> tt 0:001> pt The important thing here to remember is that tt will stop at the next return, even if its not in the current function. For instance, consider the following pseudocode, our goal is to pause on the ret in func:
func:
call somefunc
retsomefunc:
call someotherfunc
retsomeotherfunc:
ret
In this example, if pause at call somefunc, then use tt, we’ll end up pausing at the ret in someotherfunc.
A better approach for this scenario might be to use pt: Using the same pseudocode, if we pause at call somefunc, then use pt, we’d execute all the code in somefunc (and subsequently someotherfunc), then pause at the ret in func. In all reality for this example we could just use p, but that doesn’t illustrate the point :)
Ultimately it depends on what you, as the person using the debugger, want to do.
Inspecting Memory
Now we can finally get into the most important part of debugging: Inspecting Memory. WinDBG provides the d (Display Memory) command for this purpose. In its most simple form you can run it like this:
0:001> dBut this is more or less useless. Running d by itself for the first time will output the memory where eip points to. This is useless because eip should be pointing to a code segment and, to make sense of that, you’d really need to use the u (Unassemble) command. So a much better starting out command would be:
0:001> d espThis will show us the values on the stack. With d, WinDBG will display data using the format specified by the last d command executed. If this is you’re first time running d, it doesn’t have previous command stored, so WinDBG will give you the output of the db (Display Byte) command.
Display Bytes
db will output the data in bytes and provide the corresponding ASCII values:
0:000> db
006a3155  11 23 00 00 ff b5 64 ff-ff ff 89 1d 04 c2 6a 00  .#....d.......j.
006a3165  68 10 2e 6a 00 ff b5 58-ff ff ff e8 e6 03 00 00  h..j...X........
006a3175  ff b5 68 ff ff ff a3 08-c2 6a 00 68 f4 2d 6a 00  ..h......j.h.-j.
006a3185  ff b5 58 ff ff ff e8 cb-03 00 00 ff b5 6c ff ff  ..X..........l..
006a3195  ff a3 0c c2 6a 00 68 e0-2d 6a 00 ff b5 58 ff ff  ....j.h.-j...X..
006a31a5  ff e8 b0 03 00 00 a3 10-c2 6a 00 0f b6 85 70 ff  .........j....p.
006a31b5  ff ff 50 68 cc 2d 6a 00-ff b5 58 ff ff ff e8 93  ..Ph.-j...X.....
006a31c5  03 00 00 a2 14 c2 6a 00-0f b6 85 71 ff ff ff 50  ......j....q...P
Display Words
Words, or 2 byte values, can be shown with dw (Display Word). Alternatively, you can use dW to show Words and ASCII values:
0:000> dw
006a31d5  b468 6a2d ff00 58b5 ffff e8ff 0376 0000
006a31e5  15a2 6ac2 0f00 85b6 ff72 ffff 6850 2d9c
006a31f5  006a b5ff ff58 ffff 59e8 0003 a200 c216
006a3205  006a b60f 7385 ffff 50ff 8868 6a2d ff00
006a3215  58b5 ffff e8ff 033c 0000 17a2 6ac2 0f00
006a3225  85b6 ff74 ffff 6850 2d68 006a b5ff ff58
006a3235  ffff 1fe8 0003 a200 c218 006a b60f 7585
006a3245  ffff 50ff 4868 6a2d ff00 58b5 ffff e8ff
Display DWORDS
My favorite memory viewing command is dd (Display DWORDs). A DWORD is a double word, so 4 bytes. dd will just show you the DWORDS while dc will show DWORDs and ASCII values:
0:000> dd
006a3255  00000302 6ac219a2 85b60f00 ffffff76
006a3265  2d346850 b5ff006a ffffff58 0002e5e8
006a3275  c21aa200 b60f006a ffff7785 106850ff
006a3285  ff006a2d ffff58b5 02c8e8ff 1ba20000
006a3295  8d006ac2 ffff5485 535750ff 6a34e868
006a32a5  00026800 d6ff8000 6a2cf8bf 2ce0be00
006a32b5  c085006a 206a3775 50b8458d 6a353868
006a32c5  b5ff5700 ffffff54 0002dee8 56646a00
Display Quadwords
To display quadwords (4 words/8 bytes) within WinDBG, use dq:
0:000> dq
006a32d5  7be8ffff`ff54b5ff ffff54b5`ff000002
006a32e5  ffffffff`508589ff 68206a00`6a100815
006a32f5  50b8458d`006ac21c e8ffffff`58b5ff57
006a3305  ff50b5ff`000002a7 ffff58b5`ff56ffff
006a3315  68530000`0240e8ff ff58b5ff`006a2f70
006a3325  e8006ac0`04a3ffff 2f5c6853`0000022a
006a3335  ffffff58`b5ff006a 0214e800`6ac034a3
006a3345  006a34b8`68530000 2ca3ffff`ff58b5ff
Display Bits
You can even show binary with dyb:
0:000> dyb76543210 76543210 76543210 76543210-------- -------- -------- --------
006a3355  11000000 01101010 00000000 11101000  c0 6a 00 e8
006a3359  11111110 00000001 00000000 00000000  fe 01 00 00
006a335d  01101010 00101000 10100011 01100000  6a 28 a3 60
006a3361  11000000 01101010 00000000 10111000  c0 6a 00 b8
006a3365  01000000 11000111 01101010 00000000  40 c7 6a 00
006a3369  01010000 01010000 01101000 01001000  50 50 68 48
006a336d  00101111 01101010 00000000 11111111  2f 6a 00 ff
006a3371  10110101 01011000 11111111 11111111  b5 58 ff ff
da esp
Strings are displayed with da, essentially WinDBG will print everything as ASCII until it reaches a null byte. So here, even though esp isn’t a string, it’ll treat everything as a string until it reaches a null. Just to further illustrate this, I’ve printed out the 5 bytes at esp with db esp L5:
0:000> da esp
000eff60  ".6j"
Addressing
So far we’ve just been looking at the memory that esp is pointing to by using esp as the parameter to our memory inspection comman however there are a number of different ways to reference memory that can be useful when starting out.
Registers - As we’ve seen, you can use any register and WinDBG will use the address in that register as the memory address:
0:001> dd eaxMemory Address - You can also just use the memory address itself by providing it:
0:001> db 0020faa0 Offsets - You can also use offsets with registers or memory addresses by using mathematical expressions:
0:001> db 0020faa0 + 18
0:001> dd ebp - 18
0:001> dq ebp*eax
These expressions can be used wherever an address can be used. Here’s what it looks like in WinDBG:
0:000> db 000eff6c + 18
000eff84  00 50 fd 7f 00 00 00 00-00 00 00 00 00 00 00 00  .P..............
000eff94  78 ff 0e 00 00 00 00 00-ff ff ff ff ed e0 3b 77  x.............;w
000effa4  42 0e 93 01 00 00 00 00-c4 ff 0e 00 c8 37 40 77  B............7@w
000effb4  89 36 6a 00 00 50 fd 7f-00 00 00 00 00 00 00 00  .6j..P..........
000effc4  00 00 00 00 00 00 00 00-89 36 6a 00 00 50 fd 7f  .........6j..P..
000effd4  00 00 00 00 00 00 00 00-00 00 00 00 00 00 00 00  ................
000effe4  00 00 00 00 00 00 00 00-00 00 00 00 00 00 00 00  ................
000efff4  00 00 00 00 00 00 00 00-00 00 00 00 20 00 00 00  ............ ...
0:000> db ebp + 18
000eff84  00 50 fd 7f 00 00 00 00-00 00 00 00 00 00 00 00  .P..............
000eff94  78 ff 0e 00 00 00 00 00-ff ff ff ff ed e0 3b 77  x.............;w
000effa4  42 0e 93 01 00 00 00 00-c4 ff 0e 00 c8 37 40 77  B............7@w
000effb4  89 36 6a 00 00 50 fd 7f-00 00 00 00 00 00 00 00  .6j..P..........
000effc4  00 00 00 00 00 00 00 00-89 36 6a 00 00 50 fd 7f  .........6j..P..
000effd4  00 00 00 00 00 00 00 00-00 00 00 00 00 00 00 00  ................
000effe4  00 00 00 00 00 00 00 00-00 00 00 00 00 00 00 00  ................
000efff4  00 00 00 00 00 00 00 00-00 00 00 00 20 00 00 00  ............ ...
WinDBG will output question marks (?) for invalid/free memory.
Pointers
There are often times where a value on the stack is just a pointer to another location. If you’d like to look at that value you’d need to do two look ups. For instance, say we know that value ebp+4 is a pointer to some assembly code that we want to read. To view that assembly, we’d need two commands. The first command shows us the memory address at ebp+4:
0:001> dd ebp+4Then the second requires us to manually copy the value at that address then paste it in as an argument to the u command so we can view that assembly:
0:001> u 777be2d10:000> dd ebp+4
000eff70 774037f5 7ffd5000 76a2e396 00000000
000eff80 00000000 7ffd5000 00000000 00000000
000eff90 00000000 000eff78 00000000 ffffffff
000effa0 773be0ed 01930e42 00000000 000effc4
000effb0 774037c8 006a3689 7ffd5000 00000000
000effc0 00000000 00000000 00000000 006a3689
000effd0 7ffd5000 00000000 00000000 00000000
000effe0 00000000 00000000 00000000 00000000
This is all fine, but there’s an easier way with the poi() function. Using poi() we just provide ebp+4 as its parameter and it will automatically take the value at that address and use it, rather then just using the value of ebp+4:
0:000> u poi(ebp+4)
ntdll!__RtlUserThreadStart+0x70:
774037f5 c745fcfeffffff  mov     dword ptr [ebp-4],0FFFFFFFEh
774037fc e850f4feff      call    ntdll!_SEH_epilog4 (773f2c51)
77403801 c20800          ret     8
77403804 e8dd51ffff      call    ntdll!LdrpImageHasTls (773f89e6)
77403809 85c0            test    eax,eax
7740380b 0f85a714fbff    jne     ntdll!LdrpInitializeThread+0x186 (773b4cb8)
77403811 c745fcfeffffff  mov     dword ptr [ebp-4],0FFFFFFFEh
77403818 e8bf000000      call    ntdll!LdrpInitializeThread+0x1eb (774038dc)
Limiting output
By default WinDBG will output a set amount of data, however we can limit how of that data is outputted with the L (Size Range Specifier) attribute. L will work with most commands and just needs to be appended to the end with a value:
0:001> dd esp L1The number specified with L is the size, which is related to the command executed. For instance, with db, L will mean the number of bytes to print, while with dd, L will mean the number of DWORDS.
0:000> db esp L1
000eff60  8e                                               .
0:000> db esp L10
000eff60  8e 36 6a 00 45 3c 14 77-00 50 fd 7f ac ff 0e 00  .6j.E<.w.P......
That’s really it to get you off the ground inspecting memory - I know, three blog posts building up to this functionality, and its just this tiny little section? Yup - there are some more memory inspection commands, but to get started, d is the core command. Check out the tips below for more info.
Tips and Tricks
Now that you’re off the ground, lets look at some handy tricks and tips that can make your debugging experience much better.
Keyboard Shortcuts
Chances are you’ll be starting and stopping an application hundreds of times while you’re debugging so any little shortcut can solve you tons of time in the long run. Keyboard shortcuts are huge, here are the four I use the most:
- F6 - Attach to a process. With the Attach Window open, use the “End” key to drop down to the bottom (where newly launched applications are).
- CTRL + E - Open Executable
- CTRL + Break - “Break” into a running application - used to pause a running program
- F5 - Shortcut for g
Converting Formats
If you haven’t figured this out already, WinDBG prints numbers in hex by default. That means 12 isn’t the same as decimal 12. One quick tip is the .formats command. To use it is straightforward:
0:001> .formats valueWhere value is something you want to convert. So .formats will take whatever you provide and output it in a variety of formats:
0:000> .formats 12
Evaluate expression:Hex:     00000012Decimal: 18Octal:   00000000022Binary:  00000000 00000000 00000000 00010010Chars:   ....Time:    Wed Dec 31 16:00:18 1969Float:   low 2.52234e-044 high 0Double:  8.89318e-323
Now we know 12 is actually 18 :). However, you can also provide decimal values using the 0n specifier:
0:000> .formats 0n12
Evaluate expression:Hex:     0000000cDecimal: 12Octal:   00000000014Binary:  00000000 00000000 00000000 00001100Chars:   ....Time:    Wed Dec 31 16:00:12 1969Float:   low 1.68156e-044 high 0Double:  5.92879e-323
Math
There may be times where you need to calculate an offset or just do some basic math. WinDBG will evaluate expressions with the ? command:
0:001> ?1+1These expressions can be as simple or as complicated as you’d like can contain all of the standard addressing that WinDBG uses:
0:000> ?1+2
Evaluate expression: 3 = 00000003
Extensions
To make life easier, there are a number of extensions that people have created for WinDBG. These are great little tools that can be used within the debugger to provide functionality. Some are even built by Microsoft. The useful ones are !heap, !address, !dh, and !peb. I’ll cover these and more in another blog post - So stay tuned!
Cheat Sheets
There are a couple of really nice WinDBG command references, cheat sheets, and tutorials out there if you don’t like .hh, here are a couple good ones:
- http://windbg.info/doc/1-common-cmds.html
- http://www.codeproject.com/Articles/6084/Windows-Debuggers-Part-1-A-WinDbg-Tutorial
References
http://blog.opensecurityresearch.com/2013/12/getting-started-with-windbg-part-3.html
这篇关于windbg - Getting Started with WinDBG - Part3的文章就介绍到这儿,希望我们推荐的文章对编程师们有所帮助!