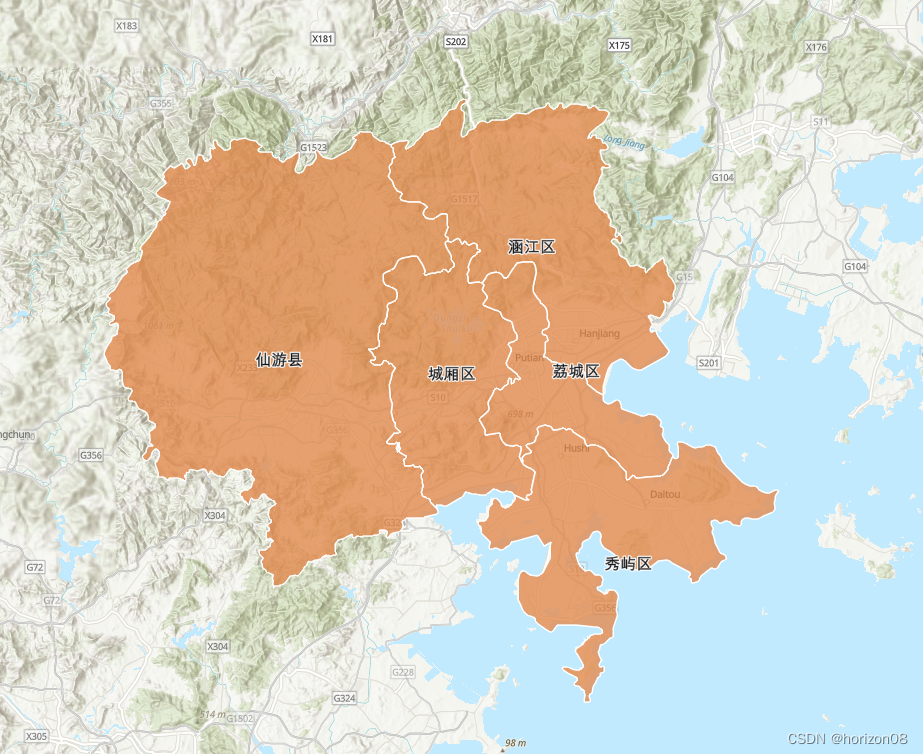
本文主要是介绍【ArcGIS For JS】前端geojson渲染行政区划图层并加标签,希望对大家解决编程问题提供一定的参考价值,需要的开发者们随着小编来一起学习吧!
原理
通过DataV工具 生成行政区的geojson(得到各区的面元素数据), 随后使用手动绘制featureLayer与Label,并加载到地图。
//vue3加载geojson数据public/geojson/pt.json,在MapView渲染上加载geojson数据 type是"MultiPolygon"fetch(baseUrl+'/geojson/pt.json').then(response => response.json()).then(data => {console.log(data)// debuggerlet graphics = data.features.map((feature) => {//Polygon 单个多边形绘制let geometry = {type: 'polygon',rings: feature.geometry.coordinates[0]}return new Graphic({geometry: geometry,attributes: feature.properties})})let featureLayer = new FeatureLayer({fields: [{name: 'ObjectID',alias: 'ObjectID',type: 'oid'},{name: 'name',alias: 'name',type: 'string'},{name: 'adcode',alias: 'adcode',type: 'integer'}],objectIdField: 'ObjectID',geometryType: 'polygon',spatialReference: {wkid: 4326},source: graphics,renderer: {type: 'simple',symbol: {type: 'simple-fill',color: [227, 139, 79, 0.8],outline: {color: [255, 255, 255],width: 1}}},labelingInfo: [{labelExpressionInfo: {expression: '$feature.name'},symbol: {type: 'text',color: [0, 0, 0, 1],haloColor: [255, 255, 255, 1],haloSize: 1,font: {size: 12}}}]})//地图加载featureLayerview.map.layers.add(featureLayer)})})源码地址
https://github.com/Billyas/AQICalculator-nuxt3
演示站点
https://billyas.github.io/arcgis-vue3-demo/
效果

这篇关于【ArcGIS For JS】前端geojson渲染行政区划图层并加标签的文章就介绍到这儿,希望我们推荐的文章对编程师们有所帮助!


