promethus专题
监控 Promethus的监控告警Alertmanager、Grafana
Promethus的监控告警Alertmanager Alertmanager 介绍 Prometheus的一个组件,用于定义和发送告警通知,内置多种第三方告警通知方式,同时还提供了对Webhook通知的支持基于警报规则对规则产生的警报进行分组、抑制和路由,并把告警发送给合适的接收端,例如邮件、钉钉或Webhook在Prometheus中一条告警规则组成 告警名称:用户需要为告警规则命名告警规

promethus 的 relabel_configs 和 metric_relabel_configs
很多童鞋在群里面反馈 relabel_configs 和 metric_relabel_configs 两个配置使用区别。都是relabel 譬如relabel_configs的relabel如下: - source_labels: [__meta_kubernetes_pod_annotation_prometheus_io_scrape]separator: ;regex: "true

promethus的安装使用
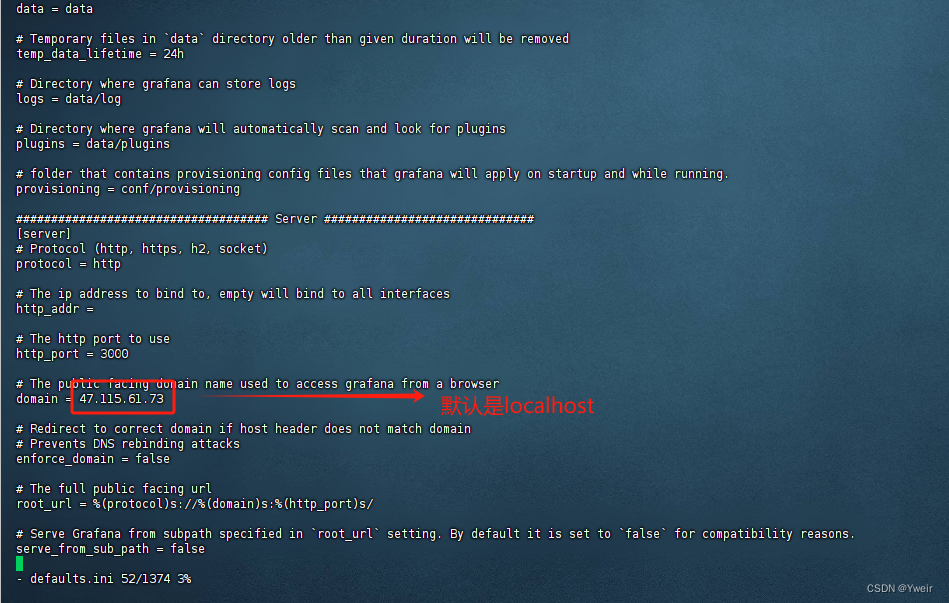
1、# 软件下载地址 https://prometheus.io/download/ https://grafana.com/grafana/download https://prometheus.io/download/ Prometheus是一套开源的监控&报警&时间序列数据库的组合,起始是由SoundCloud公司开发的。 Prometheus 的优点 1、非常少的外部依赖,安装使用超简单
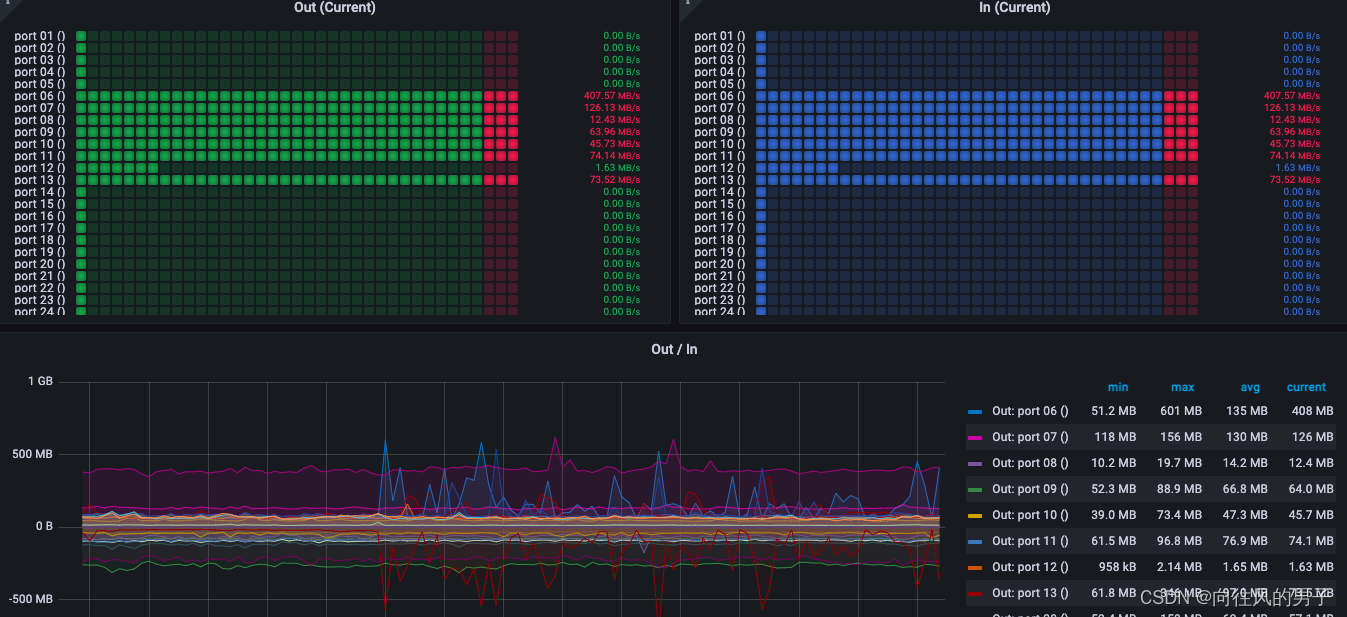
【sw网络监控】通过snmp协议相关的snmp-exporter(收集交换机网络监控数据)+ promethus + grafana
本站以分享各种运维经验和运维所需要的技能为主 《python零基础入门》:python零基础入门学习 《python运维脚本》: python运维脚本实践 《shell》:shell学习 《terraform》持续更新中:terraform_Aws学习零基础入门到最佳实战 《k8》暂未更新 《docker学习》暂未更新 《ceph学习》ceph日常问题解决分享 《日志收集》ELK+各种中间件