histplot专题
python统计分析——直方图(sns.histplot)
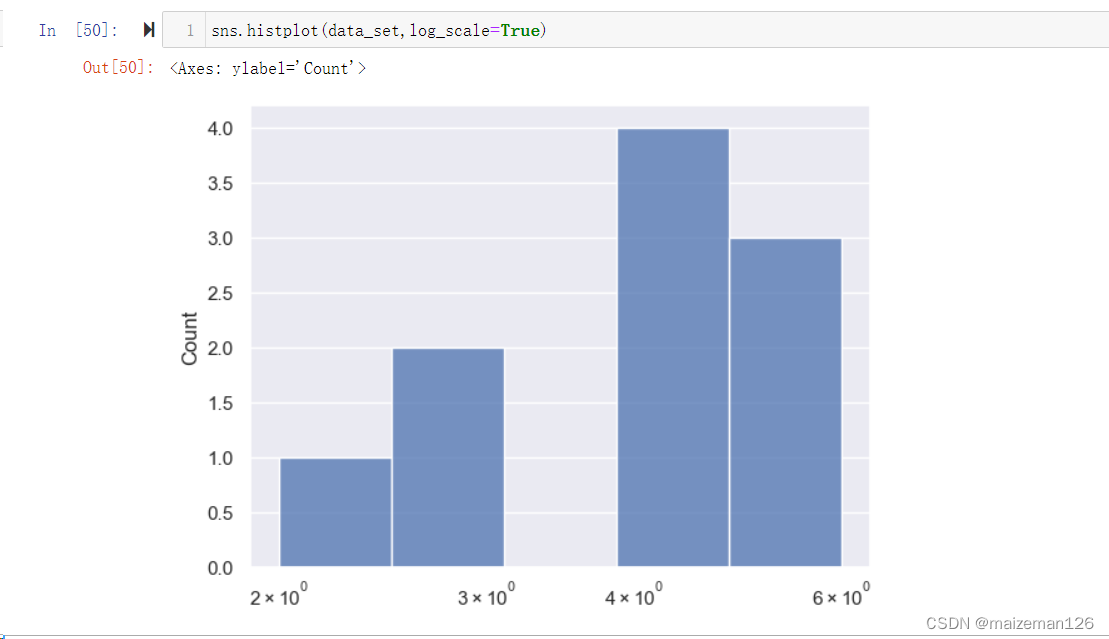
使用seanborn.histplot()函数绘制直方图 from matplotlib.pyplot as pltimport seaborn as snsdata_set=np.array([2,3,3,4,4,4,4,5,5,6])plt.hist(fish_data) (1)data=None, 表示数据源。(2)x=None, 表示直方图的分布垂直与x轴。单位序列型数据时