本文主要是介绍UIBezierPath 画折线图,希望对大家解决编程问题提供一定的参考价值,需要的开发者们随着小编来一起学习吧!
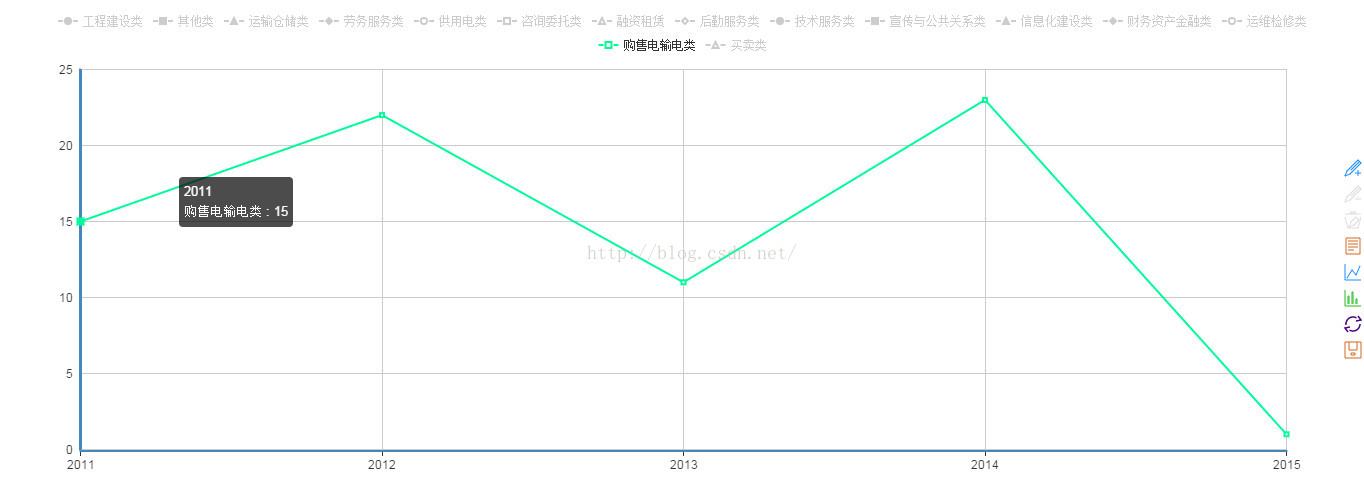
效果图

实现
原理很简单,直接发代码
//创建数据NSMutableArray * dataArray = [[NSMutableArray alloc]init];for (int i=0; i<10; i++) {int a = arc4random()%150;[dataArray addObject:[NSNumber numberWithInt:a]];}//创建坐标轴CGFloat XAxisWidth = Device_Width - FIT_WIDTH(23)*2; // X宽度CGFloat YAxisHeight = FIT_HEIGHT(150); // Y高度CGPoint axisOriginPoint = CGPointMake(FIT_WIDTH(23), FIT_HEIGHT(350)); // 起始点坐标//创建路径UIBezierPath * bezierPath = [[UIBezierPath alloc]init];[bezierPath moveToPoint:CGPointMake(FIT_WIDTH(23), axisOriginPoint.y - YAxisHeight)];[bezierPath addLineToPoint:CGPointMake(FIT_WIDTH(23), axisOriginPoint.y)];[bezierPath addLineToPoint:CGPointMake(FIT_WIDTH(23) + XAxisWidth, axisOriginPoint.y)];//画坐标轴CAShapeLayer * XAxisShapeLayer = [[CAShapeLayer alloc]init];XAxisShapeLayer.path = bezierPath.CGPath;XAxisShapeLayer.lineWidth = 2;XAxisShapeLayer.lineJoin = kCALineJoinRound;XAxisShapeLayer.strokeColor = [UIColor lightGrayColor].CGColor;XAxisShapeLayer.fillColor = nil;[self.layer addSublayer:XAxisShapeLayer];[bezierPath removeAllPoints];//创建折线点for (int i=0; i<dataArray.count; i++) {//X坐标文字CATextLayer * textLayer = [[CATextLayer alloc]init];textLayer.string = [NSString stringWithFormat:@"%d",i];textLayer.fontSize = FIT_HEIGHT(11);textLayer.foregroundColor = [UIColor lightGrayColor].CGColor;textLayer.frame = CGRectMake(FIT_WIDTH(23)+XAxisWidth/dataArray.count * i, axisOriginPoint.y +FIT_HEIGHT(5), XAxisWidth/dataArray.count, FIT_HEIGHT(11));textLayer.alignmentMode = kCAAlignmentLeft;textLayer.contentsScale = [UIScreen mainScreen].scale; // 以屏幕适配文字,避免拉伸或者模糊[self.layer addSublayer:textLayer];//x坐标标志UIBezierPath * bezierPath = [[UIBezierPath alloc]init];[bezierPath moveToPoint:CGPointMake(FIT_HEIGHT(23) + XAxisWidth/dataArray.count * i, axisOriginPoint.y)];[bezierPath addLineToPoint:CGPointMake(FIT_HEIGHT(23) + XAxisWidth/dataArray.count * i, axisOriginPoint.y - FIT_HEIGHT(3))];CAShapeLayer * shapeLayerX = [[CAShapeLayer alloc]init];shapeLayerX.path = bezierPath.CGPath;shapeLayerX.lineWidth = 1;shapeLayerX.strokeColor = [UIColor lightGrayColor].CGColor;shapeLayerX.fillColor = nil;[self.layer addSublayer:shapeLayerX];[bezierPath removeAllPoints];//y坐标标志bezierPath = [[UIBezierPath alloc]init];[bezierPath moveToPoint:CGPointMake(FIT_HEIGHT(23) + XAxisWidth/dataArray.count * i, axisOriginPoint.y)];[bezierPath addLineToPoint:CGPointMake(FIT_HEIGHT(23) + XAxisWidth/dataArray.count * i, axisOriginPoint.y - FIT_HEIGHT(3))];CAShapeLayer * shapeLayerY = [[CAShapeLayer alloc]init];shapeLayerY.path = bezierPath.CGPath;shapeLayerY.lineWidth = 1;shapeLayerY.strokeColor = [UIColor lightGrayColor].CGColor;shapeLayerY.fillColor = nil;[self.layer addSublayer:shapeLayerY];[bezierPath removeAllPoints];}//创建数据折线UIBezierPath * brokenBezierPath = [[UIBezierPath alloc]init];CAShapeLayer * brokenShaperLayer = [[CAShapeLayer alloc]init];for (int i=0; i<dataArray.count; i++) {CGFloat height = axisOriginPoint.y - [dataArray[i] floatValue] ;if (i == 0) {[brokenBezierPath moveToPoint:CGPointMake(FIT_WIDTH(23), height)];}else[brokenBezierPath addLineToPoint:CGPointMake(FIT_WIDTH(23) + XAxisWidth/dataArray.count * i , height)];}brokenShaperLayer.path = brokenBezierPath.CGPath;brokenShaperLayer.lineWidth = 2;brokenShaperLayer.strokeColor = Color_248.CGColor;brokenShaperLayer.fillColor = nil;brokenShaperLayer.lineJoin = kCALineJoinRound;[self.layer addSublayer:brokenShaperLayer];/*•速度控制函数(CAMediaTimingFunction)1.kCAMediaTimingFunctionLinear(线性):匀速,给你一个相对静态的感觉2.kCAMediaTimingFunctionEaseIn(渐进):动画缓慢进入,然后加速离开3.kCAMediaTimingFunctionEaseOut(渐出):动画全速进入,然后减速的到达目的地4.kCAMediaTimingFunctionEaseInEaseOut(渐进渐出):动画缓慢的进入,中间加速,然后减速的到达目的地。这个是默认的动画行为。*///通过 strokeEnd 添加简单的动画效果CABasicAnimation * brokenAnimation = [CABasicAnimation animationWithKeyPath:@"strokeEnd"];brokenAnimation.fromValue = @0;brokenAnimation.toValue = @1;brokenAnimation.duration = 2;brokenAnimation.timingFunction = [CAMediaTimingFunction functionWithName:kCAMediaTimingFunctionEaseOut];[brokenShaperLayer addAnimation:brokenAnimation forKey:@"brokenAnimation"];/*几种动画方式transform.scale 比例转化 @(0.8)transform.scale.x 宽的比例 @(0.8)transform.scale.y 高的比例 @(0.8)transform.rotation.x 围绕x轴旋转 @(M_PI)transform.rotation.y 围绕y轴旋转 @(M_PI)transform.rotation.z 围绕z轴旋转 @(M_PI)cornerRadius 圆角的设置 @(50)backgroundColor 背景颜色的变化 (id)[UIColor purpleColor].CGColorbounds 大小,中心不变 [NSValue valueWithCGRect:CGRectMake(0, 0, 200, 200)];position 位置(中心点的改变) [NSValue valueWithCGPoint:CGPointMake(300, 300)];contents 内容,比如UIImageView的图片 imageAnima.toValue = (id)[UIImage imageNamed:@"to"].CGImage;opacity 透明度 @(0.7)contentsRect.size.width 横向拉伸缩放 @(0.4)最好是0~1之间的*/总结
柱状图,饼状图都可以这样实现,原理简单就不贴代码了。
这篇关于UIBezierPath 画折线图的文章就介绍到这儿,希望我们推荐的文章对编程师们有所帮助!