本文主要是介绍poi-tl的使用(通俗易懂,全面,内含动态表格实现 包会!!),希望对大家解决编程问题提供一定的参考价值,需要的开发者们随着小编来一起学习吧!
最近在做项目时候有一个关于解析Html文件,然后将解析的数据转化成word的需求,经过调研,使用poi-tl来实现这个需求,自己学习花费了一些时间,现在将这期间的经验总结起来,让大家可以快速入门
poi-tl的介绍
poi-tl(poi template language)是Word模板引擎,使用模板和数据创建很棒的Word文档。
官网地址:中文文档地址
源码地址:https://github.com/Sayi/poi-tl
poi-tl的快速入门
- 引入依赖
<!--poi-tl-->
<dependency><groupId>com.deepoove</groupId><artifactId>poi-tl</artifactId><version>1.12.0</version>
</dependency>
文本标签(常用)
用法:{{var}}
支持的数据类型:
-
String:文本 -
TextRenderData:有样式的文本 -
HyperlinkTextRenderData:超链接和锚点文本 -
Object:调用 toString() 方法转化为文本
推荐使用工厂 Texts 构建文本模型。
//文本标签@Testpublic void textTest() throws IOException {//解析模板XWPFTemplate template = XWPFTemplate.compile("D://hjl//textTemplate.docx");//封装模型数据HashMap<String, Object> map = new HashMap<>();map.put("text1","我是普通文本");map.put("text2",Texts.of("我是带有样式的文本").color("000000").bold().create());map.put("text3",Texts.of("我是用来处理超链接").link("http://www.baidu.com").create());map.put("text4",Texts.of("我是用来处理锚点文本").anchor("anchor11").create());//渲染数据template.render(map);//以文件形式输出template.writeAndClose(new FileOutputStream("D://hjl//textTemplate1.docx"));}模板:
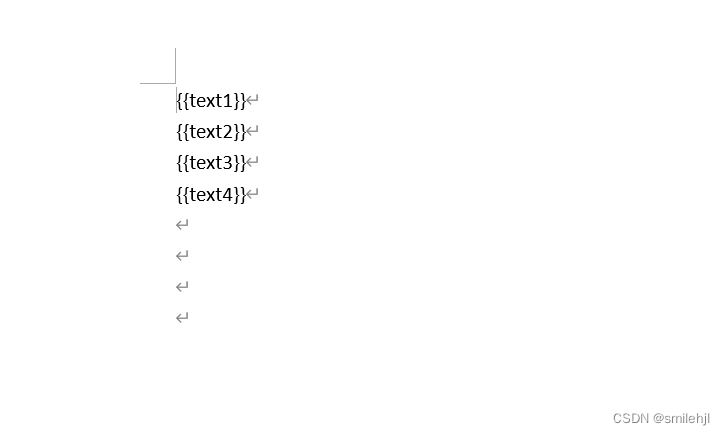
生成的结果:

图像标签(常用)
用法:图片标签以@开始:{{@var}}
数据模型:
-
String:图片url或者本地路径,默认使用图片自身尺寸 -
ByteArrayPictureRenderData -
FilePictureRenderData -
UrlPictureRenderData
推荐使用工厂 Pictures 构建图片模型。
@Test
public void imageTest() throws IOException {//解析模板XWPFTemplate template = XWPFTemplate.compile("D://hjl//imageTemplate.docx");//封装模型数据HashMap<String, Object> map = new HashMap<>();//处理本地图片,大小默认为图大小(以url路径的形式插入)map.put("image1","C:\\Users\\admin\\Desktop\\工作日志\\微信图片_20240407110311.jpg");map.put("svg", "https://img.shields.io/badge/jdk-1.6%2B-orange.svg");// 设置文件图片大小map.put("image2", Pictures.ofLocal("C:\\Users\\admin\\Desktop\\工作日志\\微信图片_20240407110311.jpg").size(120, 120).create());// 图片流(以流的方式插入)map.put("streamImg", Pictures.ofStream(new FileInputStream("C:\\Users\\admin\\Desktop\\工作日志\\微信图片_20240407110311.jpg"), PictureType.JPEG).size(100, 120).create());// 网络图片(注意网络耗时对系统可能的性能影响,根据URL链接加载图片,并根据给定的尺寸进行大小调整,以对象的形式插入)map.put("urlImg", Pictures.ofUrl("http://deepoove.com/images/icecream.png").size(100, 100).create());// 将生成一个bufferImage,以缓冲图像的的形式写入到模板中int width = 200;int height = 200;// 创建一个BufferedImage实例BufferedImage bufferImage = new BufferedImage(width, height, BufferedImage.TYPE_INT_RGB);// 获取Graphics2D对象,并在图像上绘制内容Graphics2D g2d = bufferImage.createGraphics();g2d.setColor(Color.RED); // 设置颜色为红色int[] xPoints = {width/2, 0, width}; // 三角形的x坐标int[] yPoints = {0, height, height}; // 三角形的y坐标g2d.fillPolygon(xPoints, yPoints, 3); // 绘制填充的三角形g2d.dispose();// java图片,我们可以利用Java生成图表插入到word文档中map.put("buffered", Pictures.ofBufferedImage(bufferImage, PictureType.PNG).size(100, 100).create());//渲染数据template.render(map);//以文件形式输出template.writeAndClose(new FileOutputStream("D://hjl//imageTemplate1.docx"));
}
模板:

渲染后的word:

表格标签(常用)
用法:表格标签以#开始:{{#var}}
数据模型:
-
TableRenderData
推荐使用工厂 Tables 、 Rows 和 Cells 构建表格模型。
@Test
public void tableTest() throws IOException {//解析模板XWPFTemplate template = XWPFTemplate.compile("D://hjl//tableTemplate.docx");//封装模型数据HashMap<String, Object> map = new HashMap<>();//1  一个2行2列的表格map.put("table0", Tables.of(new String[][] {new String[] { "00", "01" },new String[] { "10", "11" }}).border(BorderStyle.DEFAULT).create());//2  第0行居中且背景为蓝色的表格RowRenderData row0 = Rows.of("姓名", "学历").textColor("FFFFFF").bgColor("4472C4").center().create();//第一行默认形式ArrayList<String> strings = new ArrayList<>();strings.add("李四");strings.add("博士");RowRenderData row1 = Rows.create("李四", "博士");map.put("table1", Tables.create(row0, row1));//3  合并第1行所有单元格的表格RowRenderData row00 = Rows.of("列0", "列1", "列2").center().bgColor("4472C4").create();RowRenderData row11 = Rows.create("没有数据", null, null);//规定合并单元格规则MergeCellRule rule = MergeCellRule.builder().map(MergeCellRule.Grid.of(1, 0), MergeCellRule.Grid.of(1, 2)).build();map.put("table2", Tables.of(row00, row11).mergeRule(rule).create());//渲染数据template.render(map);//以文件形式输出template.writeAndClose(new FileOutputStream("D://hjl//tableTemplate1.docx"));
}
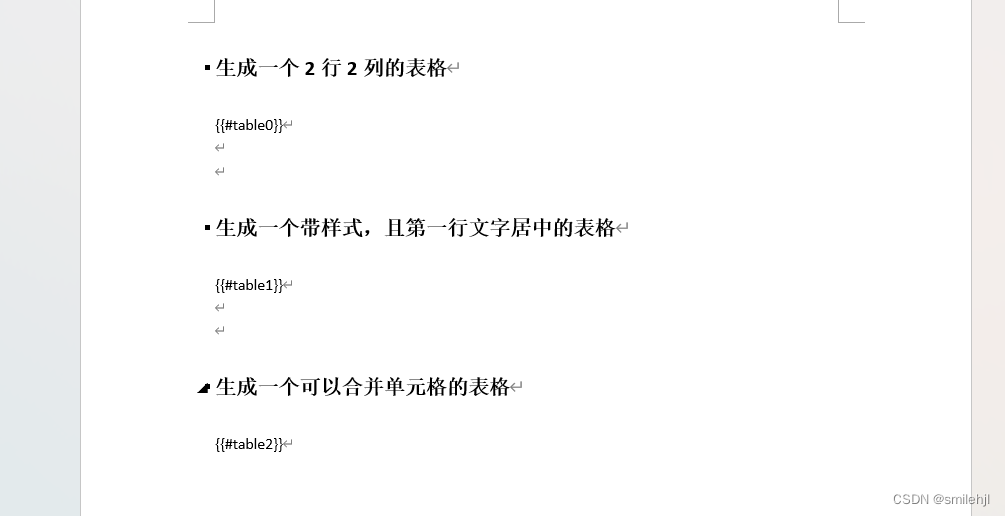
模板:
渲染结果:

列表
用法:列表标签以*开始:{{*var}}
数据模型:
-
List<String> -
NumberingRenderData
推荐使用工厂 Numberings 构建列表模型。


@Test
public void listTest() throws IOException {//解析模板XWPFTemplate template = XWPFTemplate.compile("D://hjl//listTemplate.docx");//封装模型数据HashMap<String, Object> map = new HashMap<>();ArrayList<String> strings = new ArrayList<>();strings.add("text1");strings.add("text2");strings.add("text3");map.put("list1",strings);//列表样式//DECIMAL //1. 2. 3.//DECIMAL_PARENTHESES //1) 2) 3)//BULLET //● ● ●//LOWER_LETTER //a. b. c.//LOWER_ROMAN //i ⅱ ⅲ//UPPER_LETTER //A. B. C.map.put("list2", Numberings.of(NumberingFormat.DECIMAL).addItem("text1").addItem("text2").create());//渲染数据template.render(map);//以文件形式输出template.writeAndClose(new FileOutputStream("D://hjl//listTemplate1.docx"));
}
模板:
结果:
这是word识别有点问题
区块对
用法:区块对由前后两个标签组成,
开始标签以?标识,结束标签以/标识:{{?sections}}{{/sections}}
- 区块对在处理一系列文档元素的时候非常有用,位于区块对中的文档元素可以被渲染零次,一次或N次,这取决于区块对的取值。
- False或空集合
隐藏区块中的所有文档元素
- 非False且不是集合
显示区块中的文档元素,渲染一次
- 非空集合
根据集合的大小,循环渲染区块中的文档元素
简单总结:对于False或空集合,就是不会显示区块对中的数据;对于非False且不是集合,只渲染一次区块对中的模板;对于集合,会根据集合大小,多次渲染
@Test
public void sectionTest() throws IOException {//解析模板XWPFTemplate template = XWPFTemplate.compile("D://hjl//sectionTemplate.docx");//封装模型数据HashMap<String, Object> map = new HashMap<>();//当数据为false,null,集合大小为0时,区块对的内容不展示map.put("section1",false);map.put("section2",null);map.put("section3",new ArrayList());map.put("section4",true);String name = "jack";map.put("section5",name);ArrayList<String> strings = new ArrayList<>();strings.add("a");strings.add("b");strings.add("c");strings.add("d");HashMap<String, Object> stringObjectHashMap = new HashMap<>();stringObjectHashMap.put("value",strings);map.put("section6",stringObjectHashMap);//渲染数据template.render(map);//以文件形式输出template.writeAndClose(new FileOutputStream("D://hjl//sectionTemplate1.docx"));
}
模板:
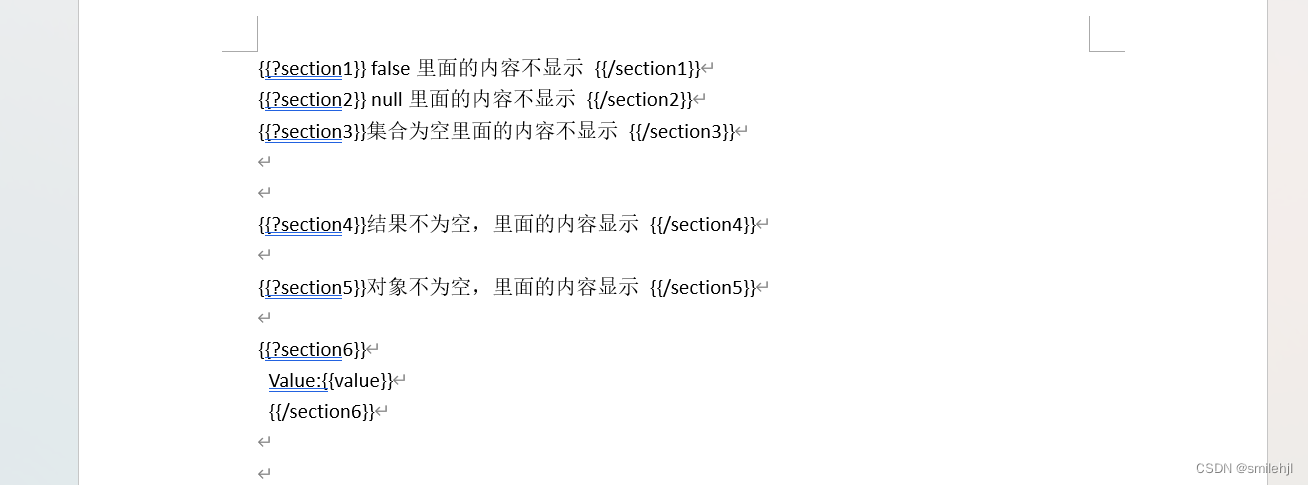
渲染结果
嵌套
用法:嵌套又称为导入、包含或者合并,以+标识:{{+var}}
数据模型:
-
DocxRenderData
推荐使用工厂 Includes 构建嵌套模型。
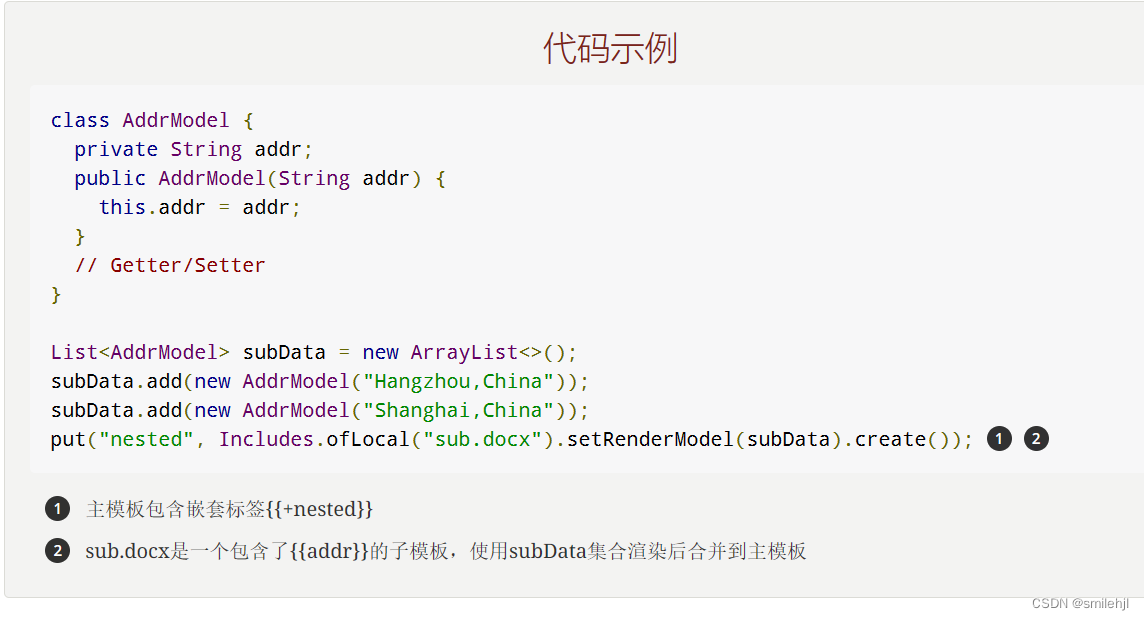
实现:
@Test
public void includeTest() throws IOException {//解析模板XWPFTemplate template = XWPFTemplate.compile("D://hjl//includeTemplate.docx");//封装模型数据HashMap<String, Object> map = new HashMap<>();map.put("mainContent","我是主模板的数据1111");//子模版数据HashMap<String, Object> subMap = new HashMap<>();subMap.put("name","jack");subMap.put("age","18");map.put("nested", Includes.ofLocal("D://hjl//sub.docx").setRenderModel(subMap).create());//渲染数据template.render(map);//以文件形式输出template.writeAndClose(new FileOutputStream("D://hjl//includeTemplate1.docx"));
}
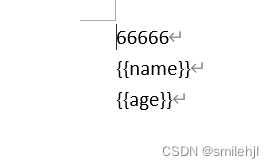
主 模板:

子模版:
结果:

复杂图表
用法:需要事先在模板中加入图标的结构,然后修改可选问题,这样就会替换数据

//使用工厂 Charts 构建图表模型
@Test
public void ChartsTest() throws IOException {//图表渲染出来后,后面具体的样式可以在图标中调整//解析模板XWPFTemplate template = XWPFTemplate.compile("D://hjl//ChartsTemplate.docx");//封装模型数据HashMap<String, Object> map = new HashMap<>();//引用图片// 设置文件图片大小map.put("image", Pictures.ofLocal("C:\\Users\\admin\\Desktop\\工作日志\\微信图片_20240407110311.jpg").size(120, 120).create());//多系列图表条形图(3D条形图)、柱形图(3D柱形图)、面积图(3D面积图)、折线图(3D折线图)、雷达图、散点图等//柱形图ChartMultiSeriesRenderData chart = Charts.ofMultiSeries("医院综合排名", new String[] { "齐鲁医院","泰山医院","第二人民医院","第三医院"}).addSeries("数据质量排名", new Double[] { 70.5,40.6,22.7,85.4}).addSeries("价格质量排名", new Double[] { 80.5,75.6,72.7,85.4}).create();map.put("barChart", chart);//折线图ChartMultiSeriesRenderData qst = Charts.ofMultiSeries("任务趋势", new String[] { "06-10","06-11","06-12","06-13","06-14","06-15"}).addSeries("微信端", new Double[] { 70.5,40.6,22.7,85.4,700.0,40.8}).addSeries("PC端", new Double[] { 80.5,50.6,62.7,45.4,200.0,140.8}).addSeries("小程序端", new Double[] { 120.5,520.6,362.7,405.4,300.0,340.8}).create();map.put("qst", qst);//单系列图表指的是饼图(3D饼图)、圆环图等//饼图ChartSingleSeriesRenderData pie = Charts.ofSingleSeries("国家GDP对比", new String[] { "美国", "中国","日本","韩国" }).series("经济占比", new Integer[] { 50, 35,10,5 }).create();map.put("pieChart", pie);//组合图表指的是由多系列图表(柱形图、折线图、面积图)组合而成的图表。ChartMultiSeriesRenderData comb = Charts.ofComboSeries("MyChart", new String[] { "中文", "English" }).addBarSeries("countries", new Double[] { 15.0, 6.0 }).addBarSeries("speakers", new Double[] { 223.0, 119.0 }).addLineSeries("youngs", new Double[] { 323.0, 89.0 }).addLineSeries("NewLine", new Double[] { 123.0, 59.0 }).create();map.put("combChart", comb);//柱状图、折线图共存ChartMultiSeriesRenderData hntb = Charts.ofComboSeries("某省社会排名", new String[] { "城市1","城市2","城市3","城市4","城市5","城市6"}).addBarSeries("GDP",new Double[] {70.5,40.6,22.7,85.4,700.0,40.8}).addBarSeries("人口",new Double[] {80.5,50.6,62.7,45.4,200.0,140.8}).addLineSeries("指数",new Double[] {0.6,0.3,0.7,0.4,0.1,0.8}).create();map.put("hntb", hntb);//渲染数据template.render(map);//以文件形式输出template.writeAndClose(new FileOutputStream("D://hjl//ChartsTemplate1.docx"));}
模板:

结果:

到这里,poi-tl基本的用法都差不多介绍完了,还有一些没将的可以看官网的文档,里面有更多的细节
动态表格的实现
第一步:写一个类去继承 DynamicTableRenderPolicy 这个类,重写里面的render方法
render()的主要步骤:
- 获取数据
- 插入表格
- 合并表格
public class DynamicTableProxy extends DynamicTableRenderPolicy {//渲染策略制定@Overridepublic void render(XWPFTable xwpfTable, Object tableData) throws Exception {//判断数据是否存在if (null == tableData) {return;}// 类型转化ServerTableData serverTableData = (ServerTableData) tableData;List<RowRenderData> serverDataList = serverTableData.getServerDataList();if(serverDataList.size()>0){// 1 先删除一行, demo中第一行是为了调整 三线表 样式(也是一个空行)xwpfTable.removeRow(1);//2 向表格中渲染数据// 行从中间插入, 因此采用倒序渲染数据for (int i = serverDataList.size() - 1; i >= 0; i--) {XWPFTableRow newRow = xwpfTable.insertNewTableRow(1);newRow.setHeight(400);for (int j = 0; j < 4; j++) {newRow.createCell();}// 渲染一行数据TableRenderPolicy.Helper.renderRow(newRow, serverDataList.get(i));}//3 合并表格TableTools.mergeCellsVertically(xwpfTable, 0, 1, 2);TableTools.mergeCellsVertically(xwpfTable, 0, 3, 4);}}}
第二步:封装数据
private ServerTableData getServerTableData() {ServerTableData serverTableData = new ServerTableData();List<RowRenderData> serverDataList = new ArrayList<>();for (int j = 0; j < 4; j++) {String value;RowRenderData serverData;//前二行if (j > 1) {value = "索隆";serverData = Rows.of(value, "喝酒", "三千世界", "无").center().create();}else {value = "路飞";serverData = Rows.of(value, "大鸡腿", "巨人手枪", "橡胶果实").center().create();}serverDataList.add(serverData);}List<Map<String, Object>> groupDataList = new ArrayList<>();Map<String, Object> groupData1 = new HashMap<>();groupData1.put("typeName", "索隆");groupData1.put("listSize", "2");Map<String, Object> groupData2 = new HashMap<>();groupData2.put("typeName", "路飞");groupData2.put("listSize", "2");groupDataList.add(groupData1);groupDataList.add(groupData2);serverTableData.setServerDataList(serverDataList);serverTableData.setGroupDataList(groupDataList);serverTableData.setMergeColumn(0);return serverTableData;
}
第三步:绑定策略
注意:这里绑定的oneTable是写在表格中的
@Test
void contextLoads() throws IOException {// 获取模板文件流InputStream resourceAsStream = new FileInputStream("D://template.docx");//poi-tl 配置ConfigureBuilder builder = Configure.builder();builder.useSpringEL(false);Map<String,Object> map = new HashMap<>();// 伪造一个表格数据//(生成表格数据)ServerTableData oneTable = getServerTableData();//单个表格map.put("oneTable",oneTable);builder.bind("oneTable",new DynamicTableProxy());//输出文件XWPFTemplate template = XWPFTemplate.compile(Objects.requireNonNull(resourceAsStream), builder.build()).render(map);template.writeAndClose(new FileOutputStream("D://out.docx"));}
@Data
public class ServerTableData {/***  携带表格中真实数据*/private List<RowRenderData> serverDataList;/*** 携带要分组的信息*/private List<Map<String, Object>> groupDataList;/*** 需要合并的列,从0开始*/private Integer mergeColumn;}
模板:

结果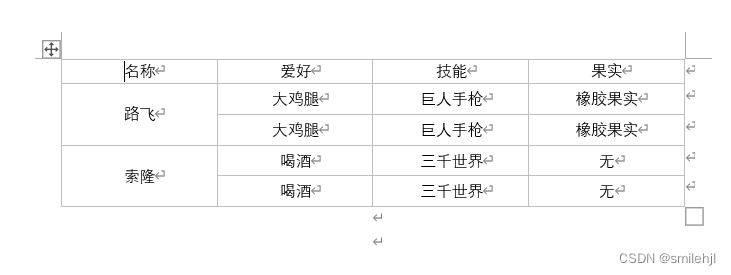
综合案例:
这篇关于poi-tl的使用(通俗易懂,全面,内含动态表格实现 包会!!)的文章就介绍到这儿,希望我们推荐的文章对编程师们有所帮助!
