本文主要是介绍Echarts 绘制到区县街道的地图,希望对大家解决编程问题提供一定的参考价值,需要的开发者们随着小编来一起学习吧!
【1】获取街道的kml文件
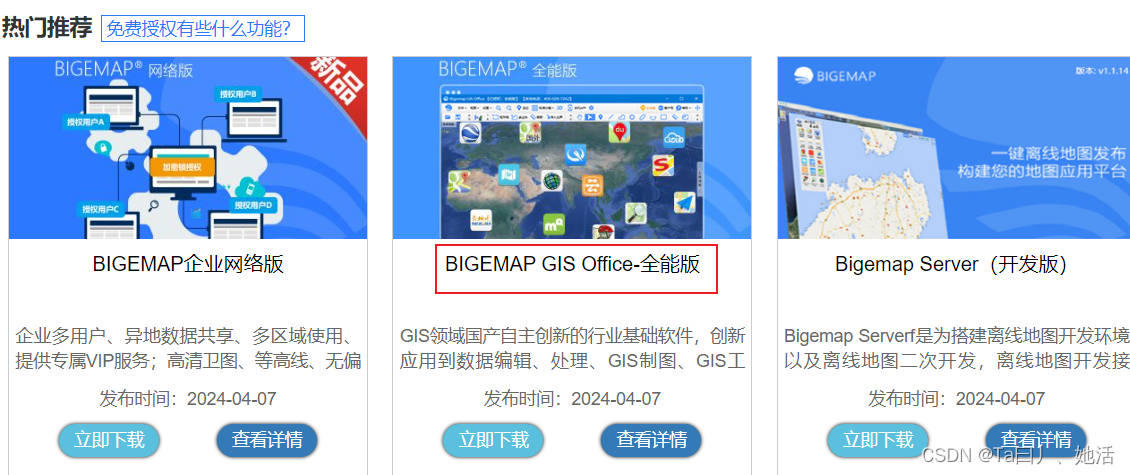
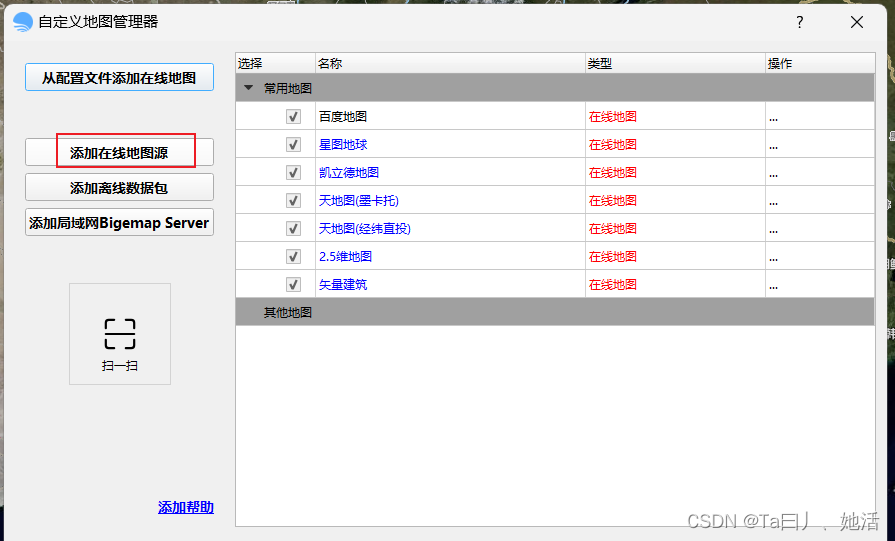
正常绘制到省市县可以用阿里云 DataV.GeoAtls地理小工具获取坐标数据即可,但是这个是不到区县街道的坐标,如果需要绘制到街道的坐标,需要借助Bigemap GIS。


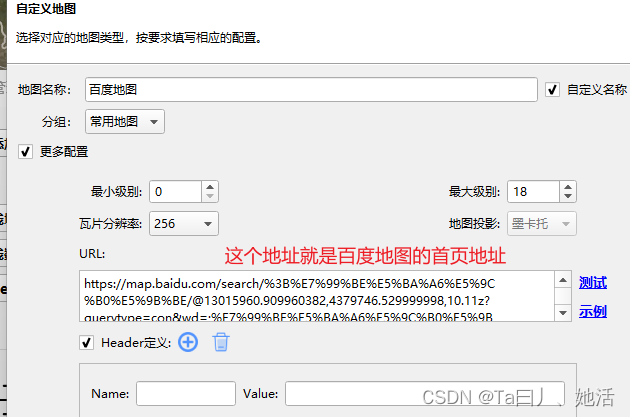
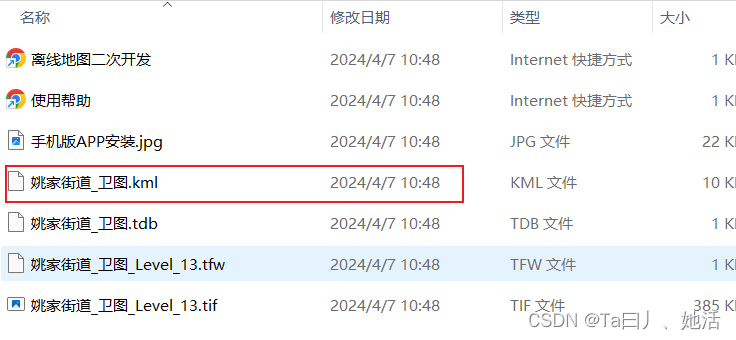
依次下载所需街道的kml文件。
【2】组合kml坐标信息
使用geojson.io在线工具将所有的mkl导入生成到区县的坐标数据
依次把下载的kml文件导入,全都导入完成后,直接将右侧的json数据cv
然后放到json文件中然后引用就好。

【3】使用效果

部分代码:
<script type="text/javascript" src="js/tianqiao.js"></script>//初始化echarts实例,TIANQIAO_MAP_DATA是坐标数据的变量echarts.registerMap('天桥区', TIANQIAO_MAP_DATA);var mapEchart = echarts.init(document.getElementById('mapEchart'));var option = {title: {text: "天桥区资产分布图",// subtext: "各区域资产间数",textStyle: {color: "white",},subtextStyle: {color: "white",},top: 10,left: "center"},tooltip: { // 鼠标悬浮标注时展示的信息trigger: 'item',borderColor: 'green',formatter: function(params) {var data = params.datavar str = `名称:${data.name}<br/>资产:${data.zcNum}间<br/>负责人:张三<br/>联系方式:134xxxxxxxx<br/>地址:xxx街道100号xxx楼xxx室`;return str;} },toolbox: {show: true,top: 10,right: 10,feature: {restore: {title: '刷新'},saveAsImage: {title: '下载'}},iconStyle: {borderColor: 'white',borderWidth: 2}},geo: { // 地图信息配置type: 'map',map: '天桥区',roam: true,top: 90,zoom: 1.1,scaleLimit: {min: 1,max: 5},label: {show: true,fontSize: 8,color: "black"},itemStyle: {areaColor: "#7cf1de"},emphasis: {label: {show: true,fontSize: 16},itemStyle: {areaColor: "#7cf1de",borderWidth: 2,shadowBlur: 20,shadowColor: "rgba(0, 0, 0, 0.5)",borderColor: "#fff",}}},series: [{ // 标注信息配置// type: "scatter",type: "custom", // 自定义图标coordinateSystem: "geo",// symbol: "circle",symbolSize: 44,label: {show: true,color: "#fff",formatter: function(params) {return params.data.zcNum;}},itemStyle: {color: "#fe2321"},data: [{name: "xxx楼盘1",value: [116.97383095672191, 36.84801295303867],zcNum: 200},{name: "xxx楼盘2",value: [116.90048462154695, 36.81075951381215],zcNum: 180},{name: "xxx楼盘3",value: [117.02535907826886, 36.81946358839779],zcNum: 160},{name: "xxx楼盘4",value: [116.92648079097606, 36.771765259668506],zcNum: 140},{name: "xxx楼盘5",value: [117.03325077255984, 36.777335867403316],zcNum: 180},{name: "xxx楼盘6",value: [116.96268974125229, 36.71988897513812],zcNum: 180},{name: "xxx楼盘7",value: [116.97011721823203, 36.68959879558011],zcNum: 180},{name: "xxx楼盘8",value: [117.02860859944751, 36.693776751381215],zcNum: 180,},{name: "xxx楼盘9",value: [116.99100699723755, 36.764105674033146],zcNum: 180},{name: "xxx楼盘10",value: [116.97197408747697, 36.807626046961325],zcNum: 180}],renderItem(params, api) {const coord = api.coord([api.value(0, params.dataIndex),api.value(1, params.dataIndex)]);const circles = [];for (let i = 0; i < 5; i++) {circles.push({type: 'circle',shape: {cx: 0,cy: 0,r: 30},style: {stroke: '#5dc2fe',fill: 'none',lineWidth: 2},// Ripple animationkeyframeAnimation: {duration: 5000,loop: true,delay: (-i / 4) * 4000,keyframes: [{percent: 0,scaleX: 0,scaleY: 0,style: {opacity: 1}},{percent: 1,scaleX: 1,scaleY: 0.4,style: {opacity: 0}}]}});}return {type: 'group',x: coord[0],y: coord[1],children: [...circles,{type: 'path',shape: {d: 'M16 0c-5.523 0-10 4.477-10 10 0 10 10 22 10 22s10-12 10-22c0-5.523-4.477-10-10-10zM16 16c-3.314 0-6-2.686-6-6s2.686-6 6-6 6 2.686 6 6-2.686 6-6 6z',x: -10,y: -35,width: 20,height: 40},style: {fill: '#3c9fd9'},// Jump animation.keyframeAnimation: {duration: 4500,loop: true,delay: Math.random() * 2500,keyframes: [{y: -10,percent: 0.5,easing: 'cubicOut'},{y: 0,percent: 1,easing: 'bounceOut'}]}}]};}}]}
这篇关于Echarts 绘制到区县街道的地图的文章就介绍到这儿,希望我们推荐的文章对编程师们有所帮助!


