本文主要是介绍各扇区通话饱和度,希望对大家解决编程问题提供一定的参考价值,需要的开发者们随着小编来一起学习吧!
1、打开前端Vue项目kongguan_web,完成前端src/components/echart/SectorCallChart.vue页面设计
- 在SectorCallChart.vue页面添加div设计
<template><div class="home"><div style="margin-left:17px;margin-top: 18px; text-align:left;"> <b>各扇区通话饱和度</b></div><el-row><el-col :span="12"><div id="G_GaugeChart" class="chart" style="margin-left: 30px"/></el-col><el-col :span="12"><div id="K_GaugeChart" class="chart" style="margin-right: 30px"/></el-col></el-row><el-row><el-col :span="12"><div id="E_GaugeChart" class="chart" style="margin-left: 30px"/></el-col><el-col :span="12"><div id="P_GaugeChart" class="chart" style="margin-right: 30px"/></el-col></el-row> <el-row><el-col :span="12"><div id="S_GaugeChart" class="chart" style="margin-left: 30px"/></el-col><el-col :span="12"><div id="kong_GaugeChart" class="chart" style="margin-right: 30px"/></el-col></el-row></div>
</template>
... 接下文 ...- 初始化报表数据
... 接上文 ...
<script>import {findCallSaturation} from "../../api/chartdata/chartdata"export default {name: "SectorCallChart",data() {return {data: [],e_SectorNum: 0,k_SectorNum: 0,s_SectorNum: 0,g_SectorNum: 0,p_SectorNum: 0,e_sec_chart: {},k_sec_chart: {},s_sec_chart: {},g_sec_chart: {},p_sec_chart: {},}},mounted() {this.drawSectorChart();this.loadData();},
... 接下文 ...- 加载数据,并初始化报表
... 接上文 ...methods: {//加载数据loadData() {findCallSaturation().then(data => {if (data.isSuccess) {this.formatData(data.result);} else {this.$message.error("数据获取失败");}});},formatData(param) {let e_SectorNum = param.Elet k_SectorNum = param.Klet s_SectorNum = param.Slet g_SectorNum = param.Glet p_SectorNum = param.Plet e_opt = this.initSectorOption({text: "E扇区", value: e_SectorNum})let k_opt = this.initSectorOption({text: "K扇区", value: k_SectorNum})let s_opt = this.initSectorOption({text: "S扇区", value: s_SectorNum})let g_opt = this.initSectorOption({text: "G扇区", value: g_SectorNum})let p_opt = this.initSectorOption({text: "P扇区", value: p_SectorNum})this.e_sec_chart.setOption(e_opt);this.k_sec_chart.setOption(k_opt);this.s_sec_chart.setOption(s_opt);this.g_sec_chart.setOption(g_opt);this.p_sec_chart.setOption(p_opt);},drawSectorChart() {this.e_sec_chart = this.$echarts.init(document.getElementById("E_GaugeChart"));this.k_sec_chart = this.$echarts.init(document.getElementById("K_GaugeChart"));this.s_sec_chart = this.$echarts.init(document.getElementById("S_GaugeChart"));this.g_sec_chart = this.$echarts.init(document.getElementById("G_GaugeChart"));this.p_sec_chart = this.$echarts.init(document.getElementById("P_GaugeChart"));},
... 接下文 ...- 在加载数据后,需要将数据转换为EChart所需的Option格式,所以在上面的代码中调用了initSectorOption方法,代码如下:
... 接上文 ...initSectorOption(ChartObj) {let option = {title: [{text: ChartObj.text,top: '140',x: 'center',borderColor: '#fff',backgroundColor: '#337cde',borderWidth: 1,borderRadius: 15,padding: [7, 14],textStyle: {fontWeight: 'normal',fontSize: 12,color: '#fff'}}],angleAxis: {show: false,max: 100 * 360 / 270, //-45度到225度,二者偏移值是270度除360度type: 'value',startAngle: 225, //极坐标初始角度splitLine: {show: false}},barMaxWidth: 14, //圆环宽度radiusAxis: {show: false,type: 'category',},//圆环位置和大小polar: {center: ['50%', '50%'],radius: '150'},series: [{type: "gauge",// center: t.pos,radius: "56%",// splitNumber: t.splitNum || 10,min: 0,max: 100,startAngle: 225,endAngle: -45,axisLine: {show: !0, lineStyle: {width: 1, color: [[1, "rgba(0,0,0,0)"]]}},axisTick: {show: !0, lineStyle: {color: "rgba(53,125,224,0.6)", width: 1}, length: -5},splitLine: {show: !1, length: -20, lineStyle: {color: "rgba(53,125,224,0.6)"}},axisLabel: {show: !1, distance: -20, textStyle: {fontSize: "14", fontWeight: "bold"}},pointer: {show: 0},detail: {show: 0}}, {// name: t.name,type: "gauge",// center: t.pos,radius: "75%",startAngle: 225,endAngle: -45,min: 0,max: 100,axisLine: {show: !0,lineStyle: {width: 9,color: [[ChartObj.value[0] * 10 / 100, new this.$echarts.graphic.LinearGradient(0, 0, 1, 0, [{offset: 0,color: "#5ce07e"}, {offset: .5, color: "#558ed7"}, {offset: 1, color: "#fec16b"}])], [1, "#dde8fe"]]}},axisTick: {show: 0},splitLine: {show: 0},axisLabel: {show: 0},pointer: {show: !0, width: "8%", length: "50%"},itemStyle: {normal: {color: "#357de0"}},detail: {show: !0,offsetCenter: [0, "60%"],textStyle: {fontSize: 14, color: "#44d96b"},formatter: ["{value} %" ].join("\n"),rich: {name: {fontSize: 14, lineHeight: 30, color: "#ddd"},score: {backgroundColor: "#357de0",padding: [2, 10, 5, 10],lineHeight: 30,borderRadius: 10,color: "#fff",fontFamily: "微软雅黑",fontSize: 12}}},data: [ChartObj.value[0] * 10]}]};return option;}}}
</script>
... 接下文 ...- 页面的样式
... 接上文 ...
<style scoped>.home {height: 700px;overflow: auto;background-color: #ffffff;border: 1px solid #ebedf2;border-radius: 10px;box-shadow: 3px 3px 3px 3px #ebedf2;}.home::-webkit-scrollbar {display: none;}.chart {height: 181px;}
</style>- 加载数据时,会调用src/api/chartdata/chartdata.js中定义的findCallSaturation()方法,向服务端发送GET请求,获取各个扇区通话饱和度,chartdata.js的完整代码如下:
import request from '../../utils/request'
const baseUrl = "/api"
/*** 扇区架次数动态统计*/
export function findATCTime() {return request({url: baseUrl + "/atc/findATCTime",method: "GET"})
}
/*** 获取各个扇区通话饱和度*/
export function findCallSaturation() {return request({url: baseUrl + "/callSaturation/findCallSaturation",method: "GET"})
}
export function annualWarningStatisticsByCategory() {return request({url: baseUrl + "/warnFlightHistory/annualWarningStatisticsByCategory",method: "GET"})
}
export function getAirPortCount() {return request({url: baseUrl + "/company/getAirPortCount",method: "GET"})
}
/*** 获取从青岛起飞航班数前十的航线* @returns {AxiosPromise}*/
export function findByLimit() {return request({url: baseUrl + "/airLine/findByLimit",method: "GET"})
}
2、后端服务开发
- 打开后端项目 BigData-KongGuan,编写实体类src/main/java/com/qrsoft/entity/Callsaturation.java,用于保存通话饱和度信息
package com.qrsoft.entity;import com.baomidou.mybatisplus.annotation.IdType;
import com.baomidou.mybatisplus.annotation.TableField;
import com.baomidou.mybatisplus.annotation.TableId;
import com.baomidou.mybatisplus.annotation.TableName;
import lombok.AllArgsConstructor;
import lombok.Data;
import lombok.NoArgsConstructor;import java.io.Serializable;@Data
@AllArgsConstructor
@NoArgsConstructor
@TableName("callsaturation_number")
public class Callsaturation implements Serializable {@TableId(value = "id",type = IdType.AUTO)private Integer id;@TableField(value = "SEND_TIME")private String sendTime;@TableField(value = "AREA_SOURCE")private String areaSource;@TableField(value = "THBH_TIME")private String thbhTime;@TableField(value = "THBH_SECT")private String thbhSect;@TableField(value = "THBH_VALUE")private String thbhValue;
}- 编写数据访问类src/main/java/com/qrsoft/mapper/CallsaturationMapper.java,查询各扇区通话饱和度
package com.qrsoft.mapper;import com.baomidou.mybatisplus.core.mapper.BaseMapper;
import com.qrsoft.entity.Callsaturation;
import org.apache.ibatis.annotations.Mapper;
import org.apache.ibatis.annotations.Select;import java.util.List;@Mapper
public interface CallsaturationMapper extends BaseMapper<Callsaturation> {@Select("select THBH_SECT,THBH_VALUE from callsaturation_number group by THBH_SECT;")List<Callsaturation> findCallSaturation();
}- 编写Service层接口类src/main/java/com/qrsoft/service/CallsaturationService.java,查询各扇区通话饱和度
package com.qrsoft.service;import com.baomidou.mybatisplus.extension.service.impl.ServiceImpl;
import com.qrsoft.common.Result;
import com.qrsoft.common.ResultConstants;
import com.qrsoft.entity.Callsaturation;
import com.qrsoft.mapper.CallsaturationMapper;
import org.springframework.stereotype.Service;import java.util.HashMap;
import java.util.List;
import java.util.Map;@Service
public class CallsaturationService extends ServiceImpl<CallsaturationMapper, Callsaturation> {/*** 查询各扇区通话饱和度* @return*/public Result findCallSaturation(){Map<String,String> map = new HashMap<>();List<Callsaturation> callSaturation = baseMapper.findCallSaturation();for (Callsaturation c:callSaturation ) {map.put(c.getThbhSect(),String.valueOf((Double.parseDouble(c.getThbhValue())*100)));}return new Result(ResultConstants.SUCCESS, ResultConstants.C_SUCCESS,map);}
}- 编写控制器类src/main/java/com/qrsoft/controller/CallSaturationController.java,查询各扇区通话饱和度
package com.qrsoft.controller;import com.qrsoft.common.Result;
import com.qrsoft.service.CallsaturationService;
import io.swagger.annotations.Api;
import io.swagger.annotations.ApiOperation;
import org.springframework.beans.factory.annotation.Autowired;
import org.springframework.web.bind.annotation.GetMapping;
import org.springframework.web.bind.annotation.RequestMapping;
import org.springframework.web.bind.annotation.RestController;@Api(tags = "扇区饱和度")
@RestController
@RequestMapping("/api/callSaturation")
public class CallSaturationController {@Autowiredprivate CallsaturationService service;@ApiOperation(value = "获取各个扇区通话饱和度")@GetMapping("/findCallSaturation")public Result findCallSaturation(){return service.findCallSaturation();}
}
3、前后端整合,实现设计效果
- 打开前端Vue项目kongguan_web,在src/views/Home/Index.vue引入SectorCallChart组件
... 略 ...import AirLine from "../../components/AirLine";import Section from "../../components/Section";import Delay from "../../components/Delay";import WarnStatistice from "../../components/WarnStatistice";import SectorFlightChart from "../../components/echart/SectorFlightChart";import SectorCallChart from "../../components/echart/SectorCallChart";import {hasPermission} from "../../utils/permission";export default {data() {return {};},mounted() {},components: {AirLine,Section,Delay,WarnStatistice,SectorFlightChart,SectorCallChart},methods: {isShow(permission){return hasPermission(permission);   }}
... 略 ...- 在src/views/Home/Index.vue添加“扇区通话饱和度”组件,代码如下:
<el-row :gutter="30" v-show="isShow('/section/detail')"><el-col :span="16" align="center"><SectorFlightChart/></el-col><el-col :span="8" align="center"><SectorCallChart/></el-col>
</el-row>- src/views/Home/Index.vue的完整代码如下:
<template><div class="index"><el-row :gutter="30" v-show="isShow('/flight/airline')"><el-col :span=24 align="center"><AirLine/></el-col></el-row> <el-row :gutter="30"  v-show="isShow('/flight/section')"><el-col :span="24" align="center"><Section/></el-col></el-row><el-row :gutter="30" v-show="isShow('/flight/delay')"><el-col :span="16" align="center"><Delay/></el-col><el-col :span="8" align="center"><year-warning-chart/></el-col></el-row><el-row :gutter="30" v-show="isShow('/section/warning')"><el-col :span="12" align="center"><air-port-count-chart/></el-col><el-col :span="12" align="center"><WarnStatistice/></el-col></el-row><el-row :gutter="30" v-show="isShow('/section/detail')"><el-col :span="16" align="center"><SectorFlightChart/></el-col><el-col :span="8" align="center"><SectorCallChart/></el-col></el-row></div>
</template><script>import AirLine from "../../components/AirLine";import Section from "../../components/Section";import Delay from "../../components/Delay";import WarnStatistice from "../../components/WarnStatistice";import SectorFlightChart from "../../components/echart/SectorFlightChart";import SectorCallChart from "../../components/echart/SectorCallChart";import {hasPermission} from "../../utils/permission";export default {data() {return {};},mounted() {},components: {AirLine,Section,Delay,WarnStatistice,SectorFlightChart,SectorCallChart},methods: {isShow(permission){return hasPermission(permission);   }}};
</script><style scoped>.index {height: 100%;overflow: auto;padding-left: 44px;padding-right: 44px}.index::-webkit-scrollbar {display: none;}.caseClass {background: url('../../assets/images/index-bg.png') no-repeat;background-size: cover;margin-top: 20px;height: 284px;}.el-button {background: transparent;}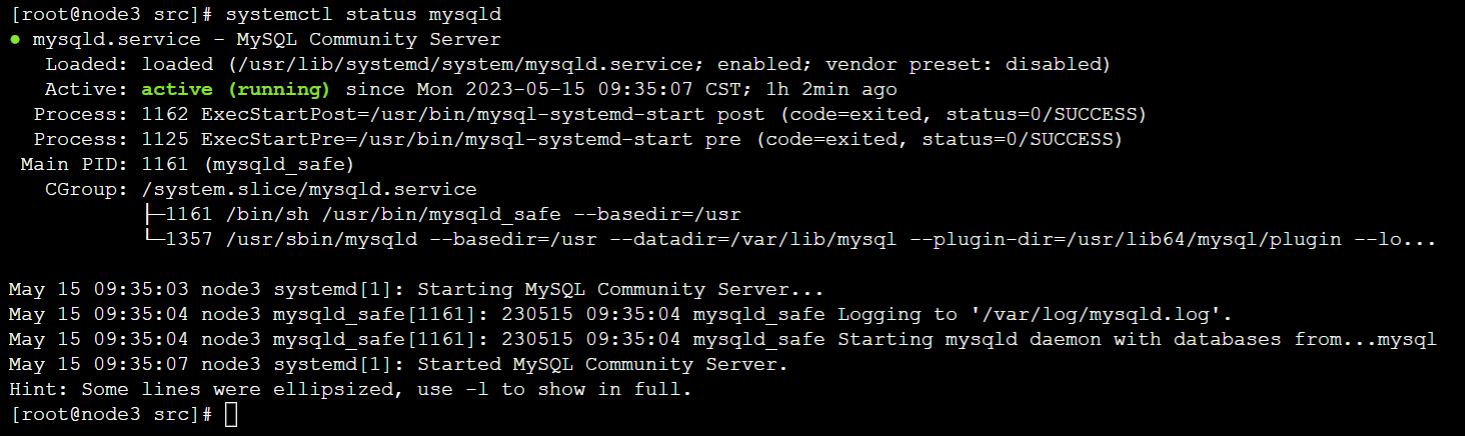
</style>- 确保Hadoop、Spark、Kafka、Redis、MySQL等服务均已经正常启动,如果没有正常启动,请参照前面的安装部署任务,完成这些服务的启动。
例如:查看MySQL是否正常启动。
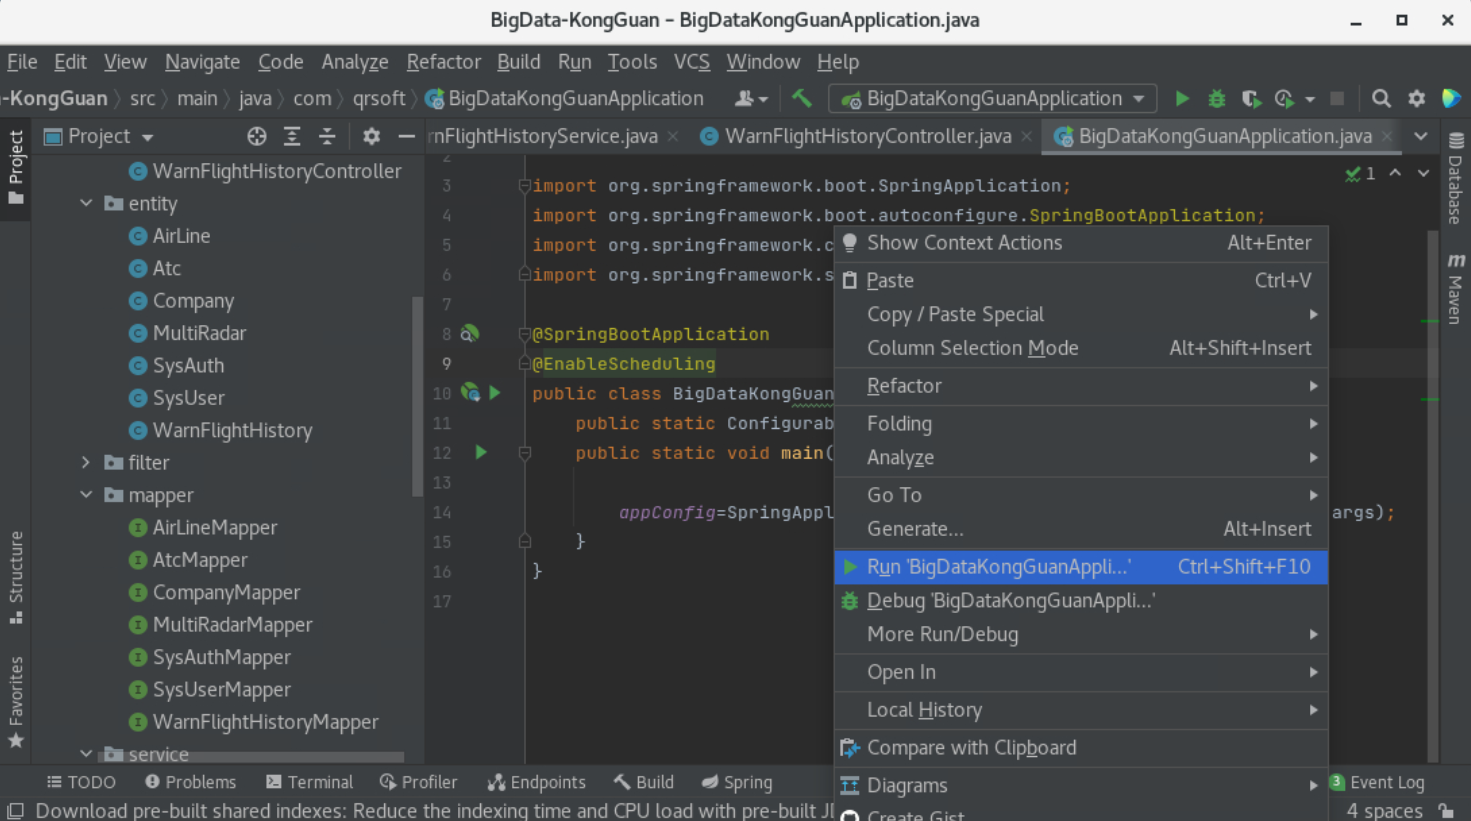
- 启动后端项目 BigData-KongGuan,如图启动src/main/java/com/qrsoft/BigDataKongGuanApplication.java类
- 启动前端项目 kongguan_web,代码如下
kongguan_web@0.1.0 dev /root/kongguan_web
vue-cli-service serve --open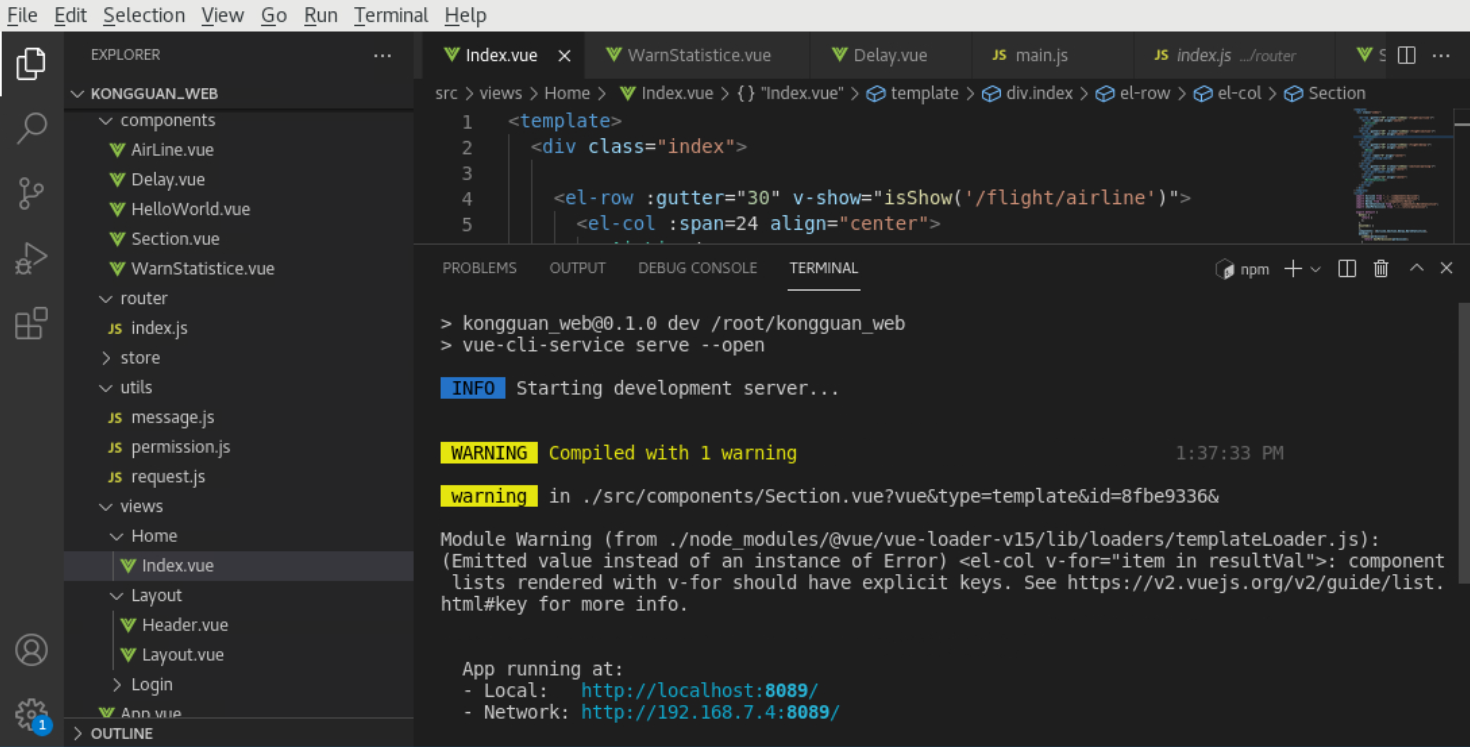
- 报表的最终展示效果如下图所示:

这篇关于各扇区通话饱和度的文章就介绍到这儿,希望我们推荐的文章对编程师们有所帮助!