本文主要是介绍立体统计图表绘制方法(分离式环图),希望对大家解决编程问题提供一定的参考价值,需要的开发者们随着小编来一起学习吧!
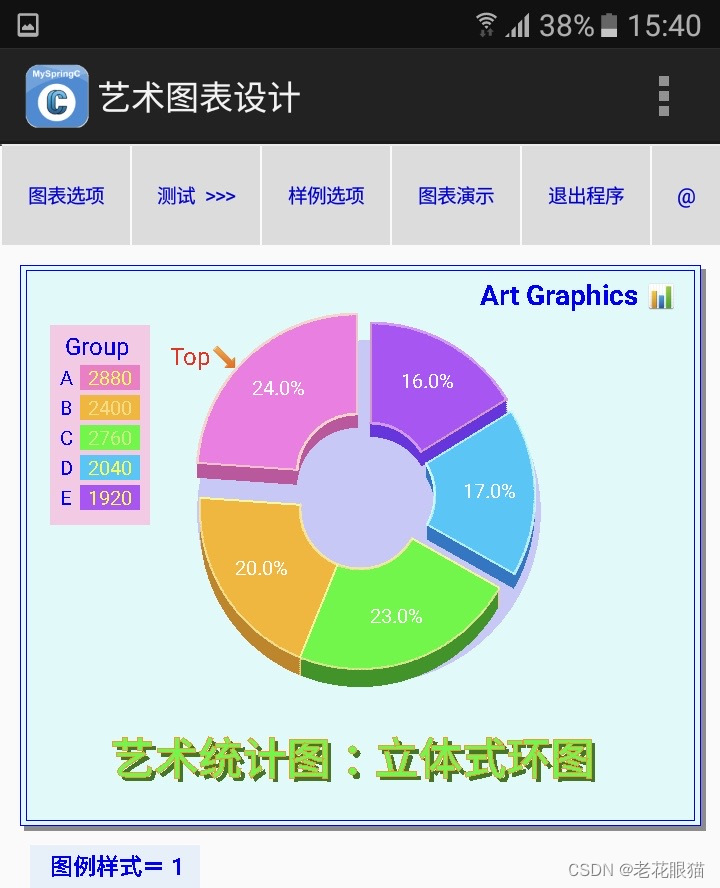
立体统计图表绘制方法(分离式环形图)
记得我学统计学的时候,那些统计图表大都是平面的框框图,很呆板,就只是表现出统计的意义就好了。在网络科技发展进步的当下,原来一些传统的统计图表都有了进一步的创新。在统计图的形式和艺术表现力的美工方面都有了长足的进步。以前企业的PPT都依赖微软的各应用软件来制作图表,现时企业的PPT展示的图表应用不再满足于Excle,Word等的图表绘制方法,进而使用一些第三方应用软件来制作新颖漂亮的图表。由此而有许多图表制作的应用软件面市。这些图表很吸引眼球,我对此也很感兴趣,故试着写了一些各种式样图表的绘制方法,供有同好的同行参考和评论。如果自己在做PPT时加入自己设计制作的图表,我相信这会使人有耳目一新的感觉,还会得到大家的青睐。这会使你感到很有成就感。我就是这样做的。
新样式的统计图有复合式,堆叠式,展开式等等,不一而足。在美工艺术方面有许多独到新颖的样式,给人一个赏心悦目的感受。
今在此提供一种新颖漂亮的立体形式的统计图的绘制方法供参考。
分离式的立体图形绘制较难,就介绍分离式的环形图。
本方法采用C语言的最基本功能:
( 1) 绘图功能画线,画圆,画矩形。
(2) 界面美工设计,界面文字打印输出。
代码中有详细的注释,通俗易懂,一看就会。
下面是绘制艺术统计图表的代码:
//变量: 可设置成全局变量或私有变量
Canvas cs ; //画布,绘制图表载体
float pi=3.1415926535 ;
float a ; //三角函数 sin (a), cos (a),
float r ; //圆半径 radius
int i, j, n ;
float x0,y0,x1,y1,x2,y2 ; //作图
float dx1,dy1,dx,dy ; //中心坐标
string ss, ss1, ss2,ss3 ; //打印文字
int p[16] ; //set data or input data
int p1[16], p2[16], p3[16] ; //data
double pn ; //显示数据,计算
int ca, cr, cg, cb ; //设置颜色 setColor (a,r,g,b)
int ppn ; //计算
int tb ; //set tab, print
int k0, k1 ; //圆720线 起终点
//*************************
ArtGraphics4 (){ //艺术统计图 立体环形图(分离式)
cs.ClearDraw (0,src); //清屏
clearOutput();
selectStyle () ; //图例样式选项设置
cs.SetFillMode (1);//0不填色,1填色
cs.SetColor (255,250,250,250);
cs.DrawRect (0,4,720,600); //back board
cs.SetColor (255,140,140,140);
cs.DrawRect (24,24,706,586); //back
cs.SetColor (255,220,250,250);
cs.DrawRect (20,20,700,580); //back
cs.SetFillMode (0);//0不填色,1填色
cs.SetColor (255,0,0,250);
cs.DrawRect (20,20,700,580); //back
cs.DrawRect (26,25,694,575); //back
//艺术统计图样例: 图例 (分离式立体环图)
cs.SetFillMode (1);//0不填色,1填色
dx=360; dy=260 ; //center
cs.SetColor (255,250,200,230);
cs.DrawRect (50,80,150,280); //样本值标底
cs.SetStrokeWidth(1); //线
cs.SetTextStyle (0); //1 粗体字
cs.SetTextSize (24);
cs.SetColor(255,0,0,250);
cs.DrawText ("Group ",65,110);
cs.SetTextSize (20);
cs.DrawText (" A",55,140);
cs.DrawText (" B",55,170);
cs.DrawText (" C",55,200);
cs.DrawText (" D",55,230);
cs.DrawText (" E",55,260);
//图例样本值:input data
p1[1]=2880; p1[2]=2400; p1[3]=2760; p1[4]=2040;
p1[5]=1920; //部门 12000
k[0]=180; //k=180,12点钟方向为0位
//k=0, 3点钟方向为0位
k[1]=k[0]+p1[1]*72/1200 ; //样本值合计12000
k[2]=k[1]+p1[2]*72/1200 ; //转换成整圆720线
k[3]=k[2]+p1[3]*72/1200 ;
k[4]=k[3]+p1[4]*72/1200 ;
k[5]=k[4]+p1[5]*72/1200 ;
//绘制立体环形图:
cs.SetStrokeWidth(2); //线
dx=360; dy=260 ; r=160 ; //center, radius
cs.SetColor(255,200,200,250);
cs.DrawCircle (dx+9, dy+7, 172); //圆底色
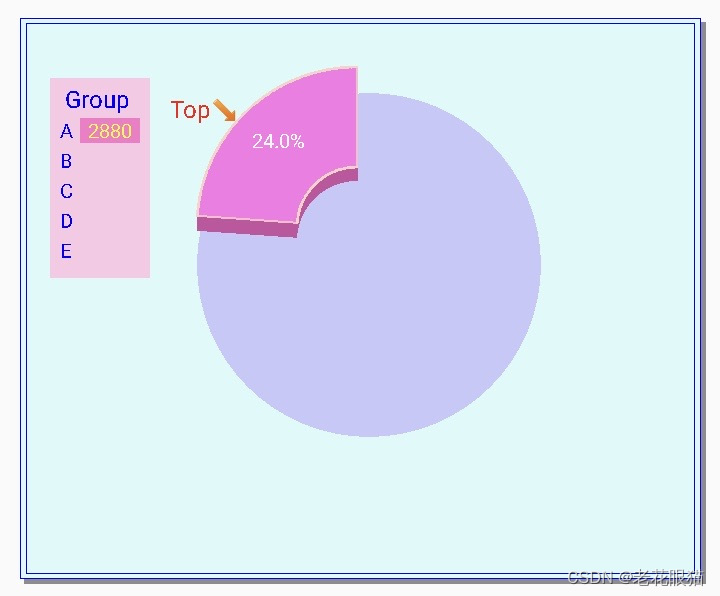
//先绘制上面的第1块
for (t=1; t<=8 ; t++){ //底16线
for (i= k[0]; i<=k[1] ; i++){
dx=360-3 ; dy=245-t*2 ; r=160 ;
a=pi/360*i ;
cs.SetColor(255,200,80,160);
x0=(float)(r*cos (a))+dx ; //r=radius
y0=(float)(- r*sin (a))+dy ; //逆时针
x1=(float)((r-100)*cos (a))+dx ; //r=radius
y1=(float)(- (r-100)*sin (a))+dy ; //逆时针
cs.DrawLine (x1,y1, x0,y0); } } //立体底色
for (i= k[0]; i<=k[1] ; i++){ //绘制面上色
dx=360-3 ; dy=245-16 ;
a=pi/360*i ;
cs.SetColor(255,250,120,230);
x0=(float)(r*cos (a))+dx ; //r=radius
y0=(float)(- r*sin (a))+dy ; //逆时针
x1=(float)((r-100)*cos (a))+dx ; //r=radius
y1=(float)(- (r-100)*sin (a))+dy ; //逆时针
cs.DrawLine (x1,y1, x0,y0);
cs.SetColor(255,250,210,200); //圆弧线
cs.DrawCircle (x0,y0,1.5);
cs.DrawCircle (x1,y1,1.5); } //面上色
a=pi/360*k[0] ;
x2=(float)(r*cos (a))+dx ; //r=radius
y2=(float)(- r*sin (a))+dy ; //逆时针
a=pi/360*k[0] ;
x3=(float)((r-100)*cos (a))+dx ; //r=radius
y3=(float)(- (r-100)*sin (a))+dy ; //逆时针
cs.SetColor(205,250,210,200);
cs.DrawLine (x1,y1, x0,y0); //分隔线
cs.DrawLine (x3,y3, x2,y2); //加分隔线
cs.SetColor(255,250,120,200); //标字和%
cs.DrawRect (80,1*30+90 ,140,1*30+115); //n=1
pn=p1[1]*10 ; //保留1位小数
pn=pn/1200 ;
ss1=doubleToString (pn)+"%" ;
ss2=intToString (p1[1]) ;
cs.SetColor(255,250,250,0);
cs.DrawText(ss2, 88,1*30+110); //标样本值
cs.SetColor(255,250,250,250); //图上标p1(n)
ma=pi/360*((k[0]+k[1])/2) ;
x1=(float)((r-45)*cos (ma))+dx ;
y1=(float)(-(r-45)*sin (ma))+dy ;
cs.DrawText (ss1,x1-27,y1+5); //标%
cs.SetTextSize (24);
cs.SetColor(255,250,0,0);
cs.DrawText ("Top↘",170,120) ;
cs.SetTextSize (20);
cs.Update () ;
sleep (1000) ; //延迟1秒
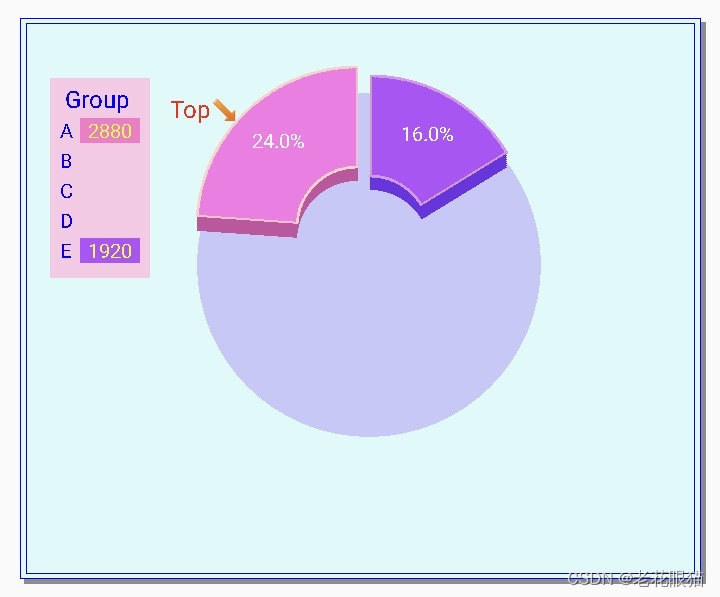
//再绘制上面的第5块
for (t=1; t<=8 ; t++){ //底16线
for (i= k[4]; i<=k[5]+1 ; i++){
dx=360+10 ; dy=254-t*2 ;
a=pi/360*i ;
cs.SetColor(255,110,50,230);
x0=(float)(r*cos (a))+dx ; //r=radius
y0=(float)(- r*sin (a))+dy ; //逆时针
x1=(float)((r-100)*cos (a))+dx ; //r=radius
y1=(float)(- (r-100)*sin (a))+dy ; //逆时针
cs.DrawLine (x1,y1, x0,y0); } } //立体底色
for (i= k[4]; i<=k[5]+1 ; i++){ //绘制面上色
dx=360+10 ; dy=254-16 ;
a=pi/360*i ;
cs.SetColor(255,180,80,250);
x0=(float)(r*cos (a))+dx ; //r=radius
y0=(float)(- r*sin (a))+dy ; //逆时针
x1=(float)((r-100)*cos (a))+dx ; //r=radius
y1=(float)(- (r-100)*sin (a))+dy ; //逆时针
cs.DrawLine (x1,y1, x0,y0);
cs.SetColor(255,220,150,250); //圆弧线
cs.DrawCircle (x0,y0,1.5);
cs.DrawCircle (x1,y1,1.5); }//面上色
a=pi/360*k[4] ;
x2=(float)(r*cos (a))+dx ; //r=radius
y2=(float)(- r*sin (a))+dy ; //逆时针
a=pi/360*k[4] ;
x3=(float)((r-100)*cos (a))+dx ; //r=radius
y3=(float)(- (r-100)*sin (a))+dy ; //逆时针
cs.SetColor(255,220,150,200);
cs.DrawLine (x1,y1, x0,y0); //分隔线
cs.DrawLine (x3,y3, x2,y2); //加分隔线
cs.SetColor(255,180,80,250); //标字和%
cs.DrawRect (80,5*30+90 ,140,5*30+115); //n=5
pn=p1[5]*10 ; //保留1位小数
pn=pn/1200 ;
ss1=doubleToString (pn)+"%" ;
ss2=intToString (p1[5]) ;
cs.SetColor(255,250,250,0);
cs.DrawText(ss2, 88,5*30+110); //标样本值
cs.SetColor(255,250,250,250); //图上标p1(n)
ma=pi/360*((k[4]+k[5])/2) ;
x1=(float)((r-45)*cos (ma))+dx ;
y1=(float)(-(r-45)*sin (ma))+dy ;
cs.DrawText (ss1,x1-27,y1+5); //标%
cs.Update () ;
sleep (1000) ; //延迟1秒
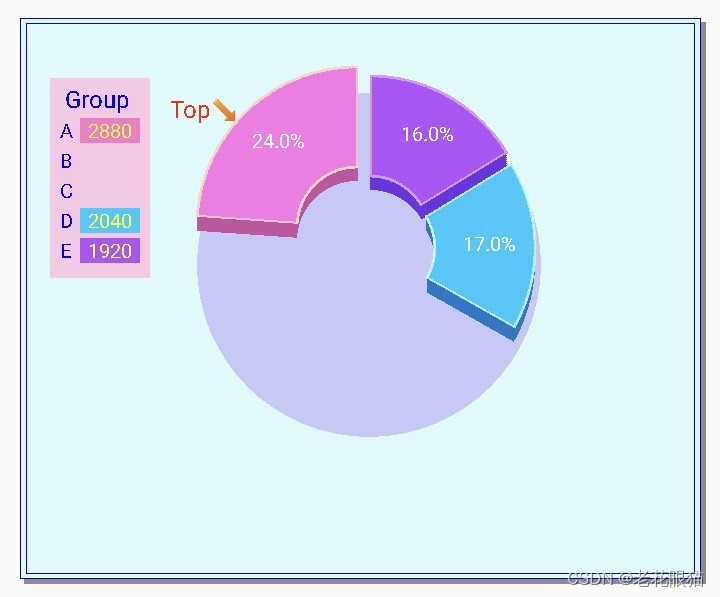
//再绘制上面的第4块
for (t=1; t<=8 ; t++){ //底16线
for (i= k[3]; i<=k[4] ; i++){
dx=360+15 ; dy=266-t*2 ;
a=pi/360*i ; // a/2 绘出的是半圆
cs.SetColor(255,0,120,200);
x0=(float)(r*cos (a))+dx ; //r=radius
y0=(float)(- r*sin (a))+dy ; //逆时针
x1=(float)((r-100)*cos (a))+dx ; //r=radius
y1=(float)(- (r-100)*sin (a))+dy ; //逆时针
cs.DrawLine (x1,y1, x0,y0); } } //立体底色
for (i= k[3]; i<=k[4] ; i++){ //绘制面上色
dx=360+15 ; dy=250 ;
a=pi/360*i ;
cs.SetColor(255,0,200,250);
x0=(float)(r*cos (a))+dx ; //r=radius
y0=(float)(- r*sin (a))+dy ; //逆时针
x1=(float)((r-100)*cos (a))+dx ; //r=radius
y1=(float)(- (r-100)*sin (a))+dy ; //逆时针
cs.DrawLine (x1,y1, x0,y0);
cs.SetColor(185,200,250,250); //圆弧线
cs.DrawCircle (x0,y0,1.5);
cs.DrawCircle (x1,y1,1.5); } //面上色
a=pi/360*k[3] ;
x2=(float)(r*cos (a))+dx ; //r=radius
y2=(float)(- r*sin (a))+dy ; //逆时针
a=pi/360*k[3] ;
x3=(float)((r-100)*cos (a))+dx ; //r=radius
y3=(float)(- (r-100)*sin (a))+dy ; //逆时针
cs.SetColor(205,200,250,250);
cs.DrawLine (x1,y1, x0,y0); //分隔线
cs.DrawLine (x3,y3, x2,y2); //加分隔线
cs.SetColor(255,0,200,250); //标字和%
cs.DrawRect (80,4*30+90 ,140,4*30+115); //n=4
pn=p1[4]*10 ; //保留1位小数
pn=pn/1200 ;
ss1=doubleToString (pn)+"%" ;
ss2=intToString (p1[4]) ;
cs.SetColor(255,250,250,0);
cs.DrawText(ss2, 88,4*30+110); //标样本值
cs.SetColor(255,250,250,250); //图上标p1(n)
ma=pi/360*((k[3]+k[4])/2) ;
x1=(float)((r-45)*cos (ma))+dx ;
y1=(float)(-(r-45)*sin (ma))+dy ;
cs.DrawText (ss1,x1-27,y1+5); //标%
cs.Update () ;
sleep (1000) ; //延迟1秒
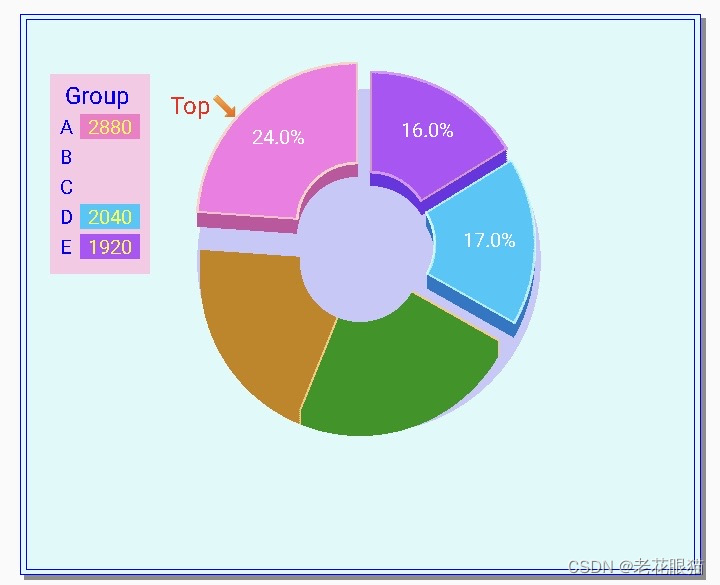
//绘制2到3块
dx=360 ; dy=280+4 ;
for (t=1; t<=8 ; t++){ //底16线
dy=dy-2 ;
for (n=2; n<=3 ; n++){ //画1和3色块
for (i= k[n-1]; i<=k[n]; i++){
a=pi/360*i ; // a/2 绘出的是半圆
if (n==2) cs.SetColor(255,200,130,0);
if (n==3) cs.SetColor(255,0,150,0);
x0=(float)(r*cos (a))+dx ; //r=radius
y0=(float)(- r*sin (a))+dy ; //逆时针
x1=(float)((r-100)*cos (a))+dx ; //r=radius
y1=(float)(- (r-100)*sin (a))+dy ; //逆时针
cs.DrawLine (x1,y1, x0,y0); } }//立体底
for (n=2; n<=3 ; n++){ //加分隔线
a=pi/360*k[n] ;
x2=(float)(r*cos (a))+dx ; //r=radius
y2=(float)(- r*sin (a))+dy ; //逆时针
a=pi/360*k[n] ;
x3=(float)((r-100)*cos (a))+dx ; //r=radius
y3=(float)(- (r-100)*sin (a))+dy ; //逆时针
cs.SetColor(255,250,200,120);
cs.DrawLine (x3,y3, x2,y2); }//分隔线
} //t,
cs.Update (); //看一下中间效果
sleep (1000) ;
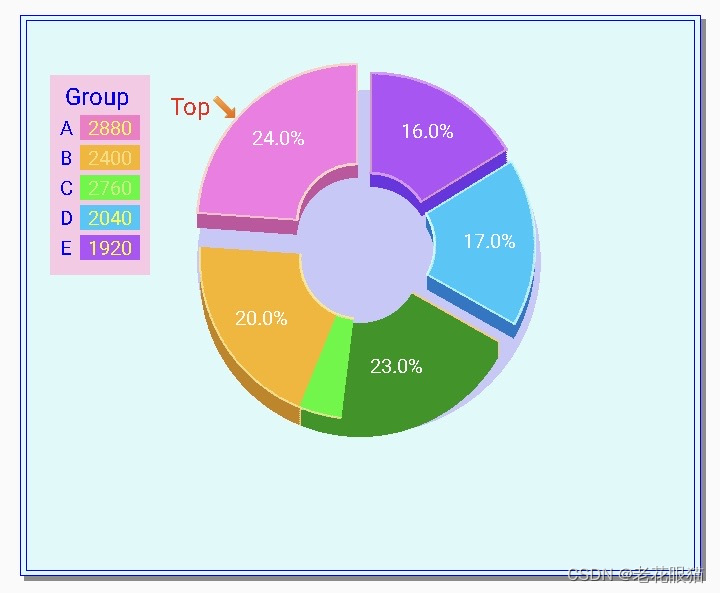
//最后绘制面上的饼图>完成
for (n=2; n<=3 ; n++){
dy=280-16 ;
for (i= k[n-1]; i<=k[n]; i++){
a=pi/360*i ; // a/2 绘出的是半圆
if (n==2) cs.SetColor(255,250,180,0);
if (n==3) cs.SetColor(255,0,250,0);
x0=(float)(r*cos (a))+dx ; //r=radius
y0=(float)(- r*sin (a))+dy ; //逆时针
x1=(float)((r-100)*cos (a))+dx ; //r=radius
y1=(float)(- (r-100)*sin (a))+dy ; //逆时针
cs.DrawLine (x1,y1, x0,y0); //扇形线
cs.DrawRect (80,n*30+90 ,140,n*30+115); //色标
cs.SetColor(205,250,230,150); //圆弧线
cs.DrawCircle (x0,y0,1.2);
cs.DrawCircle (x1,y1,1.5);
//动画显示逐线绘出 加色标
pn=p1[n]*10 ; //保留1位小数
pn=pn/1200 ;
ss1=doubleToString (pn)+"%" ;
ss2=intToString (p1[n]) ;
cs.DrawText(ss2, 88,n*30+110); //色标
cs.SetColor(255,250,250,250); //图上标p1(n)
ma=pi/360*((k[n-1]+k[n])/2) ;
x1=(float)((r-45)*cos (ma))+dx ;
y1=(float)(-(r-45)*sin (ma))+dy ;
cs.DrawText (ss1,x1-27,y1+5); //标字
cs.Update () ; } } //show 饼图
for (n=1; n<=3 ; n++){
a=pi/360*k[n] ;
x2=(float)(r*cos (a))+dx ; //r=radius
y2=(float)(- r*sin (a))+dy ; //逆时针
a=pi/360*k[n] ;
x3=(float)((r-100)*cos (a))+dx ; //r=radius
y3=(float)(- (r-100)*sin (a))+dy ; //逆时针
cs.SetColor(245,250,250,150);
cs.DrawLine (x3,y3, x2,y2); } //加分隔线
//题标: 艺术立体字制作
cs.SetFillMode (1);//0不填色,1填色
cs.SetTextStyle (1);
cs.SetStrokeWidth(1);
cs.SetTextSize (28);
cs.SetColor(255,0,0,250);
cs.DrawText ("Art Graphics 📊",480,60) ;
cs.SetTextSize (46);
ss="艺术统计图:立体式环图" ;
cs.SetColor(255,50,120,20); //立体字
cs.DrawText (ss,114,534); //阴影
cs.SetColor(255,0,250,0);
cs.DrawText (ss,110,530); //本字
cs.SetFillMode (0);//0不填色,1填色
cs.SetColor(255,250,150,0);
cs.DrawText (ss,110,530); //框线
cs.Update ();
}//ArtGraphics4 ()
//**** END *****************
这篇关于立体统计图表绘制方法(分离式环图)的文章就介绍到这儿,希望我们推荐的文章对编程师们有所帮助!


