本文主要是介绍opencv3.0.0 识别表格,希望对大家解决编程问题提供一定的参考价值,需要的开发者们随着小编来一起学习吧!
转载地址:http://answers.opencv.org/question/63847/how-to-extract-tables-from-an-image/
As the others proposed finding the horizontal and vertical lines seems to be a nice way to go. Below you can find such a solution. In case you have any question feel free to ask, though I have added comments through my code so it should not be hard to follow.
#include <iostream>
#include <opencv2/opencv.hpp>using namespace std;
using namespace cv;int main()
{// Load source imagestring filename = "table.jpg";Mat src = imread(filename);// Check if image is loaded fineif(!src.data)cerr << "Problem loading image!!!" << endl;//    // Show source image
//    imshow("src", src);// resizing for practical reasonsMat rsz;Size size(800, 900);resize(src, rsz, size);imshow("rsz", rsz);// Transform source image to gray if it is notMat gray;if (rsz.channels() == 3){cvtColor(rsz, gray, CV_BGR2GRAY);}else{gray = rsz;}// Show gray imageimshow("gray", gray);// Apply adaptiveThreshold at the bitwise_not of gray, notice the ~ symbolMat bw;adaptiveThreshold(~gray, bw, 255, CV_ADAPTIVE_THRESH_MEAN_C, THRESH_BINARY, 15, -2);// Show binary imageimshow("binary", bw);
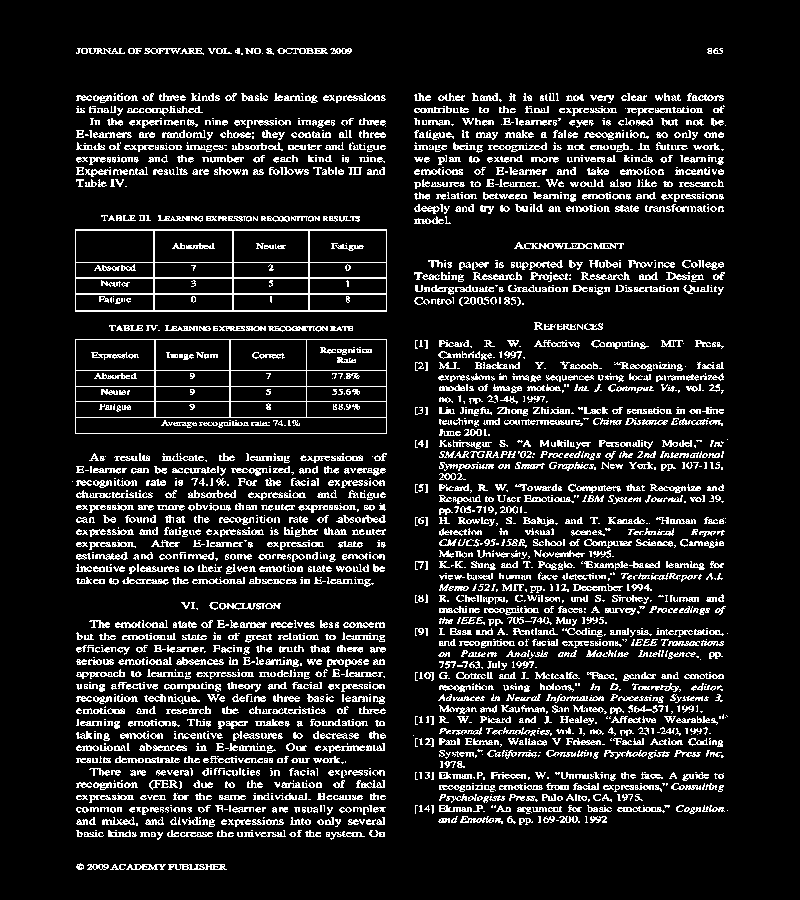
    // Create the images that will use to extract the horizonta and vertical linesMat horizontal = bw.clone();Mat vertical = bw.clone();int scale = 15; // play with this variable in order to increase/decrease the amount of lines to be detected// Specify size on horizontal axisint horizontalsize = horizontal.cols / scale;// Create structure element for extracting horizontal lines through morphology operationsMat horizontalStructure = getStructuringElement(MORPH_RECT, Size(horizontalsize,1));// Apply morphology operationserode(horizontal, horizontal, horizontalStructure, Point(-1, -1));dilate(horizontal, horizontal, horizontalStructure, Point(-1, -1));
//    dilate(horizontal, horizontal, horizontalStructure, Point(-1, -1)); // expand horizontal lines// Show extracted horizontal linesimshow("horizontal", horizontal);
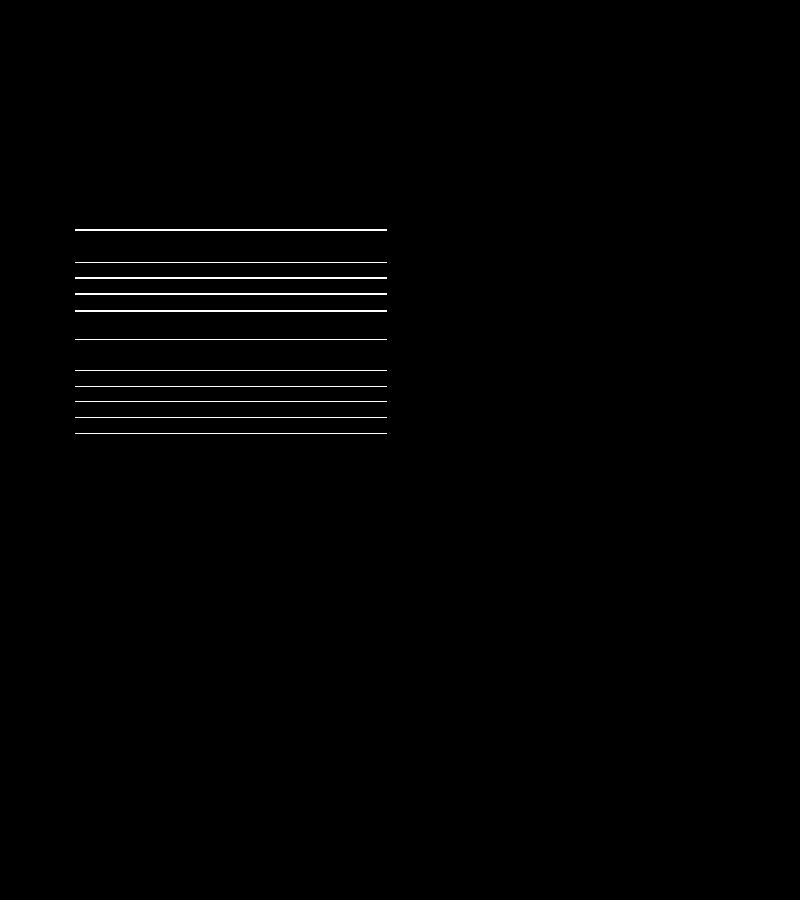
    // Specify size on vertical axisint verticalsize = vertical.rows / scale;// Create structure element for extracting vertical lines through morphology operationsMat verticalStructure = getStructuringElement(MORPH_RECT, Size( 1,verticalsize));// Apply morphology operationserode(vertical, vertical, verticalStructure, Point(-1, -1));dilate(vertical, vertical, verticalStructure, Point(-1, -1));
//    dilate(vertical, vertical, verticalStructure, Point(-1, -1)); // expand vertical lines// Show extracted vertical linesimshow("vertical", vertical);
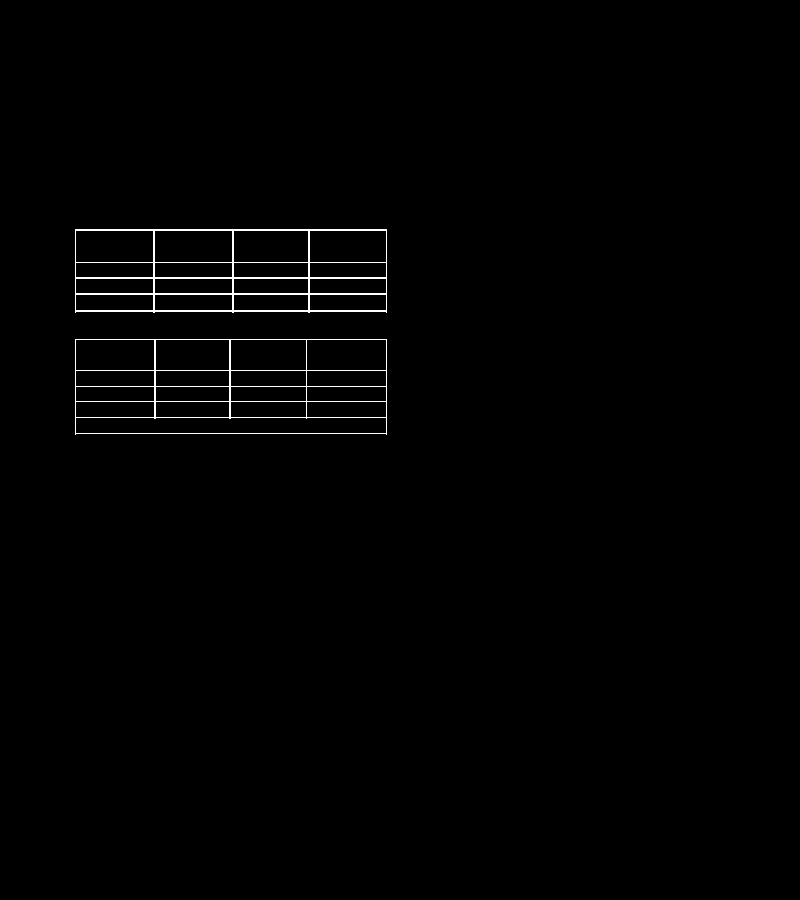
// create a mask which includes the tablesMat mask = horizontal + vertical;imshow("mask", mask);
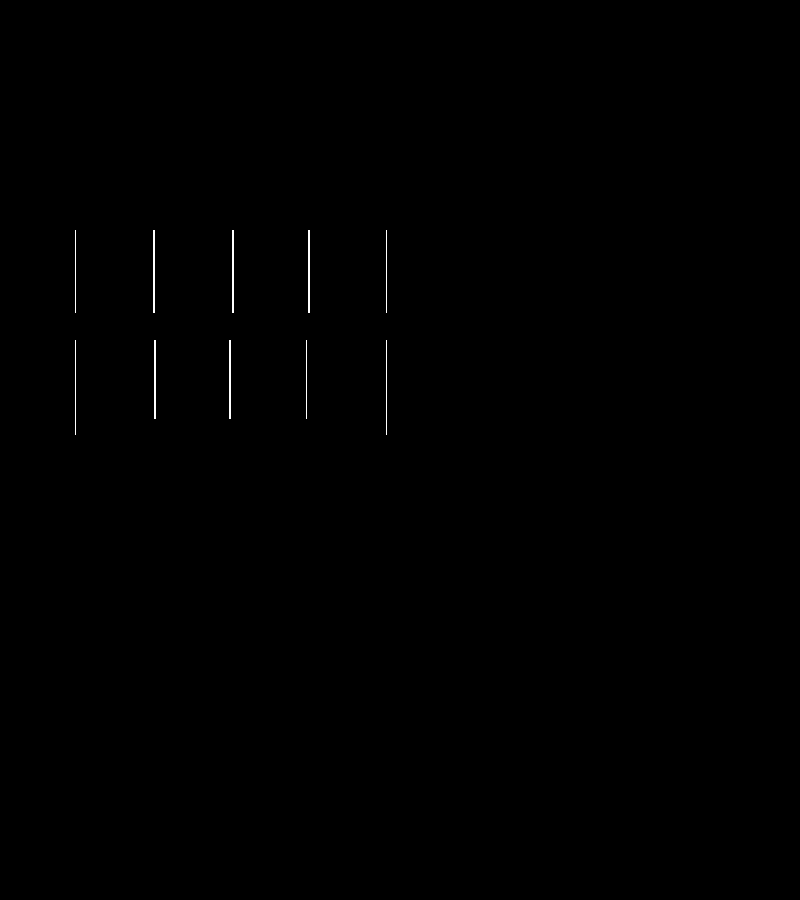
// find the joints between the lines of the tables, we will use this information in order to descriminate tables from pictures (tables will contain more than 4 joints while a picture only 4 (i.e. at the corners))Mat joints;bitwise_and(horizontal, vertical, joints);imshow("joints", joints);
// Find external contours from the mask, which most probably will belong to tables or to imagesvector<Vec4i> hierarchy;std::vector<std::vector<cv::Point> > contours;cv::findContours(mask, contours, hierarchy, CV_RETR_EXTERNAL, CV_CHAIN_APPROX_SIMPLE, Point(0, 0));vector<vector<Point> > contours_poly( contours.size() );vector<Rect> boundRect( contours.size() );vector<Mat> rois;for (size_t i = 0; i < contours.size(); i++){// find the area of each contourdouble area = contourArea(contours[i]);// // filter individual lines of blobs that might exist and they do not represent a tableif(area < 100) // value is randomly chosen, you will need to find that by yourself with trial and error procedurecontinue;approxPolyDP( Mat(contours[i]), contours_poly[i], 3, true );boundRect[i] = boundingRect( Mat(contours_poly[i]) );// find the number of joints that each table hasMat roi = joints(boundRect[i]);vector<vector<Point> > joints_contours;findContours(roi, joints_contours, RETR_CCOMP, CHAIN_APPROX_SIMPLE);// if the number is not more than 5 then most likely it not a tableif(joints_contours.size() <= 4)continue;rois.push_back(rsz(boundRect[i]).clone());// drawContours( rsz, contours, i, Scalar(0, 0, 255), CV_FILLED, 8, vector<Vec4i>(), 0, Point() );rectangle( rsz, boundRect[i].tl(), boundRect[i].br(), Scalar(0, 255, 0), 1, 8, 0 );}for(size_t i = 0; i < rois.size(); ++i){/* Now you can do whatever post process you want* with the data within the rectangles/tables. */imshow("roi", rois[i]);waitKey();}
imshow("contours", rsz);
    waitKey();return 0;
}
Of course you will need to try it by yourself and apply any modifications that might be needed depending on your dataset. Enjoy ;-).
这篇关于opencv3.0.0 识别表格的文章就介绍到这儿,希望我们推荐的文章对编程师们有所帮助!


