本文主要是介绍一个实时波形图的封装demo(QT)(qcustomplot),希望对大家解决编程问题提供一定的参考价值,需要的开发者们随着小编来一起学习吧!
前言:
封装的一个实时波形图的类,可以直接提升使用。 提供了接口,可以更改颜色,样式,等等
参考:
Qt Plotting Widget QCustomPlot - Introduction
另外参考了一个大神的作品,链接没找到。
项目文件:
123盘
123盘 实时波形图官方版下载丨最新版下载丨绿色版下载丨APP下载-123云盘
CSDN
【免费】一个实时波形图的封装demo(QT)(qcustomplot)资源-CSDN文库

源码
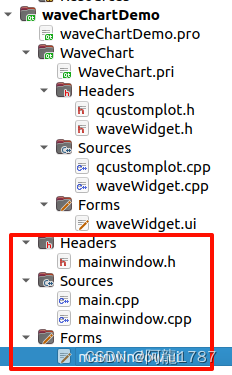
WaveChart文件夹:
1.加入文件qcustomplot.h 和 qcustomplot.cpp:
2.WaveChart.pri文件:
QT       += core gui
greaterThan(QT_MAJOR_VERSION, 4): QT += widgets printsupportFORMS += \$$PWD/waveWidget.uiHEADERS += \$$PWD/qcustomplot.h \$$PWD/waveWidget.hSOURCES += \$$PWD/qcustomplot.cpp \$$PWD/waveWidget.cpp
3.waveWidget.h文件:
#ifndef WAVEWIDGET_H
#define WAVEWIDGET_H#include <QWidget>
#include <QVBoxLayout>
#include <vector>
#include <cstring>
#include <numeric>
//#include <QScrollBar>
#include "qcustomplot.h"
using std::vector;
namespace Ui {
class WaveWidget;
}class WaveWidget : public QWidget
{Q_OBJECTpublic:explicit WaveWidget(QWidget *parent = nullptr);~WaveWidget();void init(bool isShowTicks=true, bool isShowTickLables=true, bool isShowGrid=true, bool isShowSubGrid=true, bool isShowAxis2=true, bool isGraphBigAndSmall=true);void setTheme(QColor axis, QColor background);void setXAxisLable(const char* name, const char* name2 = "");void setYAxisLable(const char* name, const char* name2 = "");void setPen(Qt::GlobalColor penColor, QCPGraph::LineStyle lineStyle = QCPGraph::lsLine, QColor brushColor = QColor(255,255, 255, 100), bool isShow = true);void addNewData(double data);void setTitle(const char* name);double getMax();double getMin();double getAverage();QCustomPlot*    getTheChartPlot();QCPGraph*       getTheGraph();vector<double>  &getTheVector();private:Ui::WaveWidget *ui;QCustomPlot*    chartPlot = new QCustomPlot(this);      // 图表QCPGraph*       graph;                                  // 曲线//QScrollBar      horizontalScrollBar;vector<double>  graphData;                              // 图表数据,只作记录使用int             timeRange = 10;                         // 时间轴范围QTime time;double          sum = 0.0;};#endif // WAVEWIDGET_H
4.waveWidget.cpp文件
#include "waveWidget.h"
#include "ui_waveWidget.h"WaveWidget::WaveWidget(QWidget *parent) :QWidget(parent),ui(new Ui::WaveWidget)
{ui->setupUi(this);// 初始化图表graph = chartPlot->addGraph();// graph->addData(1,1);// graph->addData(2,3);// 初始化设置// chartPlot->xAxis->setRange(1, 4096);// chartPlot->yAxis->setRange(-1, 350); // 假设灰度值的范围为0-255// chartPlot->xAxis->setLabel("Pixel");// chartPlot->yAxis->setLabel("Gray Value");QVBoxLayout* layout = new QVBoxLayout;layout->addWidget(ui->title);layout->addWidget(chartPlot);chartPlot->setSizePolicy(QSizePolicy::Policy(QSizePolicy::Preferred), QSizePolicy::Policy(QSizePolicy::Expanding));//layout->addWidget((QWidget)horizontalScrollBar);setLayout(layout);// init();}WaveWidget::~WaveWidget()
{delete ui;
}void WaveWidget::init(bool isShowTicks, bool isShowTickLables, bool isShowGrid, bool isShowSubGrid, bool isShowAxis2, bool isGraphBigAndSmall)
{time = QTime::currentTime();// 刻度显示chartPlot->xAxis->setTicks(isShowTicks);chartPlot->yAxis->setTicks(isShowTicks);// 刻度值显示chartPlot->xAxis->setTickLabels(isShowTickLables);chartPlot->yAxis->setTickLabels(isShowTickLables);// 网格显示chartPlot->xAxis->grid()->setVisible(isShowGrid);chartPlot->yAxis->grid()->setVisible(isShowGrid);// 子网格显示chartPlot->xAxis->grid()->setSubGridVisible(isShowSubGrid);chartPlot->yAxis->grid()->setSubGridVisible(isShowSubGrid);// 右和上坐标轴、刻度值显示chartPlot->xAxis2->setVisible(isShowAxis2);chartPlot->yAxis2->setVisible(isShowAxis2);chartPlot->yAxis2->setTicks(isShowAxis2);chartPlot->yAxis2->setTickLabels(isShowAxis2);// make top right axes clones of bottom left axes. Looks prettier:
//    chartPlot->axisRect()->setupFullAxesBox();// make left and bottom axes always transfer their ranges to right and top axes:if(isShowAxis2){connect(chartPlot->xAxis, SIGNAL(rangeChanged(QCPRange)), chartPlot->xAxis2, SLOT(setRange(QCPRange)));connect(chartPlot->yAxis, SIGNAL(rangeChanged(QCPRange)), chartPlot->yAxis2, SLOT(setRange(QCPRange)));}// 暗色主题//setPlotTheme(Qt::white, Qt::black);// 亮色主题setTheme(Qt::black, Qt::white);if(isGraphBigAndSmall){// 可放大缩小和移动chartPlot->setInteractions(QCP::iRangeDrag | QCP::iRangeZoom);}// x轴以时间形式显示QSharedPointer<QCPAxisTickerTime> timeTicker(new QCPAxisTickerTime);timeTicker->setTimeFormat("%h:%m:%s");chartPlot->xAxis->setTicker(timeTicker);chartPlot->axisRect()->setupFullAxesBox();chartPlot->replot();
}void WaveWidget::setTheme(QColor axis, QColor background)
{
//----------------------------------------------------------------------------------------//// 坐标标注颜色chartPlot->xAxis->setLabelColor(axis);chartPlot->yAxis->setLabelColor(axis);// 坐标刻度值颜色chartPlot->xAxis->setTickLabelColor(axis);chartPlot->yAxis->setTickLabelColor(axis);// 坐标基线颜色和宽度chartPlot->xAxis->setBasePen(QPen(axis, 1));chartPlot->yAxis->setBasePen(QPen(axis, 1));// 坐标主刻度颜色和宽度chartPlot->xAxis->setTickPen(QPen(axis, 1));chartPlot->yAxis->setTickPen(QPen(axis, 1));// 坐标子刻度颜色和宽度chartPlot->xAxis->setSubTickPen(QPen(axis, 1));chartPlot->yAxis->setSubTickPen(QPen(axis, 1));// 坐标标注颜色chartPlot->xAxis2->setLabelColor(axis);chartPlot->yAxis2->setLabelColor(axis);// 坐标刻度值颜色chartPlot->xAxis2->setTickLabelColor(axis);chartPlot->yAxis2->setTickLabelColor(axis);// 坐标基线颜色和宽度chartPlot->xAxis2->setBasePen(QPen(axis, 1));chartPlot->yAxis2->setBasePen(QPen(axis, 1));// 坐标主刻度颜色和宽度chartPlot->xAxis2->setTickPen(QPen(axis, 1));chartPlot->yAxis2->setTickPen(QPen(axis, 1));// 坐标子刻度颜色和宽度chartPlot->xAxis2->setSubTickPen(QPen(axis, 1));chartPlot->yAxis2->setSubTickPen(QPen(axis, 1));// 整个画布背景色chartPlot->setBackground(background);// 绘图区域背景色chartPlot->axisRect()->setBackground(background);// 刷新绘图chartPlot->replot();
}void WaveWidget::setXAxisLable(const char *name, const char* name2)
{chartPlot->xAxis->setLabel(name);if(strlen(name2)!=0)chartPlot->xAxis2->setLabel(name2);chartPlot->replot();
}void WaveWidget::setYAxisLable(const char *name, const char* name2)
{chartPlot->yAxis->setLabel(name);if(strlen(name2)!=0)chartPlot->yAxis2->setLabel(name2);chartPlot->replot();
}void WaveWidget::setPen(Qt::GlobalColor penColor, QCPGraph::LineStyle lineStyle, QColor brushColor, bool isShow)
{graph->setPen(QPen(penColor)); // 设置线条颜色为蓝色graph->setLineStyle(lineStyle); // 设置线型为直线graph->setVisible(isShow);chartPlot->graph()->setBrush(QBrush(brushColor));chartPlot->replot();
}void WaveWidget::addNewData(double data)
{// 系统当前时间 = 系统运行初始时间 + 系统运行时间static double start = time.hour()*60*60 + time.minute()*60 + time.second() + time.msec()/1000.0;double key = start + time.elapsed()/1000.0;// 设置时间轴chartPlot->xAxis->setRange(key, timeRange, Qt::AlignRight);//chartPlot->rescaleAxes();// 刷新绘图水平滚动条//horizontalScrollBar.setRange(int(start), int(key));  // 刷新滚动条的范围//horizontalScrollBar.setPageStep(1);                  // 设置翻页步长为 1s 的宽度//horizontalScrollBar.setValue(int(key));              // 调整滑块位置到最右边// 更新曲线绘图chartPlot->graph()->addData(key, data);chartPlot->replot(QCustomPlot::rpQueuedReplot);// 存储曲线的当前值graphData.push_back(data);sum += data;
}void WaveWidget::setTitle(const char *name)
{ui->title->setText(name);
}double WaveWidget::getMax()
{return *std::max_element(graphData.begin(),graphData.end());
}double WaveWidget::getMin()
{return *std::min_element(graphData.begin(),graphData.end());
}double WaveWidget::getAverage()
{return 1.0*sum/(graphData.size());
}QCustomPlot *WaveWidget::getTheChartPlot()
{return   chartPlot;
}QCPGraph *WaveWidget::getTheGraph()
{return  graph;
}vector<double> &WaveWidget::getTheVector()
{return graphData;
}
5.测试demo:
新建测试界面:
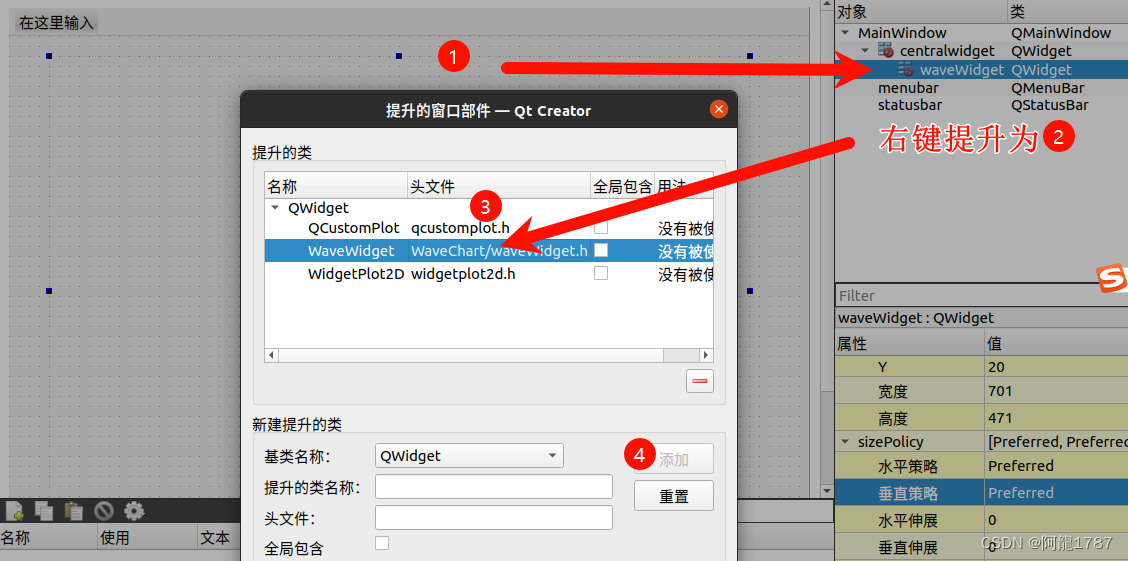
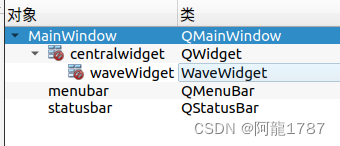
提升为刚刚的类:
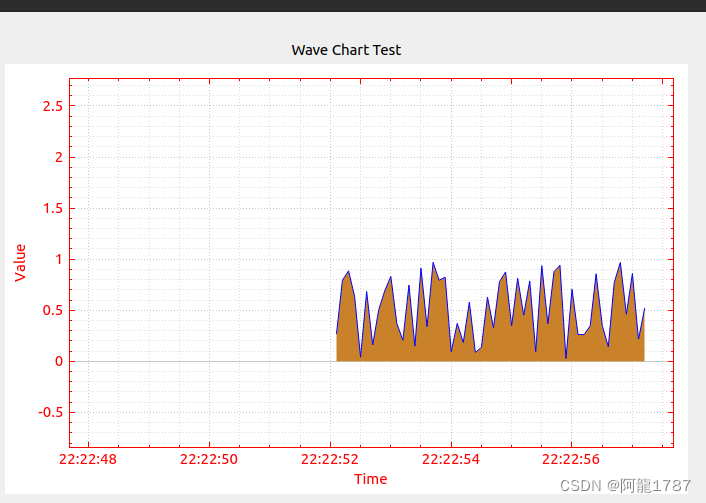
效果:
测试:
ui->setupUi(this);// 初始化:可以设置参数ui->waveWidget->init();// 可选设置:ui->waveWidget->setXAxisLable("Time");ui->waveWidget->setYAxisLable("Value");ui->waveWidget->setPen(Qt::blue, QCPGraph::lsLine, QColor( 36,141,218,255));ui->waveWidget->setTheme(Qt::red, Qt::white);ui->waveWidget->setTitle("Wave Chart Test");// 测试加入数据:QTimer *timer = new QTimer(this);connect(timer,&QTimer::timeout,[=](){ui->waveWidget->addNewData((qrand()%1000)/1000.0);qDebug()<<"max:"<<ui->waveWidget->getMax()<<" min:"<<ui->waveWidget->getMin()<<" average:"<<ui->waveWidget->getAverage();if(num%10==0){qDebug()<<"size: "<<ui->waveWidget->getTheVector().size();ui->waveWidget->getTheVector().clear();qDebug()<<"size: "<<ui->waveWidget->getTheVector().size()<<"********";}if(num>50){timer->stop();}num++;});timer->start(100);这篇关于一个实时波形图的封装demo(QT)(qcustomplot)的文章就介绍到这儿,希望我们推荐的文章对编程师们有所帮助!


