本文主要是介绍02 pycharts 结果生成为 html 、图片(示例代码+效果图),希望对大家解决编程问题提供一定的参考价值,需要的开发者们随着小编来一起学习吧!
目录
1、生成HTML
2 、生成图片
make_snapshot详解
1、生成HTML
# render 会生成本地 HTML 文件,默认会在当前目录生成 render.html 文件
# 也可以传入路径参数,如 bar.render("mycharts.html")
from pyecharts.charts import Bar
from pyecharts import options as optsbar = Bar() #单独调用
bar.add_xaxis(["语文", "数学", "英语", "生物", "物理", "化学", "地理"])
bar.add_yaxis("10月", [114, 95, 107, 81, 85, 87, 85])
bar.add_yaxis("11月", [106, 116, 125, 91, 88, 86, 87])
bar.add_yaxis("12月", [97, 134, 137, 89, 95, 93, 89])
bar.set_global_opts(title_opts=opts.TitleOpts(title="学生月考成绩", subtitle="马冬梅"))
bar.render()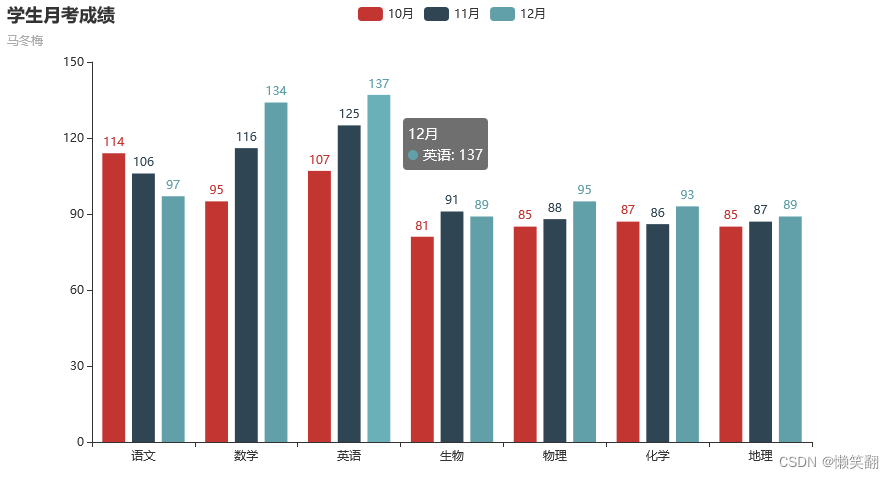
2、 生成图片
# 如果运行完当前目录图片没有出来,可以右键项目从磁盘重新加载 Reload from Disc
# 运行报错:
WebDriverException( selenium.common.exceptions.WebDriverException: Message: 'chromedriver' executable needs to be in PATH. Please see https://chromedriver.chromium.org/home
解决方法可以参考链接:https://blog.csdn.net/c_lanxiaofang/article/details/126001670
from snapshot_selenium import snapshot as driver
from pyecharts import options as opts
from pyecharts.charts import Bar
from pyecharts.render import make_snapshotdef bar_chart() -> Bar:c = (Bar().add_xaxis(["语文", "数学", "英语", "生物", "物理", "化学", "地理"]).add_yaxis("10月", [114, 95, 107, 81, 85, 87, 85]).add_yaxis("11月", [106, 116, 125, 91, 88, 86, 87]).add_yaxis("12月", [97, 134, 137, 89, 95, 93, 89]).reversal_axis()  # 翻转 XY 轴数据.set_series_opts(label_opts=opts.LabelOpts(position="right"))  # 将标签放置在图形右边.set_global_opts(title_opts=opts.TitleOpts(title="学生月考成绩", subtitle="马冬梅")) #title 主标题  subtitle副标题)return c# 需要安装 snapshot-selenium 或者 snapshot-phantomjs
make_snapshot(driver, bar_chart().render(), "学生月考成绩-马冬梅.png")  # 生成图片到当前文件夹下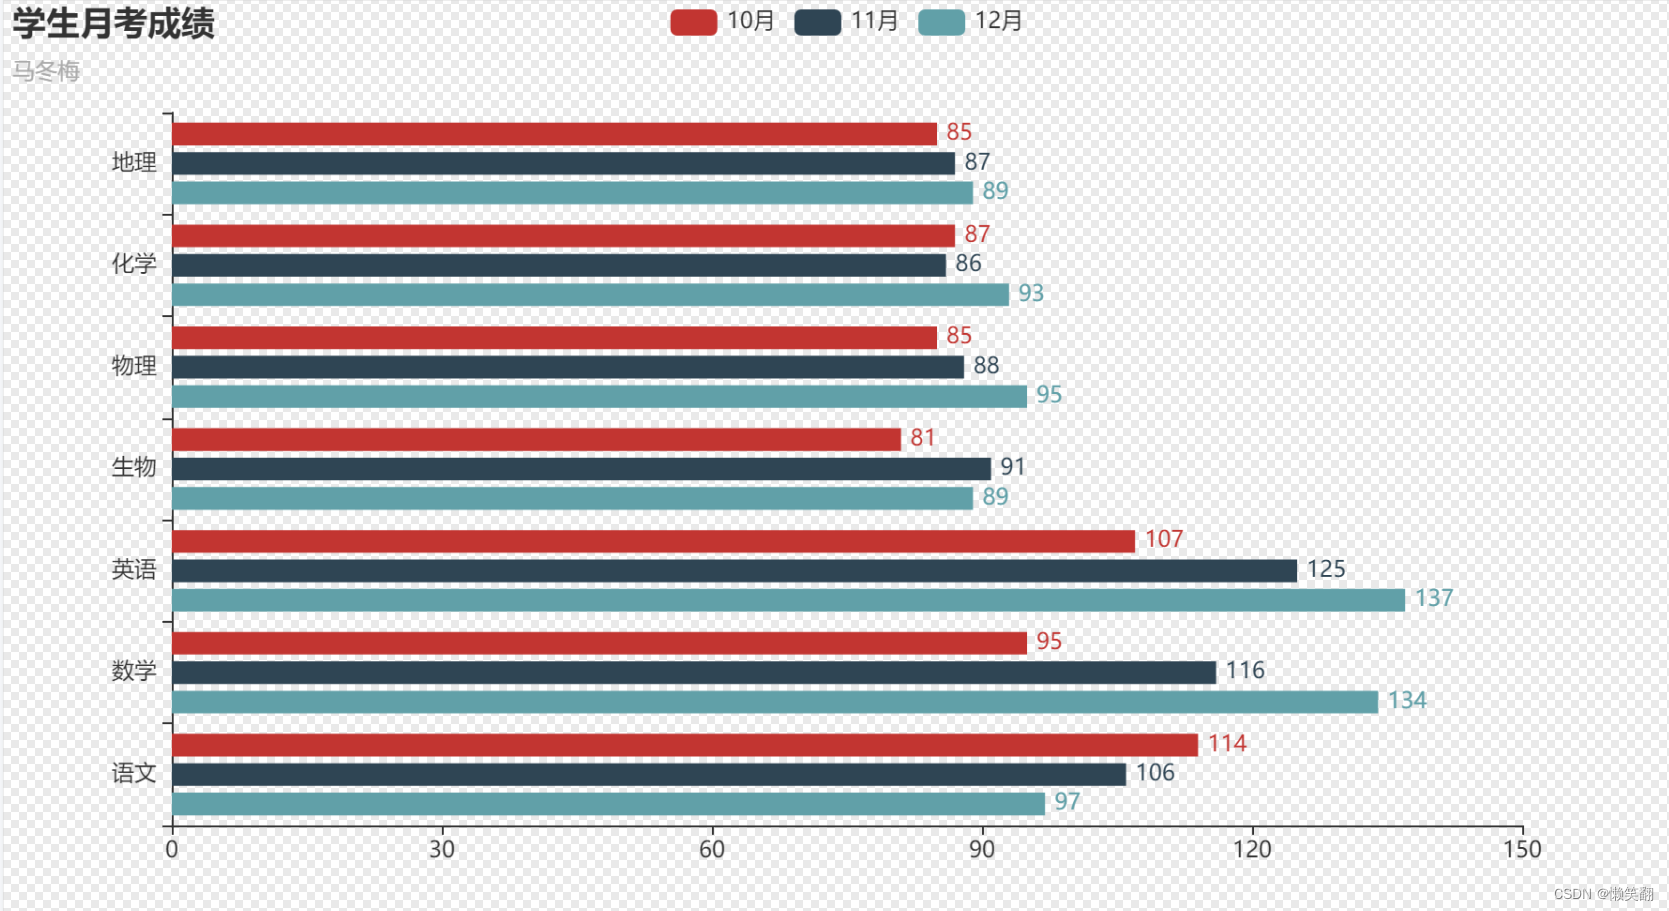
make_snapshot详解
PNG_FORMAT = "png"
JPG_FORMAT = "jpeg"
GIF_FORMAT = "gif"
PDF_FORMAT = "pdf"
SVG_FORMAT = "svg"
EPS_FORMAT = "eps"
B64_FORMAT = "base64"def make_snapshot(engine: Any,file_name: str,output_name: str,delay: float = 2,pixel_ratio: int = 2,is_remove_html: bool = False,**kwargs,
):logger.info("Generating file ...")file_type = output_name.split(".")[-1]content = engine.make_snapshot(html_path=file_name,file_type=file_type,delay=delay,pixel_ratio=pixel_ratio,**kwargs,)if file_type in [SVG_FORMAT, B64_FORMAT]:save_as_text(content, output_name)else:# pdf, gif, png, jpegcontent_array = content.split(",")if len(content_array) != 2:raise OSError(content_array)image_data = decode_base64(content_array[1])if file_type in [PDF_FORMAT, GIF_FORMAT, EPS_FORMAT]:save_as(image_data, output_name, file_type)elif file_type in [PNG_FORMAT, JPG_FORMAT]:save_as_png(image_data, output_name)else:raise TypeError(f"Not supported file type '{file_type}'")if "/" not in output_name:output_name = os.path.join(os.getcwd(), output_name)if is_remove_html and not file_name.startswith("http"):os.unlink(file_name)logger.info(f"File saved in {output_name}")
这篇关于02 pycharts 结果生成为 html 、图片(示例代码+效果图)的文章就介绍到这儿,希望我们推荐的文章对编程师们有所帮助!


