本文主要是介绍Python Matlab R的Mann-Kendall趋势检验,希望对大家解决编程问题提供一定的参考价值,需要的开发者们随着小编来一起学习吧!
Python Matlab R的Mann-Kendall趋势检验
水文气象中推荐使用Mann-Kendall趋势检验
这是一种非参数统计检验方法,在中心趋势不稳定时,关注数据的秩。
该方法不需要不需要满足正态分布的假设,因而具有普适性。
根据自己需要(图像、并行计算、线趋势图等等)分享python\matlab\R的方法
Python进行Mann-Kendall趋势检验
代码如下:
# -*- coding: utf-8 -*-from __future__ import division
import numpy as np
import pandas as pd
from scipy import stats
from scipy.stats import normdef mk_test(x, alpha=0.05):"""This function is derived from code originally posted by Sat Kumar Tomer(satkumartomer@gmail.com)See also: http://vsp.pnnl.gov/help/Vsample/Design_Trend_Mann_Kendall.htmThe purpose of the Mann-Kendall (MK) test (Mann 1945, Kendall 1975, Gilbert1987) is to statistically assess if there is a monotonic upward or downwardtrend of the variable of interest over time. A monotonic upward (downward)trend means that the variable consistently increases (decreases) throughtime, but the trend may or may not be linear. The MK test can be used inplace of a parametric linear regression analysis, which can be used to testif the slope of the estimated linear regression line is different fromzero. The regression analysis requires that the residuals from the fittedregression line be normally distributed; an assumption not required by theMK test, that is, the MK test is a non-parametric (distribution-free) test.Hirsch, Slack and Smith (1982, page 107) indicate that the MK test is bestviewed as an exploratory analysis and is most appropriately used toidentify stations where changes are significant or of large magnitude andto quantify these findings.Input:x:   a vector of dataalpha: significance level (0.05 default)Output:trend: tells the trend (increasing, decreasing or no trend)h: True (if trend is present) or False (if trend is absence)p: p value of the significance testz: normalized test statisticsExamples-------->>> x = np.random.rand(100)>>> trend,h,p,z = mk_test(x,0.05)"""n = len(x)# calculate Ss = 0for k in range(n - 1):for j in range(k + 1, n):s += np.sign(x[j] - x[k])# calculate the unique dataunique_x, tp = np.unique(x, return_counts=True)g = len(unique_x)# calculate the var(s)if n == g:  # there is no tievar_s = (n * (n - 1) * (2 * n + 5)) / 18else:  # there are some ties in datavar_s = (n * (n - 1) * (2 * n + 5) - np.sum(tp * (tp - 1) * (2 * tp + 5))) / 18if s > 0:z = (s - 1) / np.sqrt(var_s)elif s < 0:z = (s + 1) / np.sqrt(var_s)else:  # s == 0:z = 0# calculate the p_valuep = 2 * (1 - norm.cdf(abs(z)))  # two tail testh = abs(z) > norm.ppf(1 - alpha / 2)if (z < 0) and h:trend = 'decreasing'elif (z > 0) and h:trend = 'increasing'else:trend = 'no trend'return trend, h, p, zdf = pd.read_csv('../GitHub/statistic/Mann-Kendall/data.csv')
trend1, h1, p1, z1 = mk_test(df['data'])
上述代码太麻烦了,推荐使用pymannkendall包,只需要两行:
import pymannkendall as mk
result = mk.original_test(df['data'], alpha=0.05)
result
结果如图:

根据结果绘图(还是上述数据):
import matplotlib.pyplot as plt
import cmaps
import seaborn as sns
palette = cmaps.Cat12_r
plt.style.use('bmh')
plt.figure(figsize=(7, 5))
plt.plot(df['x'], df['data'], marker='', color='black', linewidth=2, alpha=0.9)
a = result[7]; b = result[8]; p = result[2]
y1 = a * (df['x'].values - 1979) + b
plt.plot(df['x'], y1, lw=2, color=palette(0))
plt.fill_between(df['x'], df['data'] - df['std'], df['data'] + df['std'], alpha=.2, linewidth=0)
plt.tick_params(labelsize=20)
sns.set_theme(font='Times New Roman')
plt.text(1981, 80*9/10, 'Mann-Kendall', fontweight='heavy', color=palette(2), fontsize=30)
plt.text(1981, 80*8/10, 'slope:'+str(a)[0:5]+' p:'+str(p)[0:5], color=palette(0), fontsize=30)
plt.xlim(1980, 2018)
plt.ylim(0, 80)

Matlab的Mann-Kendall趋势
求一个序列的趋势,首先把x和y合成n×2的ts矩阵
再应用ktaub代码,可以把ktaub.m放到当前目录,推荐加到环境变量
tb = csvread('data.csv', 1, 0);
[m, n] = size(tb);
ts1 = [1:m]';
ts2 = tb(:,2);
ts = [ts1,ts2];
[taub tau h sig Z S sigma sen] = ktaub(ts, 0.05)
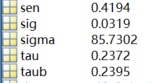
这是求多年图像Mann-Kendall趋势的方法
% 利用Mann-Kendall方法计算NDVI的年际趋势
% load('H:\MODIS_WUE\NH_20171009\gimms3gv1\ndvi_season.mat', 'ndvi_spring')
% load('H:\MODIS_WUE\NH_20171009\boundary\mask_pft.mat', 'mask_pft')
[m,n,z] = size(GPP_modfix);
slope_GPPmodfix = nan(m,n);
p_GPPmodfix = nan(m,n);
for i = 1:mfor j = 1:n
%         if isnan(mask_pft(i,j))
%             continue
%         endts1 = [1:z]';ts2 = permute(GPP_modfix(i,j,:),[3 1 2]);k = find(~isnan(ts2));ts1 = ts1(k);ts2 = ts2(k);ts = [ts1,ts2];if ~isnan(ts)[taub tau h sig Z S sigma sen] = ktaub(ts,0.05);slope_GPPmodfix(i,j) = sen;p_GPPmodfix(i,j) = sig;endend
end
完整代码见文末
R的Mann-Kendall趋势
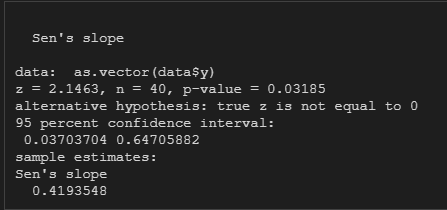
R是利用trend包中的sens.slope方法,同样这个包还提供了检验。
library(tidyverse)
library(trend)
df = read.csv('D:/OneDrive/GitHub/statistic/Mann-Kendall/data.csv')
y <- as.numeric(unlist(df['data']))
sens.slope(as.vector(data$y), conf.level = 0.95)
本文由mdnice多平台发布
这篇关于Python Matlab R的Mann-Kendall趋势检验的文章就介绍到这儿,希望我们推荐的文章对编程师们有所帮助!


