本文主要是介绍MySQL 全文索引触发 OOM 一例,希望对大家解决编程问题提供一定的参考价值,需要的开发者们随着小编来一起学习吧!
业务监控告警内存不足,笔者进行了全面系统的故障分析并给出解决方案。
作者:付祥,现居珠海,主要负责 Oracle、MySQL、mongoDB 和 Redis 维护工作。
爱可生开源社区出品,原创内容未经授权不得随意使用,转载请联系小编并注明来源。
本文约 1700 字,预计阅读需要 6 分钟。
MySQL 版本 5.7.34
故障现象
某业务监控报警内存不足,发现 mysqld 进程由于内存不足被 kill 自动重启了。
[root@xxxxxx ~]# ps -ef|grep mysqld
root     17117 62542  0 20:26 pts/1    00:00:00 grep --color=auto mysqld
mysql    27799     1  7 09:54 ?        00:48:32 /usr/sbin/mysqld --daemonize --pid-file=/var/run/mysqld/mysqld.pid
[root@xxxxxx ~]## 操作系统日志记录 MySQL 被 OOM
Dec  8 09:54:42 xxxxxx kernel: Out of memory: Kill process 22554 (mysqld) score 934 or sacrifice child
Dec  8 09:54:42 xxxxxx kernel: Killed process 22554 (mysqld), UID 27, total-vm:11223284kB, anon-rss:7444620kB, file-rss:0kB, shmem-rss:0kB
故障分析
机器总内存 8G,还有其他应用占用了少许内存。尽管 MySQL 重启了,使用内存依然很高,内存监控数据如下:
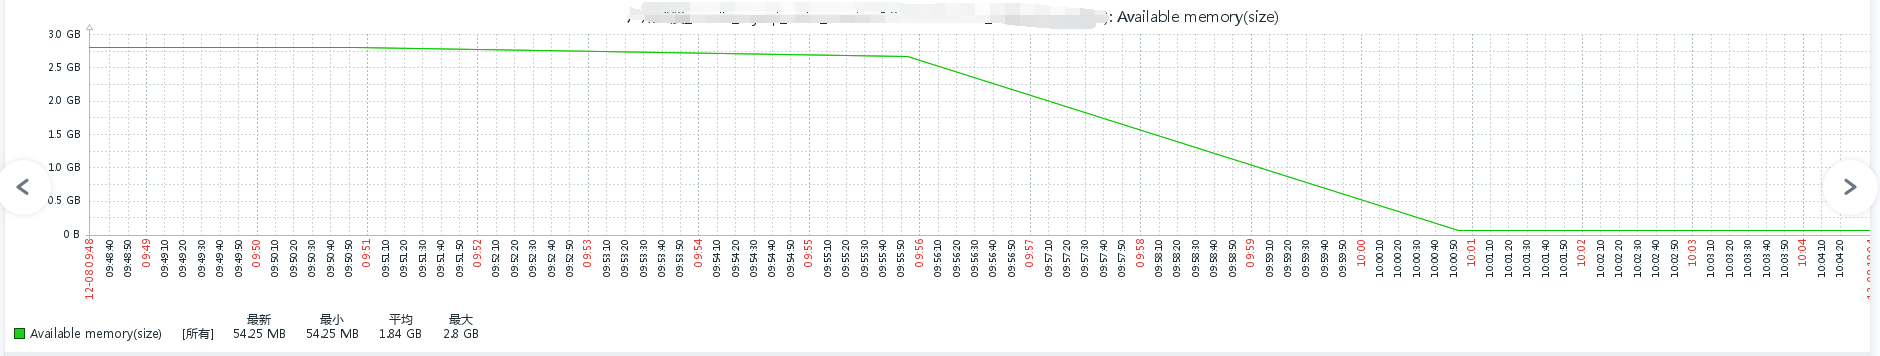
有效内存并不是一点一点的减少,而是突然下降的。内存监控数据是 5 分钟采集一次,MySQL 在 09:54 重启后,09:55:54 采样有效内存是 2869899264 字节,10:00:54 采集降低至 56885248 字节。
2023-12-08 10:20:54
963796992
2023-12-08 10:15:54
93224960
2023-12-08 10:10:54
111407104
2023-12-08 10:05:54
113987584
2023-12-08 10:00:54
56885248
2023-12-08 09:55:54
2869899264
InnoDB Buffer 分配的内存为 1G:
| innodb_buffer_pool_size | 1073741824 |top 查看 MySQL 当前使用了 6GB 内存:
27799 mysql 20 0 8888376 6.1g 6120 S 26.2 80.5 30:19.01 mysqld通过 gdb 调用 malloc_stats() 函数查看内存分配情况:
gdb -ex "call (void) malloc_stats()" --batch -p $(pidof mysqld)查看 MySQL 日志:
MALLOC:      853070392 (  813.6 MiB) Bytes in use by application
MALLOC: +   6369394688 ( 6074.3 MiB) Bytes in page heap freelist
MALLOC: +      9771872 (    9.3 MiB) Bytes in central cache freelist
MALLOC: +       863232 (    0.8 MiB) Bytes in transfer cache freelist
MALLOC: +     25216616 (   24.0 MiB) Bytes in thread cache freelists
MALLOC: +     25559040 (   24.4 MiB) Bytes in malloc metadata
MALLOC:   ------------
MALLOC: =   7283875840 ( 6946.4 MiB) Actual memory used (physical + swap)
MALLOC: +    329924608 (  314.6 MiB) Bytes released to OS (aka unmapped)
MALLOC:   ------------
MALLOC: =   7613800448 ( 7261.1 MiB) Virtual address space used
MALLOC:
MALLOC:          12564              Spans in use
MALLOC:             52              Thread heaps in use
MALLOC:           8192              Tcmalloc page size
------------------------------------------------
Call ReleaseFreeMemory() to release freelist memory to the OS (via madvise()).
Bytes released to the OS take up virtual address space but no physical memory.
MySQL 当前使用 Tcmalloc 内存分配器,Bytes in page heap freelist 使用了将近 6GB 内存,猜测是有什么操作比较吃内存,操作完后 MySQL 释放了内存。但是 Tcmalloc 并没有将内存释放给操作系统,那到底是什么操作比较吃内存呢?分析相关时间段慢 SQL,发现有一个使用全文索引 SQL 比较可疑:
# Time: 2023-12-08T01:52:23.084854Z
# User@Host: xxxxxx @  [x.x.x.x]  Id: 259892877
# Query_time: 1.436714  Lock_time: 0.000049 Rows_sent: 1  Rows_examined: 0
SET timestamp=1702000343;
SELECT count(*) FROM `xx` inner JOIN (select id from xx_content  where  MATCH(content) AGAINST('\"Elasticsearch Cluster in 1 state\"' IN BOOLEAN MODE)) al ON xx.id = al.id WHERE (xx.handle_status in ('pending','processing','completed')) AND `xx`.`sub_type` = 1;
# Time: 2023-12-08T01:52:24.540847Z
# User@Host: xxxxxx @  [x.x.x.x]  Id: 259892879
# Query_time: 1.454352  Lock_time: 0.000052 Rows_sent: 0  Rows_examined: 0
SET timestamp=1702000344;
SELECT xx.*,SUBSTRING(xx.content, 1, 1024) as content,SUBSTRING(xx.sub_content, 1, 1024) as sub_content FROM `xx` inner JOIN (select id from xx_content  where  MATCH(content) AGAINST('\"Elasticsearch Cluster in 1 state\"' IN BOOLEAN MODE)) al ON xx.id = al.id WHERE (xx.handle_status in ('pending','processing','completed')) AND `xx`.`sub_type` = 1 ORDER BY xx.sub_time DESC LIMIT 50;
# Time: 2023-12-08T01:53:26.546353Z
# User@Host: xxxxxx @  [x.x.x.x]  Id: 259893335
# Query_time: 44.198100  Lock_time: 0.000041 Rows_sent: 1  Rows_examined: 48
SET timestamp=1702000406;
SELECT count(*) FROM `xx` inner JOIN (select id from xx_content  where  MATCH(content) AGAINST('\"Elasticsearch Cluster in \"' IN BOOLEAN MODE)) al ON xx.id = al.id WHERE (xx.handle_status in ('pending','processing','completed')) AND `xx`.`sub_type` = 1;
73
# Time: 2023-12-08T01:56:35.790820Z
# User@Host: xxxxxx @  [x.x.x.x]  Id:  1671
# Query_time: 29.259303  Lock_time: 0.000042 Rows_sent: 1  Rows_examined: 48
SET timestamp=1702000595;
SELECT count(*) FROM `xx` inner JOIN (select id from xx_content  where  MATCH(content) AGAINST('\"Elasticsearch Cluster in \"' IN BOOLEAN MODE)) al ON xx.id = al.id WHERE (xx.handle_status = 'pending') AND `xx`.`sub_type` = 1;
# Time: 2023-12-08T01:56:36.350983Z
# User@Host: xxxxxx @  [x.x.x.x]  Id:  1672
# Query_time: 28.870504  Lock_time: 0.000050 Rows_sent: 1  Rows_examined: 48
SET timestamp=1702000596;
SELECT count(*) FROM `xx` inner JOIN (select id from xx_content  where  MATCH(content) AGAINST('\"Elasticsearch Cluster in \"' IN BOOLEAN MODE)) al ON xx.id = al.id WHERE (xx.handle_status in ('pending','processing','completed')) AND `xx`.`sub_type` = 1;
表结构及数据量如下:
root@3306 xxxxxx> show create table xx_content\G
*************************** 1. row ***************************Table: xx_content
Create Table: CREATE TABLE `xx_content` (`id` bigint(20) NOT NULL AUTO_INCREMENT,`content` longtext,PRIMARY KEY (`id`),FULLTEXT KEY `ngram_content` (`content`) /*!50100 WITH PARSER `ngram` */
) ENGINE=InnoDB AUTO_INCREMENT=100377976 DEFAULT CHARSET=utf8mb4
1 row in set (0.00 sec)root@3306 xxxxxx> select count(*) from xx_content;
+----------+
| count(*) |
+----------+
|   360215 |
+----------+
1 row in set (0.11 sec)
全文索引相关参数均采用默认配置:
root@3306 (none)> show variables like '%ft%';
+---------------------------------+----------------+
| Variable_name                   | Value          |
+---------------------------------+----------------+
| ft_boolean_syntax               | + -><()~*:""&| |
| ft_max_word_len                 | 84             |
| ft_min_word_len                 | 4              |
| ft_query_expansion_limit        | 20             |
| ft_stopword_file                | (built-in)     |
| innodb_ft_aux_table             |                |
| innodb_ft_cache_size            | 8000000        |
| innodb_ft_enable_diag_print     | OFF            |
| innodb_ft_enable_stopword       | ON             |
| innodb_ft_max_token_size        | 84             |
| innodb_ft_min_token_size        | 3              |
| innodb_ft_num_word_optimize     | 2000           |
| innodb_ft_result_cache_limit    | 2000000000     |
| innodb_ft_server_stopword_table |                |
| innodb_ft_sort_pll_degree       | 2              |
| innodb_ft_total_cache_size      | 640000000      |
| innodb_ft_user_stopword_table   |                |
+---------------------------------+----------------+
17 rows in set (0.01 sec)
SQL 分别在 9:53 和 9:56 执行,正好在 MySQL 自动重启前后,和内存监控数据比较吻合(9:53 执行,9:54 机器内存不足 MySQL 被 OOM;9:56 执行后,10:00:54 采集降低至 56885248 字节)。这个环境还有一个从库,从库未承载业务,将 SQL 拿到从库执行,观察 MySQL 内存使用变化,开 2 个窗口,1 个窗口执行 SQL:
root@3306 xxxxxx> SELECT count(*) FROM `xx` inner JOIN (select id from xx_content  where  MATCH(content) AGAINST('\"Elasticsearch Cluster in 1 state\"' IN BOOLEAN MODE)) al ON xx.id = al.id WHERE (xx.handle_status in ('pending','processing','completed')) AND `xx`.`sub_type` = 1;
+----------+
| count(*) |
+----------+
|        3 |
+----------+
1 row in set (1 min 9.31 sec)
另一个窗口观察 mysqld 进程内存使用情况:
[root@xxxxxx ~]# ps aux|grep mysqld|grep -v grep|awk '{print $6}'
3453980
[root@xxxxxx ~]# while true;do ps aux|grep mysqld|grep -v grep|awk '{print $6}';sleep 1;done;
3453980
3453980
3453980
3453980
3453980
3453980
3453980
3453980
3453980
3453980
3453980
3453980
3453980
3453980
3453980
3453980
3453980
3453980
3453980
3453980
3453980
3453980
3453980
3453980
3453980
3453980
3453980
3453980
3453980
3453980
3453980
3453980
3453980
3453980
3453980
3453980
3459064
3617600
3822828
3969212
4128056
4533612
4677028
4756868
4844452
5011176
5070292
5123844
5188556
5263880
5410368
5410368
5412200
5412200
5412200
5412200
5412200
5412200
5412200
5412200
5412200
5412200
5412200
5412200
5412200
5412200
5412200
5412200
5412200
5412200
5412200
5412200
5412200
可以观察到 SQL 执行过程中,内存不断上涨,SQL 执行完后内存从 3453980 KB 涨到 5412200KB,但是 Tcmalloc 并没有将内存释放给操作系统。
到目前为止,总算定位到了问题,MySQL 并不擅长全文索引,可以交给 ElasticSearch 等数据库去做,那在业务不调整情况下,怎么解决问题呢?不妨换 Jemalloc 内存分配器试试:
[root@xxxxxx ~]# yum install -y jemalloc
[root@xxxxxx ~]# cat /etc/sysconfig/mysql
#LD_PRELOAD=/usr/lib64/libtcmalloc.so
LD_PRELOAD=/usr/lib64/libjemalloc.so.1
[root@xxxxxx ~]# systemctl restart mysqld
果然有惊喜,SQL 执行完后会释放内存,从 822948KB 涨到 2738040KB,最终回落到 916400KB:
[root@xxxxxx ~]# while true;do ps aux|grep mysqld|grep -v grep|awk '{print $6}';sleep 1;done;
822948
822948
822948
822948
822948
822948
822948
822948
822948
822948
822948
822948
822948
822948
874216
1057240
1273684
1443820
1662924
1873304
2177760
2502488
2738040
1296604
899580
900636
902412
903680
904384
......
914492
914492
915020
915284
915736
916524
916524
916524
916524
916524
916400
916400
916400
916400
916400
916400
916400
916400
916400
总结
线上 MySQL 都是使用 Tcmalloc 内存分配器一直很稳定,并未出现服务器内存不足问题。本次出现服务器内存不足,是因为使用了全文索引这种极少使用的场景触发,换成 Jemalloc 后,内存使用整体上得到了控制。
更多技术文章,请访问:https://opensource.actionsky.com/
关于 SQLE
SQLE 是一款全方位的 SQL 质量管理平台,覆盖开发至生产环境的 SQL 审核和管理。支持主流的开源、商业、国产数据库,为开发和运维提供流程自动化能力,提升上线效率,提高数据质量。
SQLE 获取
| 类型 | 地址 |
|---|---|
| 版本库 | https://github.com/actiontech/sqle |
| 文档 | https://actiontech.github.io/sqle-docs/ |
| 发布信息 | https://github.com/actiontech/sqle/releases |
| 数据审核插件开发文档 | https://actiontech.github.io/sqle-docs/docs/dev-manual/plugins/howtouse |
这篇关于MySQL 全文索引触发 OOM 一例的文章就介绍到这儿,希望我们推荐的文章对编程师们有所帮助!


