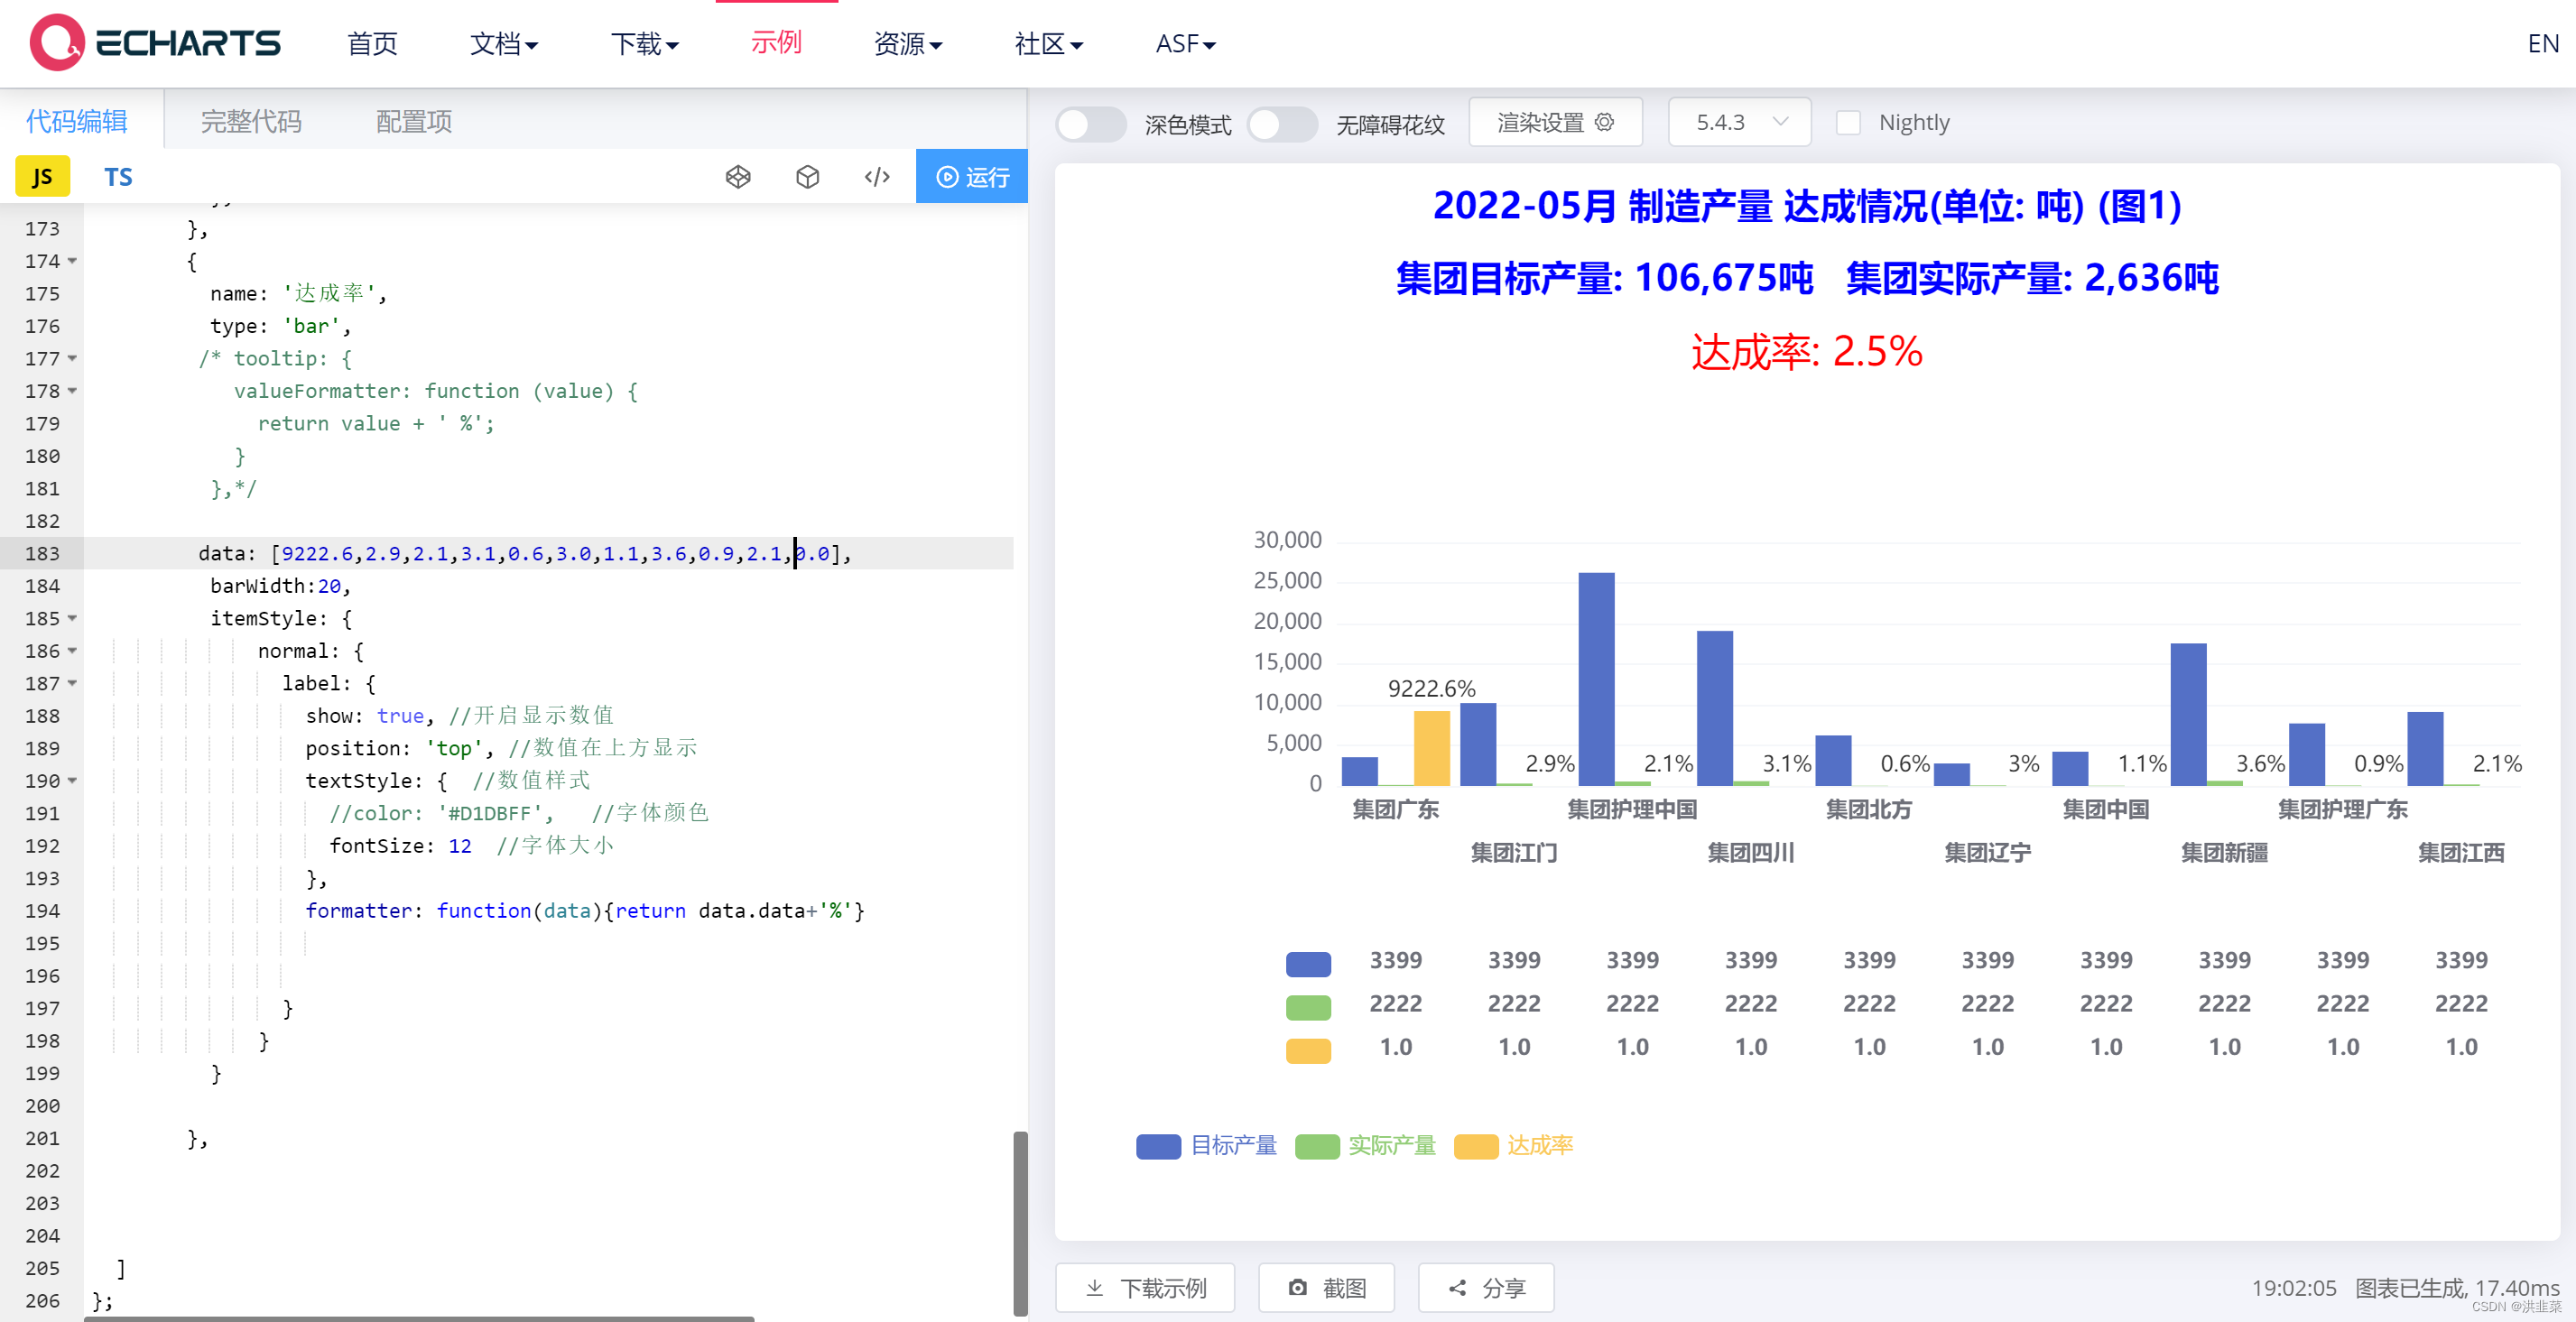
本文主要是介绍使用echarts制作柱状图并且下方带表格,希望对大家解决编程问题提供一定的参考价值,需要的开发者们随着小编来一起学习吧!
实现效果:

调试地址:
Examples - Apache ECharts
源码:
option = {
title: {
left: 'center',
top: '0',
text: '2022-05月 制造产量 达成情况(单位: 吨) (图1)\n\n集团目标产量: 106,675吨 集团实际产量: 2,636吨',
textStyle:{
fontSize:20,
color: 'blue'
},
subtext: '达成率: 2.5%',
subtextStyle:{
fontSize:22,
color: 'red'
},
itemGap: 20
},
tooltip: {
trigger: 'axis',
axisPointer: {
type: 'cross'
}
},
grid: {
top: '200',
left: '100',
right: '12',
bottom: '90',
containLabel: true
},
legend: [
{
textStyle: { color:'bule'},
data: ['目标产量', '实际产量', '达成率'],
bottom: 30,
left: 30
},
{
align: 'right',
itemGap: 10,//这里是调整底部 底部表格 字段说明的间距
orient: 'vertical',
textStyle: { color: '' },
bottom: 83,
left: 60,
data: ['目标产量', '实际产量', '达成率']
}
],
xAxis: //[
{
type: 'category',
data: [
'集团广东\n\n\n\n\n\n\n3399\n\n2222\n\n1.0',
'\n\n集团江门\n\n\n\n\n3399\n\n2222\n\n1.0',
'集团护理中国\n\n\n\n\n\n\n3399\n\n2222\n\n1.0',
'\n\n集团四川\n\n\n\n\n3399\n\n2222\n\n1.0',
'集团北方\n\n\n\n\n\n\n3399\n\n2222\n\n1.0',
'\n\n集团辽宁\n\n\n\n\n3399\n\n2222\n\n1.0',
'集团中国\n\n\n\n\n\n\n3399\n\n2222\n\n1.0',
'\n\n集团新疆\n\n\n\n\n3399\n\n2222\n\n1.0',
'集团护理广东\n\n\n\n\n\n\n3399\n\n2222\n\n1.0',
'\n\n集团江西\n\n\n\n\n3399\n\n2222\n\n1.0'
],
axisPointer: {
type: 'shadow'
},
axisTick: {
show: false
},
axisLine: {
show: true,
lineStyle: {
//color: '#93ECFE',
opacity: 0,
}
},
axisLabel: {
interval: 0, //这里是调整底部表格数据的间距
rotate: 0,
fontSize: 12,
fontWeight: 'bold',
/*formatter(value, index) {
if (index % 2 != 0) {
return `\n\n集团护理中国\n\n\n\n3540吨\n\n129吨\n\n3.6%`; //这里需要动态赋值 java处理
} else {
return `集团护理中国\n\n\n\n\n\n3540吨\n\n129吨\n\n3.6%`; //这里需要动态赋值 java处理
}
},*/
/* formatter: function(value, index) {
if (index % 2 != 0) {
return `\n\n集团护理中国\n\n\n\n3540吨\n\n129吨\n\n3.6%`;
} else {
return `集团护理中国\n\n\n\n\n\n3540吨\n\n129吨\n\n3.6%`;
}
},*/
//formatter:"{a}<br/>{b}{c}",
rich: {
table: {
lineHeight: 35,
align: 'center',
//color: '#fff'
}
}
}
},
//],
yAxis:
{
type: 'value',
//name: '营业/利润',
//interval: 50, //Y轴刻度
axisLabel: {
//color: '#fff',
formatter: '{value}'
},
splitLine: {
show: true,
lineStyle: {
//color: '#93ECFE',
opacity: 0.3
}
}
}
,
series: [
{
name: '目标产量',
type: 'bar',
barGap: 0, // 这里是设置多个柱状图形的间距
barWidth: 0,
/*tooltip: {
valueFormatter: function (value) {
//return value + ' 吨';
return value;
}
},*/
data: [3540,10207,26255,19087,6225,2773,4219,17553,7700,9116,0],
barWidth:20
},
{
name: '实际产量',
type: 'bar',
/*tooltip: {
valueFormatter: function (value) {
//return value + ' 吨';
return value;
}
},*/
data: [129,300,550,593,40,83,46,632,73,191,0],
barWidth:20,
itemStyle: {
/*normal: {
barBorderRadius: [10, 10, 10, 10],
}*/
},
},
{
name: '达成率',
type: 'bar',
/* tooltip: {
valueFormatter: function (value) {
return value + ' %';
}
},*/
data: [9222.6,2.9,2.1,3.1,0.6,3.0,1.1,3.6,0.9,2.1,0.0],
barWidth:20,
itemStyle: {
normal: {
label: {
show: true, //开启显示数值
position: 'top', //数值在上方显示
textStyle: { //数值样式
//color: '#D1DBFF', //字体颜色
fontSize: 12 //字体大小
},
formatter: function(data){return data.data+'%'}
}
}
}
},
]
};
觉得不错请点赞收藏
这篇关于使用echarts制作柱状图并且下方带表格的文章就介绍到这儿,希望我们推荐的文章对编程师们有所帮助!


