本文主要是介绍echarts 实现饼图pie渐变色显示,希望对大家解决编程问题提供一定的参考价值,需要的开发者们随着小编来一起学习吧!
实现效果
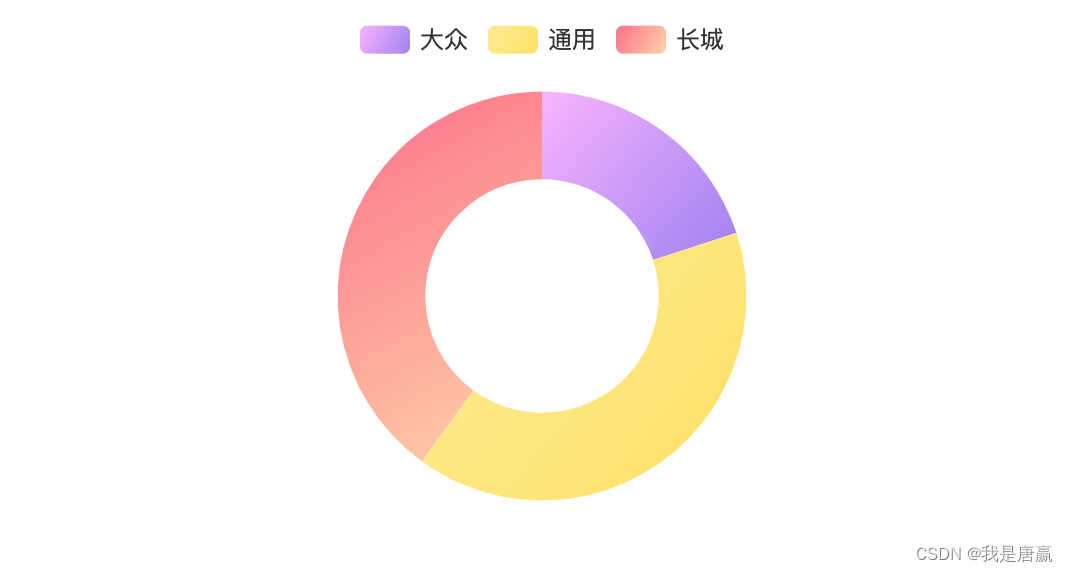
代码
option = {tooltip: {trigger: 'item'},legend: {top: '2%',left: 'center',},series: [{name: '产品结构',type: 'pie',radius: ['40%', '70%'],avoidLabelOverlap: false,label: {show: false,position: 'center'},emphasis: {label: {show: true,fontSize: '40',fontWeight: 'bold'}},labelLine: {show: false},data: [{"name":"大众", value:10},{"name":"通用", value:20},{"name":"长城", value:20}],itemStyle: {normal: {color: function (params) {var colorList = [['#fab2ff','#9f7ef4'],['#ffeb90','#ffe25c'],['#fe6f88','#ffd3a5'],];var index = params.dataIndex;return new echarts.graphic.LinearGradient(0, 0, 1, 1,[{offset: 0,color: colorList[index][0]},{offset: 1,color: colorList[index][1]}]);}}}}]};查看效果地址:
将内容复制到在左边的参数栏
Examples - Apache ECharts
这篇关于echarts 实现饼图pie渐变色显示的文章就介绍到这儿,希望我们推荐的文章对编程师们有所帮助!


