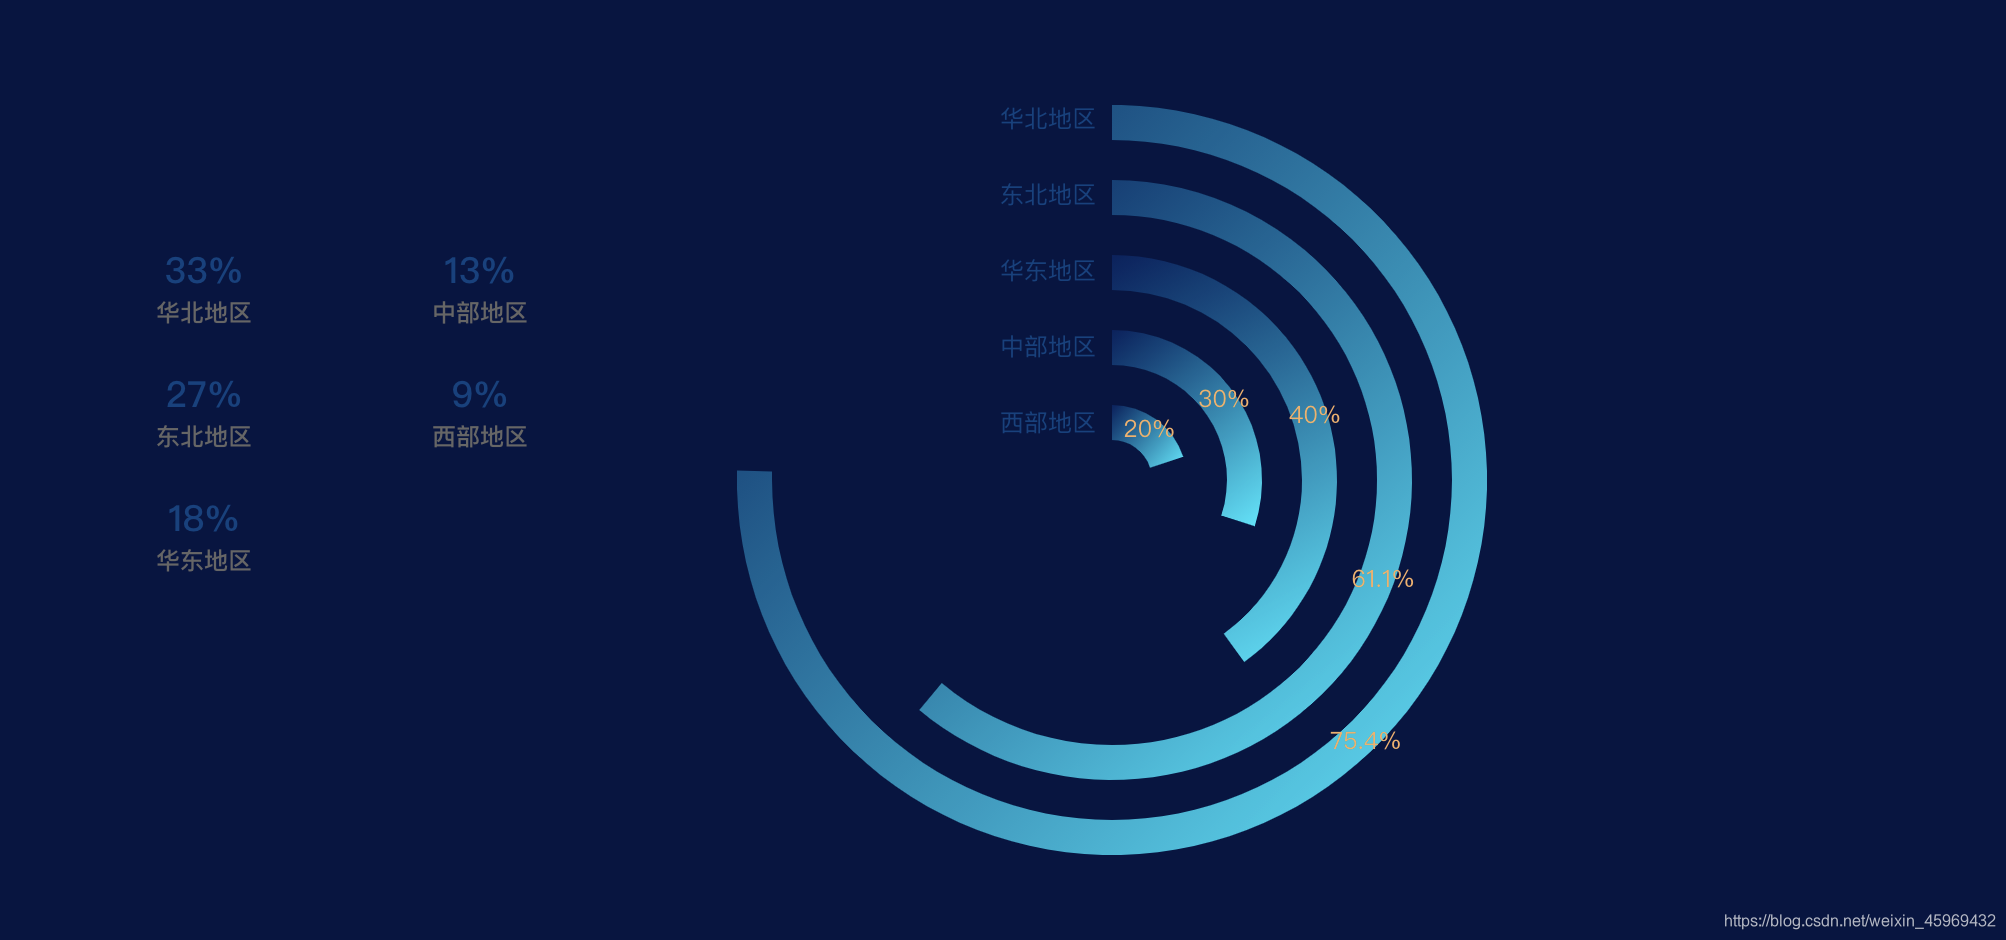
本文主要是介绍Echarts多层同心圆,希望对大家解决编程问题提供一定的参考价值,需要的开发者们随着小编来一起学习吧!
效果:
代码
<template><div><div class="chart" ref="preChart"></div></div>
</template><script>
import echarts from 'echarts'
export default {data() {return {}},mounted() {this.drawPieChart()},methods: {drawPieChart() {let chartData = [{ name: '华北地区', value: 754 },{ name: '东北地区', value: 611 },{ name: '华东地区', value: 400 },{ name: '中部地区', value: 300 },{ name: '西部地区', value: 200 },]let total = chartData.reduce((a, b) => {return a + b.value}, 0)let optionData = getData(chartData)function getData(data) {var res = {series: [],yAxis: [],}for (let i = 0; i < chartData.length; i++) {res.series.push({name: '',type: 'pie',clockWise: true, // 顺时针加载hoverAnimation: false, // 鼠标移入变大radius: [75 - i * 15 + '%', 68 - i * 15 + '%'],center: ['50%', '50%'], // 图标位置label: {show: true,formatter: '{d}%',color: 'RGB(246,175,101)',fontSize: 12,position: 'inside',},data: [{value: chartData[i].value,name: chartData[i].name,},{value: 1000 - chartData[i].value,name: chartData[i].name,itemStyle: {color: 'rgba(0,0,0,0)',borderWidth: 0,},tooltip: {show: false,},label: {show: false,},hoverAnimation: false,},],})res.yAxis.push(chartData[i].name)}return res}let option = {backgroundColor: 'RGB(8,20,67)',color: [{type: 'linear',x: 0,y: 0,x2: 1,y2: 1,colorStops: [{offset: 0,color: 'rgba(10,31,95,1)',},{offset: 1,color: 'rgba(1,232,254,1)',},],global: false,},],legend: [{orient: 'vertical',icon: 'none',left: '8%',top: '25%',align: 'center',itemGap: 20,formatter: function(name) {let res = chartData.filter((v) => v.name === name)let percent = ((res[0].value * 100) / total).toFixed(0)return '{a|' + percent + '%}' + '\n' + '{b|' + name + '}'},textStyle: {rich: {a: {fontSize: 18,fontWeight: 500,lineHeight: 30,color: 'RGB(12,64,128)',},b: {fontSize: 12,fontWeight: 500,color: '#666666',},},},data: chartData.slice(0, 3),},{orient: 'vertical', // 图例以列的形式展示icon: 'none',left: '20%',top: '25%',align: 'center',itemGap: 20,formatter: function(name) {let res = chartData.filter((v) => v.name === name)let percent = ((res[0].value * 100) / total).toFixed(0)return '{a|' + percent + '%}' + '\n' + '{b|' + name + '}'},textStyle: {align: 'center',rich: {a: {fontSize: 18,fontWeight: 500,lineHeight: 30,color: 'RGB(12,64,128)',},b: {fontSize: 12,fontWeight: 500,color: '#666666',},},},data: chartData.slice(3, 5),},],grid: {// name显示的位置top: '10%',bottom: '52%',left: '50%',containLabel: false,},yAxis: [{type: 'category',inverse: true,axisLine: {show: false,},axisTick: {show: false,},axisLabel: {interval: 0,inside: false,textStyle: {color: 'RGB(12,64,128)',fontSize: 12,},},data: optionData.yAxis,},],xAxis: [{show: false,},],series: optionData.series,}let preChart = echarts.init(this.$refs.preChart)preChart.setOption(option)},},
}
</script><style lang="scss" scoped>
.chart {width: 100%;height: 500px;
}
</style>
这篇关于Echarts多层同心圆的文章就介绍到这儿,希望我们推荐的文章对编程师们有所帮助!


