本文主要是介绍目标跟踪 MOT数据集和可视化,希望对大家解决编程问题提供一定的参考价值,需要的开发者们随着小编来一起学习吧!
目录
MOT15数据集格式简介
gt可视化
本人修改的GT可视化代码:
MOT15数据集格式简介
以下内容转自:【目标跟踪】MOT数据集GroundTruth可视化-腾讯云开发者社区-腾讯云
MOT15数据集下载:https://pan.baidu.com/s/1foGrBXvsanW8BI4eybqfWg?pwd=8888
以下为一行gt示例:
1,1,1367,393,73,225,1,-1,-1,-1
各列数据对应含义如下
<frame>,<id>,<bb_left>,<bb_top>,<bb_width>,<bb_height>,<conf>,<x>,<y>,<z>复制
- frame:图片帧id
- id:目标id
- bb_left:bbox左上角坐标x
- bb_top:bbox左上角坐标y
- bb_width:bbox的宽度
- bb_height:bbox的高度
- conf:置信度
- x:三维坐标系x值,对于二维任务填充为-1
- y:三维坐标系y值,对于二维任务填充为-1
- z:三维坐标系z值,对于二维任务填充为-1
gt可视化
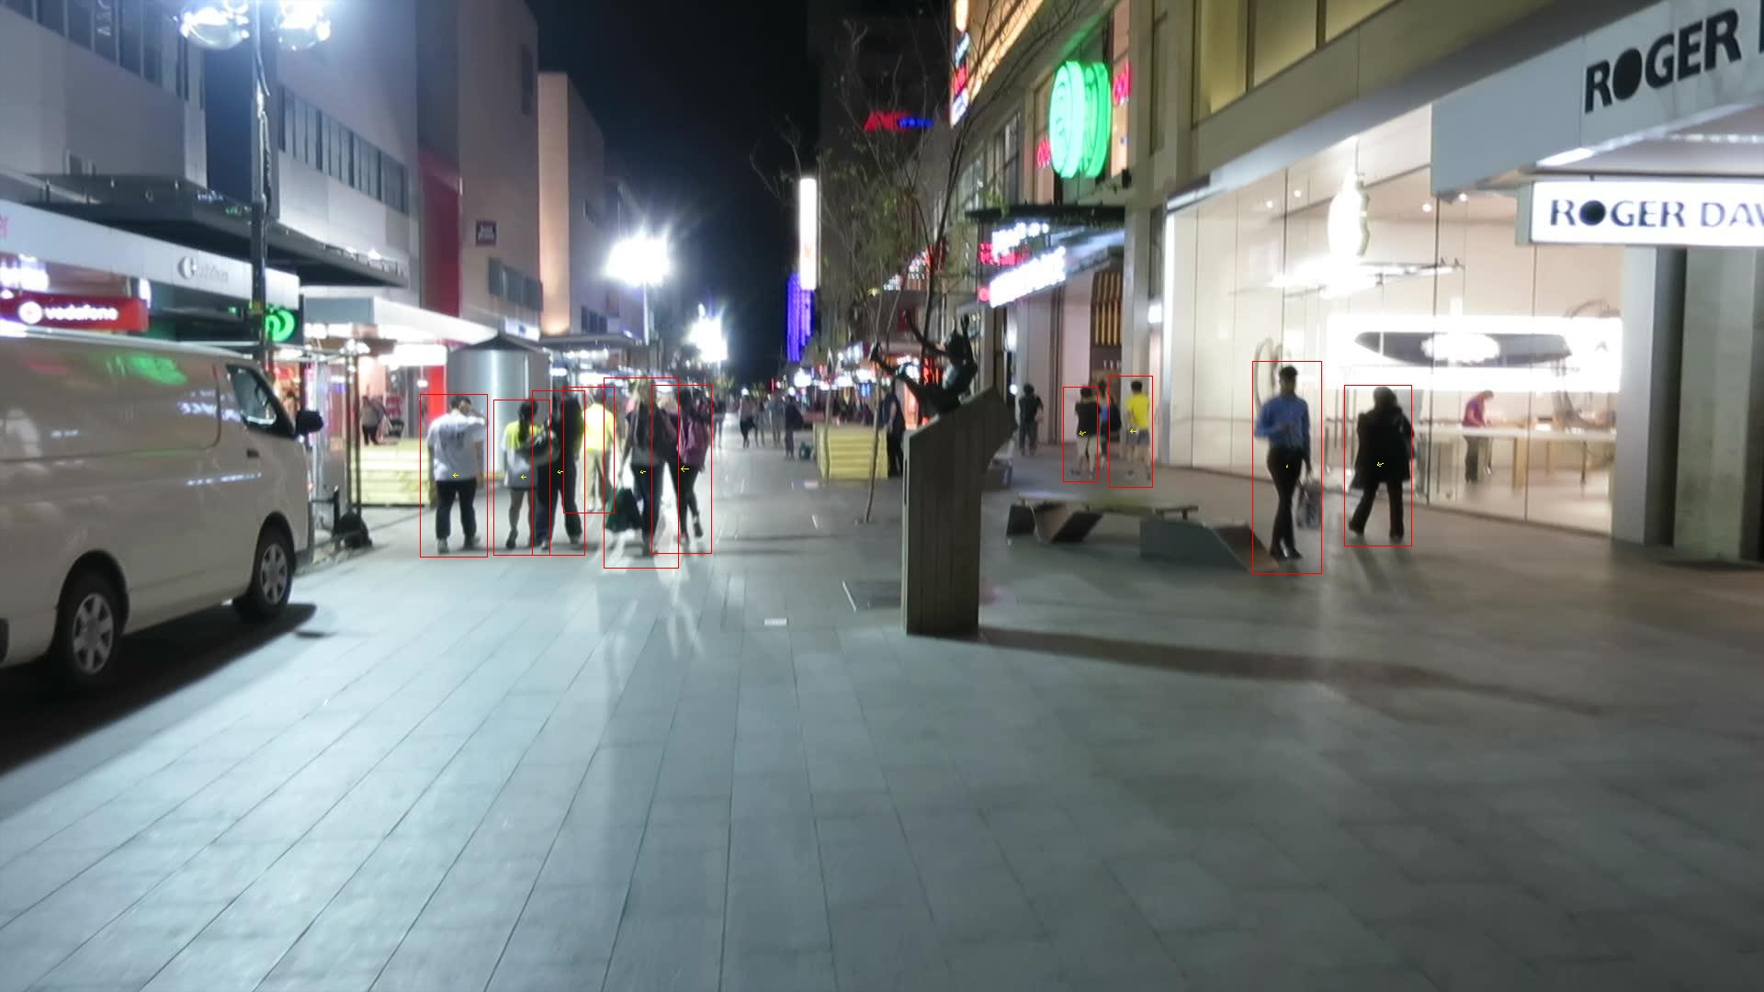
由于是跟踪任务,因此在可视化检测框的同时进一步添加箭头,用来标识目标的运动轨迹。
处理思路是读取一张图片后,同时读取两张图片的gt,若两张图片同时包含同一个目标,则用箭头连接前一帧bbox的中心点和后一帧bbox的中心点。
只能跟踪一个人:
import osimport cv2
def match_obj(obj_list, obj_id):try:index = obj_list.index(obj_id)except:index = -1return indexif __name__ == '__main__':dir_a=r'B:\data\track\MOT15\train\ADL-Rundle-6'img_dir=r'B:\data\track\MOT15\train\ADL-Rundle-6/'txt_paths = files = ['%s/%s' % (i[0].replace("\\", "/"), j) for i in os.walk(dir_a) for j in i[-1] if j.endswith(('gt.txt', '.xpng'))]img_i=1track_show=Trueimg = cv2.imread(img_dir+"/img1/" + "0000{:0>2d}.jpg".format(img_i))img2 = imgfor txt_path in txt_paths:with open(txt_path, 'r') as f:lines = f.readlines()object_list = []center_list = []for line in lines:img_id = line.split(',')[0]if img_id == str(img_i):object_id = line.split(',')[1]object_list.append(object_id)x, y, w, h = int(line.split(',')[2]), int(line.split(',')[3]), int(line.split(',')[4]), int(line.split(',')[5])center1 = (int(int(x) + int(w) / 2), int(int(y) + int(h) / 2))center_list.append(center1)if img_id == str(int(img_i) + 1):img_i+=1img = cv2.imread(img_dir + "/img1/" + "0000{:0>2d}.jpg".format(img_i))object_id = line.split(',')[1]index = match_obj(object_list, object_id)x, y, w, h = int(line.split(',')[2]), int(line.split(',')[3]), int(line.split(',')[4]), int(line.split(',')[5])center2 = (int(int(x) + int(w) / 2), int(int(y) + int(h) / 2))if index != -1:img2 = cv2.rectangle(img, (x, y), (x + w, y + h), (0, 0, 255))img2 = cv2.arrowedLine(img2, center_list[index], center2, (0, 255, 255), 1, 8, 0, 0.5)if track_show:cv2.imshow("sdf",img)cv2.waitKey(0)
本人修改的GT可视化代码:
import sys
import base64
import os
from collections import OrderedDictimport cv2
import shutil
import glob
module_path = os.path.abspath(os.path.join('..'))
if module_path not in sys.path:sys.path.append(module_path)
import jsonif __name__ == '__main__':dir_a=r'B:\data\track\MOT15\train'img_dir=r'B:\data\track\MOT15\train/'txt_paths = ['%s/%s' % (i[0].replace("\\", "/"), j) for i in os.walk(dir_a) for j in i[-1] if j.endswith(('gt.txt', '.xpng'))]version = '3.16.7'flags = {}lineColor = [0, 255, 0, 128]fillColor = [255, 0, 0, 128]track_show=Truesave_json=Falsefor xmlpathName in txt_paths:xmlpathName=xmlpathName.replace("\\","/")dancetrack_name=xmlpathName.split("/")[-3]img_info = OrderedDict()with open(xmlpathName) as fs:lines = fs.readlines()# lines = sorted(lines)for line in lines:line = line.replace("\n", '')line_info = line.split(',')frame = line_info[0]frame_image_name = '{:0>6d}'.format(int(frame)) + ".jpg"box = [int(line_info[2]), int(line_info[3]), int(line_info[2]) + int(line_info[4]),int(line_info[3]) + int(line_info[5]),int(line_info[1])]if frame_image_name in img_info:img_info[frame_image_name].append(box)else:img_info[frame_image_name] = [box]for image_name in img_info.keys():print(image_name)dic = {}dic['version'] = versiondic['flags'] = flagsdic['shapes'] = []img_path = dancetrack_name+"/img1/" + image_nameimg_new_name = dancetrack_name + "_" + image_nameimg_new_path = img_dir + img_pathimg = cv2.imread(img_new_path)imageHeight, imageWidth, _ = img.shapefor box in img_info[image_name]:shape = {}shape['label'] = 'person'shape['line_color'] = Noneshape['fill_color'] = Nonex1 = int(box[0])y1 = int(box[1])x2 = int(box[2])y2 = int(box[3])if track_show:cv2.rectangle(img, (x1, y1), (x2, y2), (0,0,255), 1)cv2.putText(img, "t:" + str(box[4]), (x1,y1+20), cv2.FONT_HERSHEY_SIMPLEX, 0.6, (0,0,255), 2)shape['points'] = [[x1, y1], [x2, y2]]shape['shape_type'] = 'rectangle'shape['flags'] = {}dic['shapes'].append(shape)if track_show:cv2.putText(img, image_name, (20, 40), cv2.FONT_HERSHEY_SIMPLEX, 0.6, (0, 255, 0), 1)cv2.imshow("sdf",img)cv2.waitKey(0)if save_json:dic['lineColor'] = lineColordic['fillColor'] = fillColordic['imagePath'] = img_new_namedic['imageData'] = base64.b64encode(open('{}'.format(img_new_path), "rb").read()).decode('utf-8')dic['imageHeight'] = imageHeightdic['imageWidth'] = imageWidthfw = open('{}json'.format(img_new_path.replace(img_new_path.split('.')[-1], "")), 'w')json.dump(dic, fw)fw.close()
可视化效果如图所示:

在这里插入图片描述
这篇关于目标跟踪 MOT数据集和可视化的文章就介绍到这儿,希望我们推荐的文章对编程师们有所帮助!


