本文主要是介绍OpenTelemetry系列 - 第4篇 OpenTelemetry K8S生态,希望对大家解决编程问题提供一定的参考价值,需要的开发者们随着小编来一起学习吧!
目录
- 一、【Helm】添加OTel Helm repo
- 二、【Helm Chart】OTel Collector
- 2.1 daemonset
- 2.2 deloyment
- 三、【K8S Operator】OTel Operator
- 3.1 安装OTel Operator
- 3.2 部署OpenTelemetryCollector
- 3.2.1 Deloyment Mode
- 3.2.2 DeamonSet Mode
- 3.2.3 StatefulSetMode
- 3.2.4 Sidecar Mode
- 3.3 部署Instrumentation - 配置应用端自动注入OTel Agent
- 3.3.1 全局配置Instrumentation
- 3.3.2 工作负载通过annotation启用自动注入
- 3.3.3 Pod内多个container注入
- 3.3.4 Java Pod自动注入
- 3.3.5 剔除/actuator/health
一、【Helm】添加OTel Helm repo
helm repo add open-telemetry https://open-telemetry.github.io/opentelemetry-helm-charts
helm repo update
二、【Helm Chart】OTel Collector
收集器可以部署为以下四种模式之一:
- deployment(默认)
- daemonSet
- statefulSet
默认模式为deployment。
helm install otel-collector open-telemetry/opentelemetry-collector \
--set mode=<value>
helm install otel-collector open-telemetry/opentelemetry-collector \
--values <path where you saved the chart>
2.1 daemonset
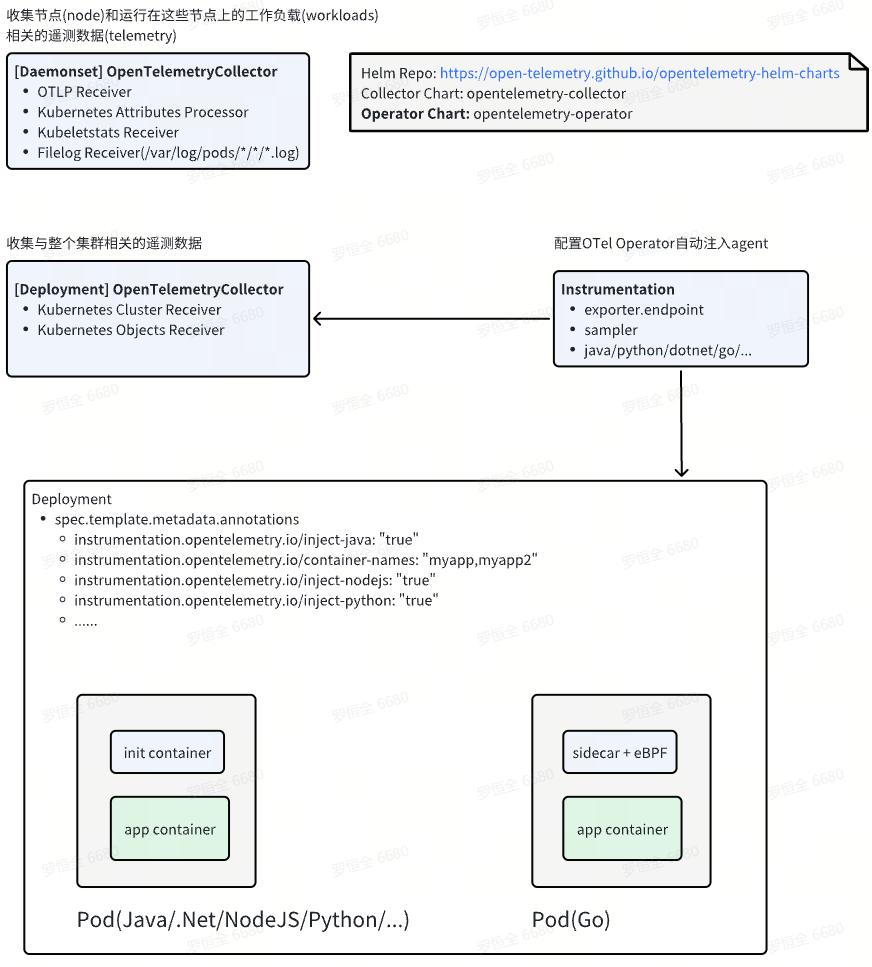
部署OpenTelemetry Collector的daemonset实例,以收集节点(node)和运行在这些节点上的工作负载(workloads)相关的遥测数据(telemetry)。使用daementset来保证在所有节点上都安装了这个收集器实例。daemenset收集器的每个实例将只从其运行的节点收集数据。
收集器的实例将使用以下组件:
OTLP Receiver:收集应用程序跟踪、度量和日志。Kubernetes Attributes Processor:将Kubernetes元数据添加到传入的应用遥测中。Kubeletstats Receiver:从kubelet上的API服务器提取节点、pod和容器指标。Filelog Receiver:用于收集写入stdout/stderr的Kubernetes日志和应用程序日志(/var/log/pods/*/*/*.log)。
values-for-daemonset.yaml:
mode: daemonsetpresets:# enables the k8sattributesprocessor and adds it to the traces, metrics, and logs pipelineskubernetesAttributes:enabled: true# enables the kubeletstatsreceiver and adds it to the metrics pipelineskubeletMetrics:enabled: true# Enables the filelogreceiver and adds it to the logs pipelineslogsCollection:enabled: true
## The chart only includes the loggingexporter by default
## If you want to send your data somewhere you need to
## configure an exporter, such as the otlpexporter
# config:
# exporters:
#   otlp:
#     endpoint: "<SOME BACKEND>"
# service:
#   pipelines:
#     traces:
#       exporters: [ otlp ]
#     metrics:
#       exporters: [ otlp ]
#     logs:
#       exporters: [ otlp ]
2.2 deloyment
部署Collector的deloyment实例,以收集与整个集群相关的遥测数据。只有一个副本的部署确保我们不会产生重复的数据。
收集器的实例将使用以下组件:
Kubernetes Cluster Receiver:收集集群级指标和实体事件。Kubernetes Objects Receiver:从Kubernetes API服务器收集对象,例如events。
values-for-deloyment
mode: deployment# We only want one of these collectors - any more and we'd produce duplicate data
replicaCount: 1presets:# enables the k8sclusterreceiver and adds it to the metrics pipelinesclusterMetrics:enabled: true# enables the k8sobjectsreceiver to collect events only and adds it to the logs pipelineskubernetesEvents:enabled: true
## The chart only includes the loggingexporter by default
## If you want to send your data somewhere you need to
## configure an exporter, such as the otlpexporter
# config:
# exporters:
#   otlp:
#     endpoint: "<SOME BACKEND>"
# service:
#   pipelines:
#     traces:
#       exporters: [ otlp ]
#     metrics:
#       exporters: [ otlp ]
#     logs:
#       exporters: [ otlp ]
三、【K8S Operator】OTel Operator
OTel K8S整体架构:
3.1 安装OTel Operator
$ helm install \
--set admissionWebhooks.certManager.enabled=false \
--set admissionWebhooks.certManager.autoGenerateCert=true \
opentelemetry-operator open-telemetry/opentelemetry-operator
helm uninstall opentelemetry-operator
收集器可以部署为以下四种模式之一:
- deployment(默认)
- daemonSet
- statefulSet
- sidecar
默认模式为deployment。
3.2 部署OpenTelemetryCollector
3.2.1 Deloyment Mode
独立部署、运维Collector,方便scale、回滚版本。
$ kubectl apply -f - <<EOF
apiVersion: opentelemetry.io/v1alpha1
kind: OpenTelemetryCollector
metadata:name: my-collector
spec:mode: deployment # This configuration is omittable.config: |receivers:jaeger:protocols:grpc:processors:exporters:debug:service:pipelines:traces:receivers: [jaeger]processors: []exporters: [debug]
EOF
3.2.2 DeamonSet Mode
作为DaemonSet运行Collector于每个K8s Node之上,收集Node上pod信息。
$ kubectl apply -f - <<EOF
apiVersion: opentelemetry.io/v1alpha1
kind: OpenTelemetryCollector
metadata:name: my-collector
spec:mode: daemonsethostNetwork: trueconfig: |receivers:jaeger:protocols:grpc:processors:exporters:debug:verbosity: detailedservice:pipelines:traces:receivers: [jaeger]processors: []exporters: [debug]
EOF
3.2.3 StatefulSetMode
将Collector部署为StatefulSet基本上有三个主要优势:
- Collector实例的name可预测
如果使用上述两种方法来部署Collector,则Collector实例的pod名称将是唯一的(它的名称加上随机序列)。但是,statfulset中的每个Pod都从statfulset的名称和Pod的序号(my-col-0、my-col-1、my-col-2等)中派生其主机名。 - 当Collector副本失败时,将安排重新调度
如果Collector pod在StatefulSet中失败,Kubernetes将尝试重新调度具有相同名称的新pod到同一节点。Kubernetes也会尝试将相同的粘性身份(例如volumnes)附加到新的pod上。
$ kubectl apply -f - <<EOF
apiVersion: opentelemetry.io/v1alpha1
kind: OpenTelemetryCollector
metadata:name: my-collector
spec:mode: statefulsetreplicas: 3config: |receivers:jaeger:protocols:grpc:processors:exporters:debug:service:pipelines:traces:receivers: [jaeger]processors: []exporters: [debug]
EOF
3.2.4 Sidecar Mode
将Collector作为sidecar注入Pod中,
sidecar模式的最大优点是,它允许人们尽可能快速、可靠地从应用程序中卸载遥测数据。这个Collector实例将在容器级别上工作,不会创建新的pod,这对于保持Kubernetes集群的整洁和易于管理是完美的。此外,当您希望使用不同的收集/导出策略时,还可以使用sidecar模式,这正好适合此应用程序。
一旦Collector Sidecar实例存在于给定的名称空间中,您就可以从该名称空间为deployment注入sidecar(以下2种方式任选1种即可):
- 为Deployment添加annontation -
sidecar.opentelemetry.io/inject: true - 为Namespace添加annontation -
sidecar.opentelemetry.io/inject: true
$ kubectl apply -f - <<EOF
apiVersion: opentelemetry.io/v1alpha1
kind: OpenTelemetryCollector
metadata:name: sidecar-for-my-app
spec:mode: sidecarconfig: |receivers:jaeger:protocols:thrift_compact:processors:exporters:debug:service:pipelines:traces:receivers: [jaeger]processors: []exporters: [debug]
EOF
$ kubectl apply -f - <<EOF
apiVersion: apps/v1
kind: Deployment
metadata:name: my-applabels:app: my-app
spec:selector:matchLabels:app: my-appreplicas: 1template:metadata:labels:app: my-appannotations:sidecar.opentelemetry.io/inject: "true" # CORRECTspec:containers:- name: myappimage: jaegertracing/vertx-create-span:operator-e2e-testsports:- containerPort: 8080protocol: TCP
EOF
3.3 部署Instrumentation - 配置应用端自动注入OTel Agent
operator可以注入和配置OpenTelemetry自动注入agent。目前支持:
- Apache HTTPD
- DotNet
- Go
- Java
- Nginx
- NodeJS
- Python
3.3.1 全局配置Instrumentation
kubectl apply -f - <<EOF
apiVersion: opentelemetry.io/v1alpha1
kind: Instrumentation
metadata:name: my-instrumentation
spec:exporter:endpoint: http://otel-collector:4317propagators:- tracecontext- baggage- b3sampler:type: parentbased_traceidratioargument: "0.25"python:env:# Required if endpoint is set to 4317.# Python autoinstrumentation uses http/proto by default# so data must be sent to 4318 instead of 4317.- name: OTEL_EXPORTER_OTLP_ENDPOINTvalue: http://otel-collector:4318dotnet:env:# Required if endpoint is set to 4317.# Dotnet autoinstrumentation uses http/proto by default# See https://github.com/open-telemetry/opentelemetry-dotnet-instrumentation/blob/888e2cd216c77d12e56b54ee91dafbc4e7452a52/docs/config.md#otlp- name: OTEL_EXPORTER_OTLP_ENDPOINTvalue: http://otel-collector:4318go:env:# Required if endpoint is set to 4317.# Go autoinstrumentation uses http/proto by default# so data must be sent to 4318 instead of 4317.- name: OTEL_EXPORTER_OTLP_ENDPOINTvalue: http://otel-collector:4318
EOF
以上部署成功的CR Instrumentation可以通过如下命令查询:
kubectl get otelinst.
3.3.2 工作负载通过annotation启用自动注入
通过添加annotation启动自动注入:
- 向pod添加annotation以启用注入
- 将annotation添加到namespace中,以便该名称空间中的所有pod都将获得检测
- 将annotation添加到单独的PodSpec对象中,这些对象可以作为Deployment、Statefulset和其他资源的一部分使用
Java:
instrumentation.opentelemetry.io/inject-java: "true"
# 注入到指定的container中(适用于一个Pod中有多个container)
# 如不指定则默认注入到第一个container中,
# 可通过此配置避免向istio-proxy中注入
instrumentation.opentelemetry.io/container-names: "myapp,myapp2"
NodeJS:
instrumentation.opentelemetry.io/inject-nodejs: "true"
Python:
instrumentation.opentelemetry.io/inject-python: "true"
.NET:
.NET auto-instrumentation also honors an annotation that will be used to set the .NET Runtime Identifiers(RIDs). Currently, only two RIDs are supported: linux-x64 and linux-musl-x64. By default linux-x64 is used.
instrumentation.opentelemetry.io/inject-dotnet: "true"
instrumentation.opentelemetry.io/otel-dotnet-auto-runtime: "linux-x64" # for Linux glibc based images, this is default value and can be omitted
instrumentation.opentelemetry.io/otel-dotnet-auto-runtime: "linux-musl-x64"  # for Linux musl based images
Go:
Go auto-instrumentation also honors an annotation that will be used to set the OTEL_GO_AUTO_TARGET_EXE env var. This env var can also be set via the Instrumentation resource, with the annotation taking precedence. Since Go auto-instrumentation requires OTEL_GO_AUTO_TARGET_EXE to be set, you must supply a valid executable path via the annotation or the Instrumentation resource. Failure to set this value causes instrumentation injection to abort, leaving the original pod unchanged.
instrumentation.opentelemetry.io/inject-go: "true"
instrumentation.opentelemetry.io/otel-go-auto-target-exe: "/path/to/container/executable"
Go auto-instrumentation also requires elevated permissions. The below permissions are set automatically and are required.
securityContext:privileged: truerunAsUser: 0
Apache HTTPD:
instrumentation.opentelemetry.io/inject-apache-httpd: "true"
Nginx:
instrumentation.opentelemetry.io/inject-nginx: "true"
OpenTelemetry SDK environment variables only:
instrumentation.opentelemetry.io/inject-sdk: "true"
可选值:
true- inject and Instrumentation resource from the namespace.my-instrumentation- name of Instrumentation CR instance in the current namespace.my-other-namespace/my-instrumentation- name and namespace of Instrumentation CR instance in another namespace.false- do not inject
3.3.3 Pod内多个container注入
apiVersion: apps/v1
kind: Deployment
metadata:name: my-deployment-with-multi-containers-multi-instrumentations
spec:selector:matchLabels:app: my-pod-with-multi-containers-multi-instrumentationsreplicas: 1template:metadata:labels:app: my-pod-with-multi-containers-multi-instrumentationsannotations:instrumentation.opentelemetry.io/inject-java: "true"instrumentation.opentelemetry.io/java-container-names: "myapp,myapp2"instrumentation.opentelemetry.io/inject-python: "true"instrumentation.opentelemetry.io/python-container-names: "myapp3"spec:containers:- name: myappimage: myImage1- name: myapp2image: myImage2- name: myapp3image: myImage3
3.3.4 Java Pod自动注入
Java Pod被OTel自动注入后,Pod定义被修改如下:
apiVersion: v1
kind: Pod
metadata:labels:app: app-atomversion: v1name: app-atom-6c97b8dd84-mw222namespace: otel-poc
spec:containers:- env:- name: SPRING_OUTPUT_ANSI_ENABLEDvalue: NEVER- name: LOGGING_CONFIGvalue: /config/logback-spring.xml- name: JAVA_TOOL_OPTIONSvalue: ' -javaagent:/otel-auto-instrumentation-java/javaagent.jar'- name: OTEL_SERVICE_NAMEvalue: app-atom- name: OTEL_EXPORTER_OTLP_ENDPOINTvalue: http://otel-collector.opentelemetry-operator-system.svc.cluster.local:4317- name: OTEL_RESOURCE_ATTRIBUTES_POD_NAMEvalueFrom:fieldRef:apiVersion: v1fieldPath: metadata.name- name: OTEL_RESOURCE_ATTRIBUTES_NODE_NAMEvalueFrom:fieldRef:apiVersion: v1fieldPath: spec.nodeName- name: OTEL_PROPAGATORSvalue: tracecontext,baggage,b3- name: OTEL_TRACES_SAMPLERvalue: parentbased_traceidratio- name: OTEL_TRACES_SAMPLER_ARGvalue: "0.25"- name: OTEL_RESOURCE_ATTRIBUTESvalue: k8s.container.name=app-atom,k8s.deployment.name=app-atom,k8s.namespace.name=otel-poc,k8s.node.name=$(OTEL_RESOURCE_ATTRIBUTES_NODE_NAME),k8s.pod.name=$(OTEL_RESOURCE_ATTRIBUTES_POD_NAME),k8s.replicaset.name=app-atom-6c97b8dd84,service.version=latestimage: otel-poc/app-atom:latestimagePullPolicy: IfNotPresentlivenessProbe:failureThreshold: 3httpGet:path: /actuator/healthport: 8080scheme: HTTPinitialDelaySeconds: 60periodSeconds: 10successThreshold: 1timeoutSeconds: 5name: app-atomports:- containerPort: 8080name: httpprotocol: TCP- containerPort: 9999name: http-xxljobprotocol: TCPreadinessProbe:failureThreshold: 3httpGet:path: /actuator/healthport: 8080scheme: HTTPinitialDelaySeconds: 60periodSeconds: 10successThreshold: 1timeoutSeconds: 5resources:limits:cpu: "1"memory: 1000Mirequests:cpu: 10mmemory: 128MiterminationMessagePath: /dev/termination-logterminationMessagePolicy: FilevolumeMounts:- mountPath: /config/name: app-config- mountPath: /var/run/secrets/kubernetes.io/serviceaccountname: kube-api-access-vxx27readOnly: true- mountPath: /otel-auto-instrumentation-javaname: opentelemetry-auto-instrumentation-javadnsPolicy: ClusterFirstenableServiceLinks: trueinitContainers:- command:- cp- /javaagent.jar- /otel-auto-instrumentation-java/javaagent.jarimage: ghcr.io/open-telemetry/opentelemetry-operator/autoinstrumentation-java:231128imagePullPolicy: IfNotPresentname: opentelemetry-auto-instrumentation-javaresources:limits:cpu: 500mmemory: 64Mirequests:cpu: 50mmemory: 64MiterminationMessagePath: /dev/termination-logterminationMessagePolicy: FilevolumeMounts:- mountPath: /otel-auto-instrumentation-javaname: opentelemetry-auto-instrumentation-java- mountPath: /var/run/secrets/kubernetes.io/serviceaccountname: kube-api-access-vxx27readOnly: truenodeName: k-node1preemptionPolicy: PreemptLowerPrioritypriority: 0restartPolicy: AlwaysschedulerName: default-schedulersecurityContext: {}serviceAccount: defaultserviceAccountName: defaultterminationGracePeriodSeconds: 30tolerations:- effect: NoExecutekey: node.kubernetes.io/not-readyoperator: ExiststolerationSeconds: 300- effect: NoExecutekey: node.kubernetes.io/unreachableoperator: ExiststolerationSeconds: 300volumes:- configMap:defaultMode: 420name: app-atomname: app-config- name: kube-api-access-vxx27projected:defaultMode: 420sources:- serviceAccountToken:expirationSeconds: 3607path: token- configMap:items:- key: ca.crtpath: ca.crtname: kube-root-ca.crt- downwardAPI:items:- fieldRef:apiVersion: v1fieldPath: metadata.namespacepath: namespace- emptyDir:sizeLimit: 200Miname: opentelemetry-auto-instrumentation-java
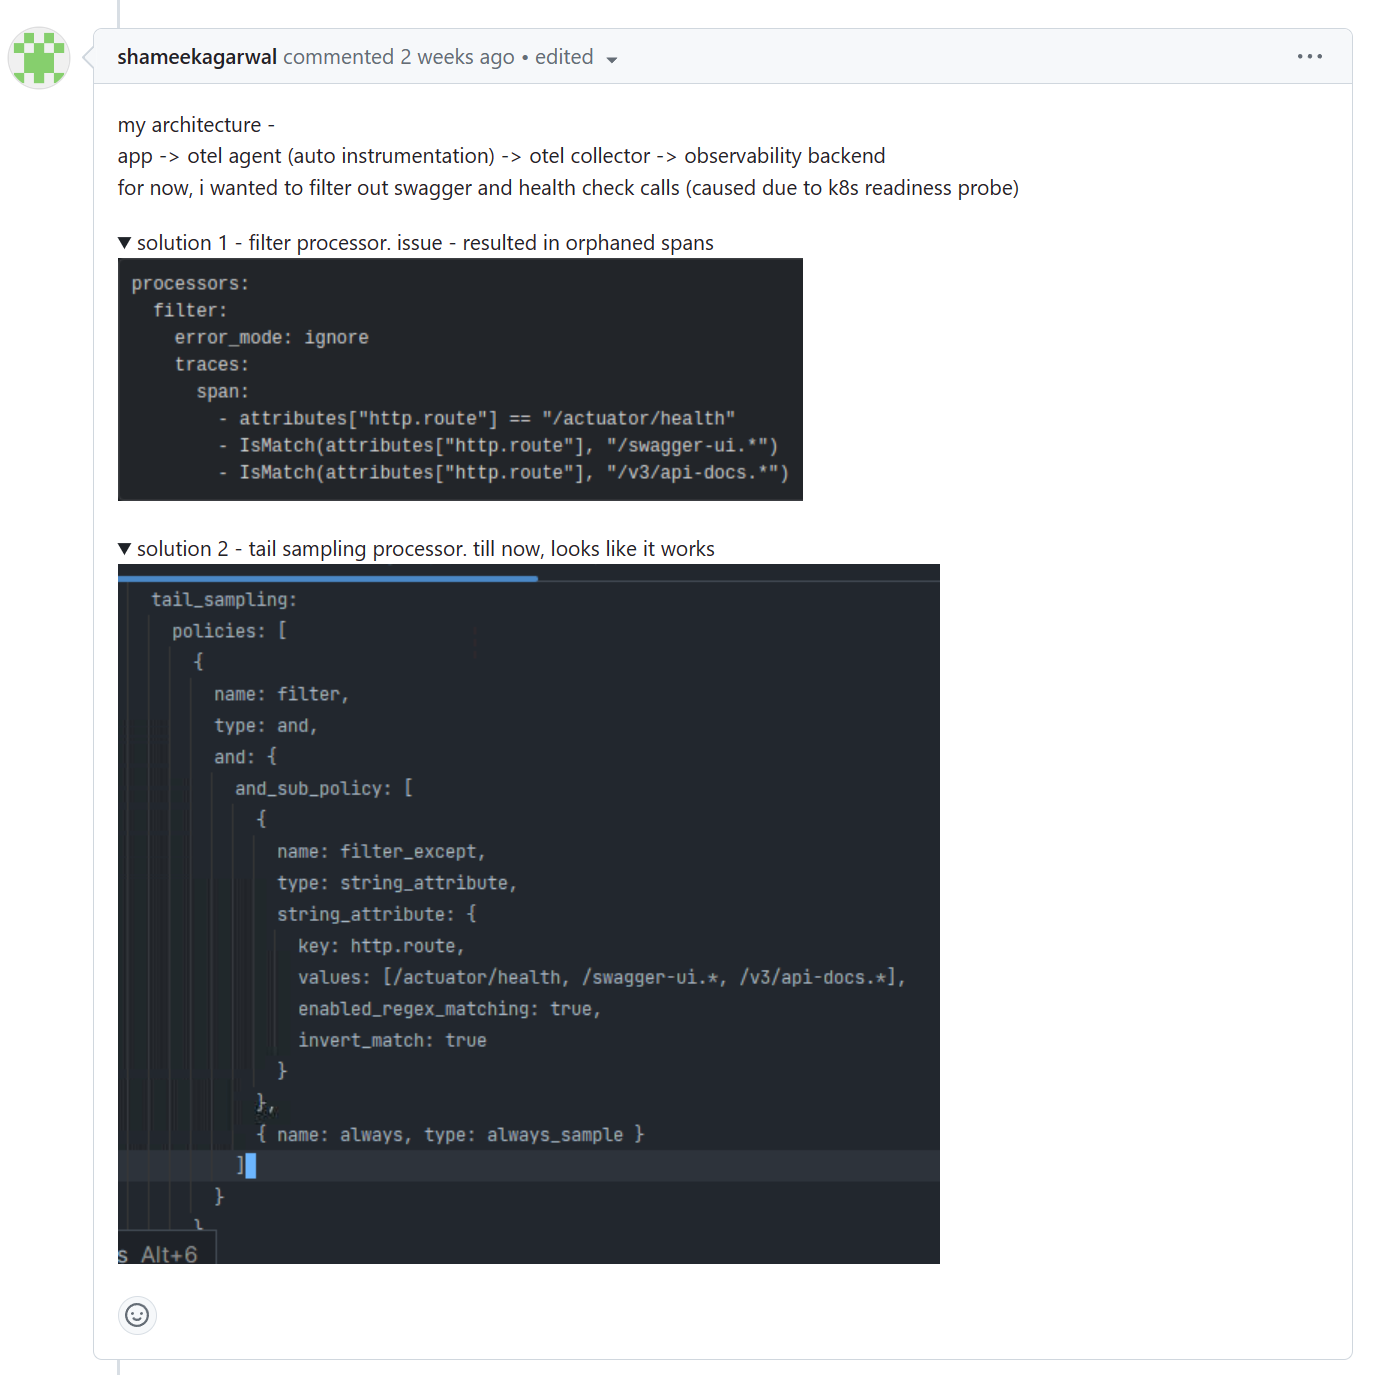
3.3.5 剔除/actuator/health
https://github.com/open-telemetry/opentelemetry-java-instrumentation/issues/1060
参考:
https://opentelemetry.io/docs/kubernetes/
https://opentelemetry.io/docs/kubernetes/operator/
https://github.com/open-telemetry/opentelemetry-helm-charts
https://github.com/open-telemetry/opentelemetry-operator
阿里技术 - 深入浅出eBPF|你要了解的7个核心问题
这篇关于OpenTelemetry系列 - 第4篇 OpenTelemetry K8S生态的文章就介绍到这儿,希望我们推荐的文章对编程师们有所帮助!


