本文主要是介绍Android 图表开源框架之MPAndroidChart LineChart折线图(三),希望对大家解决编程问题提供一定的参考价值,需要的开发者们随着小编来一起学习吧!
Android 图表开源框架之MPAndroidChart LineChart折线图(一)
Android 图表开源框架之MPAndroidChart LineChart折线图(二)
Android 图表开源框架之MPAndroidChart LineChart之常用自定义设置功能
源码下载地址:MPAndroidChart3_0_1.zip https://mp.csdn.net/console/upDetailed
Android 图表开源框架之MPAndroidChart LineChart折线图,v3.0.1版本,MPAndroidChart是一款基于Android的开源图表库,MPAndroidChart不仅可以在Android设备上绘制各种统计图表,而且可以对图表进行拖动和缩放操作,应用起来非常灵活。MPAndroidChart显得更为轻巧和简单,拥有常用的图表类型:线型图、饼图、柱状图和散点图。
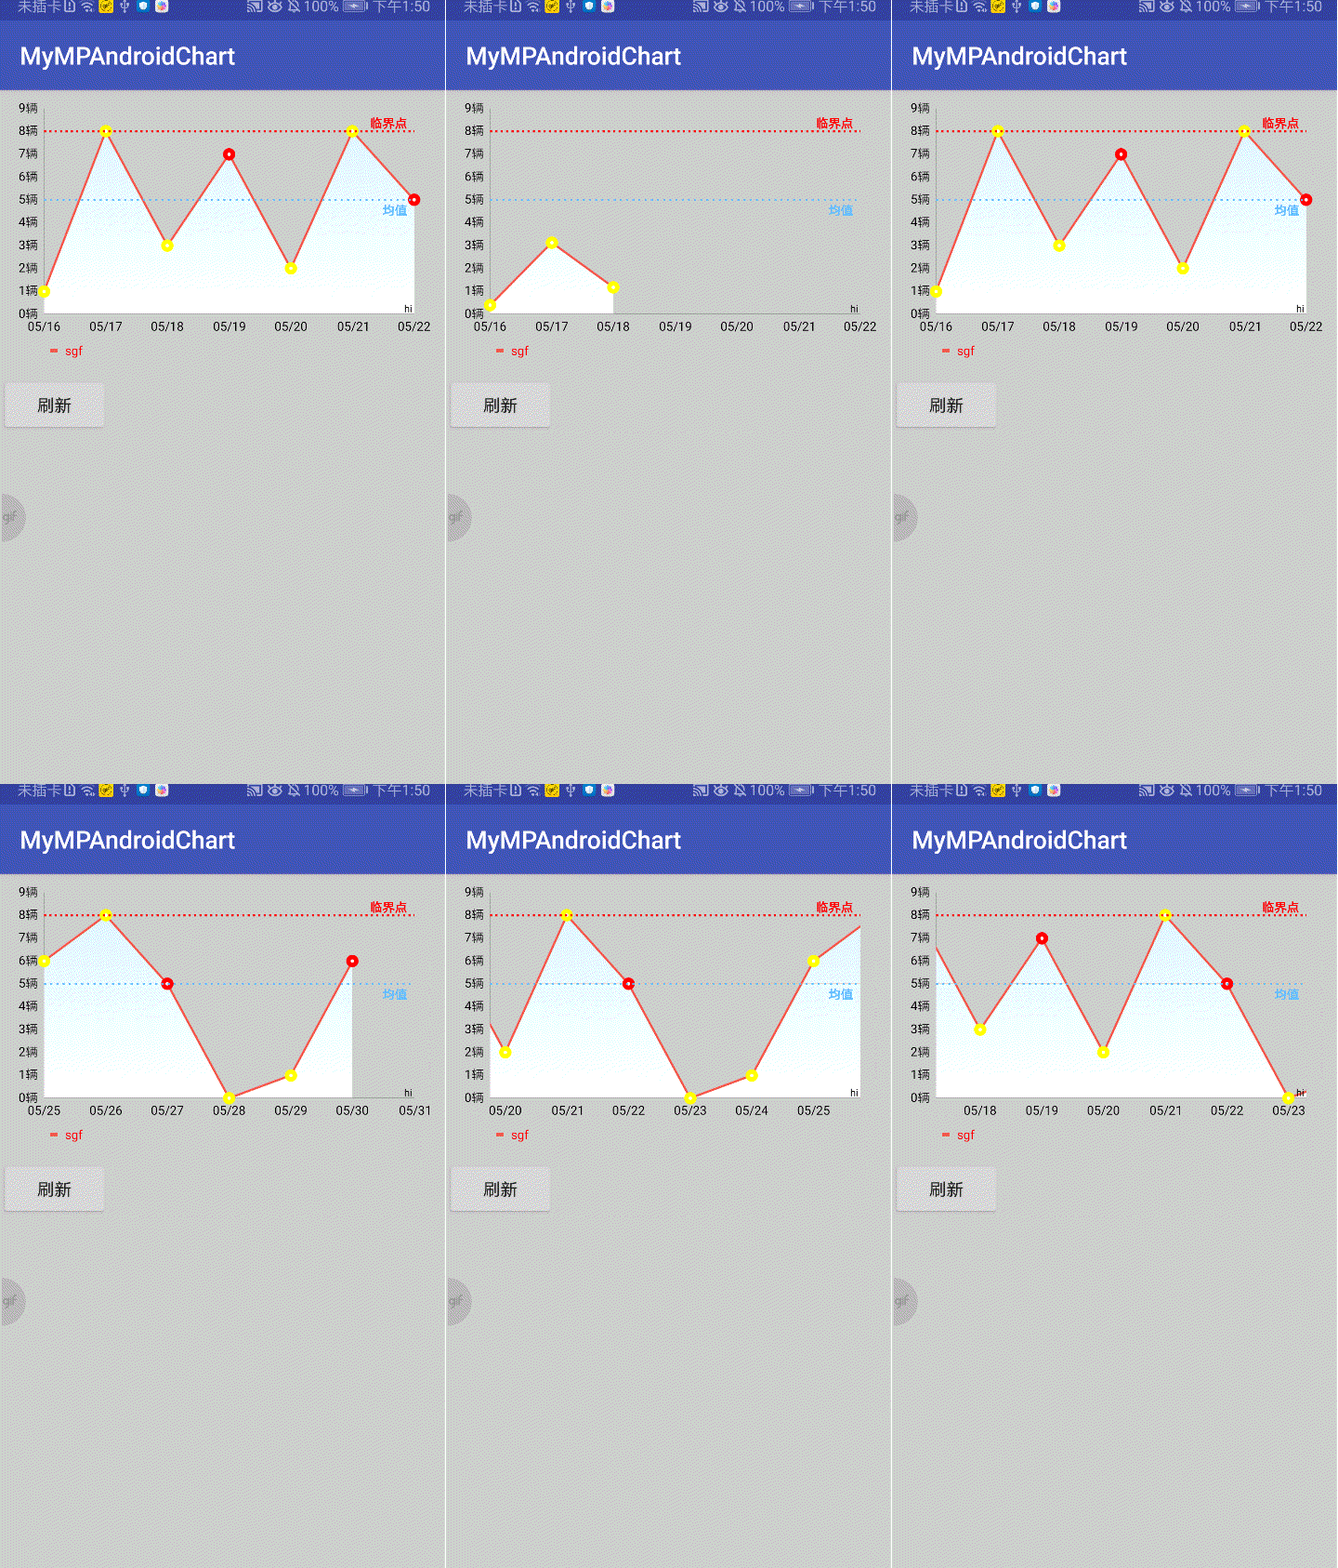
一.效果图:


二.快速实现:
implementation 'com.github.PhilJay:MPAndroidChart:v3.0.1'1.主函数代码:
import android.content.Context;
import android.content.Intent;
import android.graphics.Color;
import android.graphics.Typeface;
import android.os.Bundle;
import android.support.v7.app.AppCompatActivity;
import android.text.format.DateFormat;
import android.util.DisplayMetrics;
import android.view.MotionEvent;
import android.view.View;
import android.view.WindowManager;
import android.widget.Button;import com.example.m1571.mympandroidchart.utils.CustomXValueFormatter;
import com.example.m1571.mympandroidchart.utils.MyMarkerView;
import com.example.m1571.mympandroidchart.utils.MyMarkersView;
import com.github.mikephil.charting.animation.Easing;
import com.github.mikephil.charting.charts.LineChart;
import com.github.mikephil.charting.charts.PieChart;
import com.github.mikephil.charting.components.AxisBase;
import com.github.mikephil.charting.components.Description;
import com.github.mikephil.charting.components.Legend;
import com.github.mikephil.charting.components.LimitLine;
import com.github.mikephil.charting.components.XAxis;
import com.github.mikephil.charting.components.YAxis;
import com.github.mikephil.charting.data.Entry;
import com.github.mikephil.charting.data.LineData;
import com.github.mikephil.charting.data.LineDataSet;
import com.github.mikephil.charting.data.PieData;
import com.github.mikephil.charting.data.PieDataSet;
import com.github.mikephil.charting.data.PieEntry;
import com.github.mikephil.charting.formatter.IAxisValueFormatter;
import com.github.mikephil.charting.formatter.PercentFormatter;
import com.github.mikephil.charting.highlight.Highlight;
import com.github.mikephil.charting.interfaces.datasets.ILineDataSet;
import com.github.mikephil.charting.listener.OnChartValueSelectedListener;
import com.github.mikephil.charting.utils.ColorTemplate;import java.util.ArrayList;
import java.util.Collections;
import java.util.HashMap;
import java.util.List;
import java.util.Map;/**** 图表开源框架* https://blog.csdn.net/qq_43332570/article/details/103180779**https://blog.csdn.net/qq_26787115/article/details/53611373*** https://www.jb51.net/article/142778.htm* https://www.jb51.net/article/141344.htm* https://www.jb51.net/article/96508.htm* <p>* https://github.com/hdodenhof/CircleImageView*/
public class ChartActivity extends AppCompatActivity {ArrayList<PieEntry> pieEntryList = new ArrayList();//数据列表ArrayList<Integer> colors = new ArrayList();//颜色列表private LineChart lineChart;float datas[] = {14f,15f,16f,17f,16f,16f};float datas2[] = {17f,16f,15f,14f,17f,14f};//在MPAndroidChart一般都是通过List<Entry>对象来装数据的final List<Entry> entries = new ArrayList<Entry>();final List<Entry> entries2 = new ArrayList<Entry>();final List<String> yRightList = new ArrayList<String>();@Overrideprotected void onCreate(Bundle savedInstanceState) {super.onCreate(savedInstanceState);setContentView(R.layout.activity_chart);lineChart = (LineChart) findViewById(R.id.lineChart);List<Integer> mylist = new ArrayList<>();
//        for (int i = 0; i < 10; i++) {
//            mylist.add(i);
//        }mylist.add(1);mylist.add(8);mylist.add(3);mylist.add(7);mylist.add(2);mylist.add(8);mylist.add(5);mylist.add(0);mylist.add(1);mylist.add(6);setData(mylist);//解决滑动冲突
//        lineChart.setOnTouchListener(new View.OnTouchListener()
//        {
//            @Override
//            public boolean onTouch(View v, MotionEvent event)
//            {
//                switch (event.getAction())
//                {
//                    case MotionEvent.ACTION_DOWN:
//                    {
//                        scrollview.requestDisallowInterceptTouchEvent(true);
//                        break;
//                    }
//                    case MotionEvent.ACTION_CANCEL:
//                    case MotionEvent.ACTION_UP:
//                    {
//                        scrollview.requestDisallowInterceptTouchEvent(false);
//                        break;
//                    }
//                }
//                return false;
//            }
//        });}
/*** 初始化曲线图表** @param list 数据集*/public void setData(final List<Integer> list){//显示边界lineChart.setDrawBorders(false);//设置数据List<Entry> entries = new ArrayList<>();for (int i = 0; i < list.size(); i++){entries.add(new Entry(i, (float) list.get(i)));}//一个LineDataSet就是一条线LineDataSet lineDataSet = new LineDataSet(entries, "sgf");//线颜色lineDataSet.setColor(Color.parseColor("#F15A4A"));//线宽度lineDataSet.setLineWidth(1.6f);//不显示圆点lineDataSet.setDrawCircles(false);//线条平滑lineDataSet.setMode(LineDataSet.Mode.HORIZONTAL_BEZIER);lineDataSet.setDrawFilled(true);lineDataSet.setFillAlpha(50);lineDataSet.setFillColor(Color.RED);
//        dataSet.setFillColor(R.drawable.gradient_chart_bg2);int[] colors = { getResources().getColor(R.color.colorAccent),getResources().getColor(android.R.color.white) };
//        dataSet.setFillColor(getResources().getColor(R.drawable.gradient_chart_bg2));//设置曲线下方渐变的阴影lineDataSet.setDrawFilled(true);lineDataSet.setFillDrawable(getResources().getDrawable(R.drawable.line_gradient_bg_shape));lineDataSet.setLineWidth(1.75f); // 线宽lineDataSet.setCircleSize(5f);// 显示的圆形大小lineDataSet.setDrawCircles(true);// 是否有圆点
//		lineDataSet.setDrawCircleHole(true);// 设置数据点是空心还是实心,默认空心lineDataSet.setDrawValues(true);//设置是否显示点的坐标值// 设置平滑曲线模式
//          lineDataSet.setMode(LineDataSet.Mode.STEPPED);//梯形
//          lineDataSet.setMode(LineDataSet.Mode.CUBIC_BEZIER);//曲线模式lineDataSet.setMode(LineDataSet.Mode.LINEAR);//折线
//          lineDataSet.setMode(LineDataSet.Mode.HORIZONTAL_BEZIER);//曲线模式//设置折线图填充
//        lineDataSet.setDrawFilled(true);LineData data = new LineData(lineDataSet);//无数据时显示的文字lineChart.setNoDataText("暂无数据");//折线图不显示数值data.setDrawValues(false);//得到X轴XAxis xAxis = lineChart.getXAxis();//设置X轴的位置(默认在上方)xAxis.setPosition(XAxis.XAxisPosition.BOTTOM);//设置X轴坐标之间的最小间隔xAxis.setGranularity(1f);//设置X轴的刻度数量,第二个参数为true,将会画出明确数量(带有小数点),但是可能值导致不均匀,默认(6,false)//xAxis.setLabelCount(list.size() / 6, false);
xAxis.setLabelCount(list.size(), false);//设置X轴的值(最小值、最大值、然后会根据设置的刻度数量自动分配刻度显示)xAxis.setAxisMinimum(0f);xAxis.setAxisMaximum((float) list.size());//不显示网格线xAxis.setDrawGridLines(false);// 标签倾斜
//        xAxis.setLabelRotationAngle(45);//设置X轴值为字符串 可在这里自定义要显示的单位xAxis.setValueFormatter(new IAxisValueFormatter(){@Overridepublic String getFormattedValue(float value, AxisBase axis){int IValue = (int) value;CharSequence format = DateFormat.format("MM/dd",System.currentTimeMillis()-(long)(list.size()-IValue)*24*60*60*1000);return format.toString();}});Legend mLegend = lineChart.getLegend(); //设置标示,就是那个一组y的value的
//        mLegend.setForm(Legend.LegendForm.DEFAULT); //默认圆形样式
//        mLegend.setForm(Legend.LegendForm.SQUARE); //方形样式
//        mLegend.setForm(Legend.LegendForm.CIRCLE); //圆形样式mLegend.setForm(Legend.LegendForm.LINE); //横线的样式mLegend.setFormSize(6f); //字体
//        mLegend.setXEntrySpace(6f); //设置在水平轴上 legend-entries 的间隙mLegend.setYEntrySpace(6f); //设置在垂直轴上 legend-entries 的间隙mLegend.setFormToTextSpace(6f); //设置 legend-form 和 legend-label 之间的空间mLegend.setWordWrapEnabled(true); //设置 Legend 是否自动换行? 目前仅支持BelowChartLeft,BelowChartRightmLegend.setTextColor(Color.RED); //设置字体颜色mLegend.setPosition(Legend.LegendPosition.BELOW_CHART_LEFT); //设置显示下位置在左侧
//        mLegend.setPosition(Legend.LegendPosition.BELOW_CHART_RIGHT); //设置显示下位置在右侧
//        mLegend.setPosition(Legend.LegendPosition.BELOW_CHART_CENTER); //设置显示下位置在中间
//        mLegend.setPosition(Legend.LegendPosition.RIGHT_OF_CHART); //设置显示图平行的右侧
//        mLegend.setPosition(Legend.LegendPosition.LEFT_OF_CHART); //设置显示图平行的左侧
//        mLegend.setPosition(Legend.LegendPosition.RIGHT_OF_CHART_CENTER); //设置显示图平行的右侧据居中
//        mLegend.setPosition(Legend.LegendPosition.LEFT_OF_CHART_INSIDE); //
//        mLegend.setPosition(Legend.LegendPosition.PIECHART_CENTER); //PieChart独有,折线图会显示在中间
//        mLegend.setPosition(Legend.LegendPosition.LEFT_OF_CHART_CENTER); //设置显示图平行的左侧据居中mLegend.setTypeface(Typeface.DEFAULT); //设置图例标签的字体
//        mLegend.setForm(Legend.LegendForm.NONE);//不绘制图形
//        mLegend.setForm(Legend.LegendForm.EMPTY);;//不绘制图形保留空间
//        mLegend.setForm(Legend.LegendForm.LINE); // 线
//        mLegend.setFormSize(14f); // 图形大小
//        mLegend.setFormLineWidth(9f);  // 图形线宽//隐藏LengendmLegend.setEnabled(true);// set custom labels and colors
//        mLegend.setCustom(ColorTemplate.VORDIPLOM_COLORS,
//                new String[] { "Set1", "Set2", "Set3", "Set4", "Set5" });LimitLine limitLineL = new LimitLine(8f, "临界点");//临界点limitLineL.setLineColor(Color.RED);limitLineL.setLineWidth(1.5f);limitLineL.setTextSize(10f);limitLineL.setTextColor(Color.RED);limitLineL.setLabelPosition(LimitLine.LimitLabelPosition.RIGHT_TOP);//标签位置limitLineL.enableDashedLine(5f,8f,0);  //设置虚线lineChart.getAxisLeft().addLimitLine(limitLineL);//设置均值LimitLine ll2 = new LimitLine(5, "均值");ll2.setLabel("均值");ll2.setTextColor(Color.parseColor("#5dbcfe"));ll2.setLineWidth(1f);ll2.setEnabled(true);ll2.setLineColor(Color.parseColor("#5dbcfe"));ll2.enableDashedLine(5f, 10f, 0f);//三个参数,第一个线宽长度,第二个线段之间宽度,第三个一般为0,是个补偿ll2.setLabelPosition(LimitLine.LimitLabelPosition.RIGHT_BOTTOM);//标签位置ll2.setTextSize(10f);lineChart.getAxisLeft().addLimitLine(ll2);//得到Y轴YAxis yAxis = lineChart.getAxisLeft();YAxis rightYAxis = lineChart.getAxisRight();//设置Y轴是否显示rightYAxis.setEnabled(false); //右侧Y轴不显示//设置y轴坐标之间的最小间隔//不显示网格线yAxis.setDrawGridLines(false);//设置Y轴坐标之间的最小间隔yAxis.setGranularity(1);//设置y轴的刻度数量//+2:最大值n就有n+1个刻度,在加上y轴多一个单位长度,为了好看,so+2yAxis.setLabelCount(Collections.max(list) + 2, false);//设置从Y轴值yAxis.setAxisMinimum(0f);//+1:y轴多一个单位长度,为了好看yAxis.setAxisMaximum(Collections.max(list) + 1);//y轴,可在这里设置自定义的单位yAxis.setValueFormatter(new IAxisValueFormatter(){@Overridepublic String getFormattedValue(float value, AxisBase axis){int IValue = (int) value;return String.valueOf(IValue)+"辆";}});//图例:得到Lengend
//        Legend legend = lineChart.getLegend();//隐藏Lengend
//        legend.setEnabled(true);//隐藏描述Description description = new Description();description.setEnabled(true);lineChart.setDescription(description);lineChart.getDescription().setText("hi");//折线图点的标记MyMarkersView mv = new MyMarkersView(this);lineChart.setMarker(mv);//设置数据lineChart.setData(data);//设置动画效果lineChart.animateY(2000, Easing.EasingOption.Linear);lineChart.animateX(2000, Easing.EasingOption.Linear);//图标刷新lineChart.invalidate();}
}
2.渐变色背景:
<?xml version="1.0" encoding="utf-8"?>
<shape xmlns:android="http://schemas.android.com/apk/res/android"android:shape="rectangle"><gradientandroid:angle="-90"android:endColor="#FEFFFF"android:startColor="#D9F3FF"></gradient>
</shape>
3.主函数布局:
<?xml version="1.0" encoding="utf-8"?>
<ScrollView xmlns:android="http://schemas.android.com/apk/res/android"xmlns:app="http://schemas.android.com/apk/res-auto"xmlns:tools="http://schemas.android.com/tools"android:layout_width="match_parent"android:layout_height="match_parent"android:background="#ccc"android:orientation="vertical"tools:context=".MainActivity"><LinearLayoutandroid:layout_width="match_parent"android:layout_height="match_parent"android:orientation="vertical"><com.github.mikephil.charting.charts.LineChartandroid:id="@+id/lineChart"android:layout_width="match_parent"android:layout_marginLeft="10dp"android:layout_marginRight="10dp"android:layout_marginBottom="10dp"android:layout_height="220dp"android:layout_centerInParent="true"/></LinearLayout>
</ScrollView>
4.设置自定义标记提示框
import android.content.Context;
import android.text.format.DateFormat;
import android.widget.TextView;import com.example.m1571.mympandroidchart.R;
import com.github.mikephil.charting.components.MarkerView;
import com.github.mikephil.charting.data.Entry;
import com.github.mikephil.charting.highlight.Highlight;
import com.github.mikephil.charting.utils.MPPointF;import java.text.DecimalFormat;public class MyMarkersView extends MarkerView{private TextView tvContent;private DecimalFormat format = new DecimalFormat("##0");public MyMarkersView(Context context) {super(context, R.layout.layout_markerview);//这个布局自己定义tvContent = (TextView) findViewById(R.id.tvContent);}//显示的内容@Overridepublic void refreshContent(Entry e, Highlight highlight) {tvContent.setText(format(e.getX())+"\n"+format.format(e.getY())+"辆");super.refreshContent(e, highlight);}//标记相对于折线图的偏移量@Overridepublic MPPointF getOffset() {return new MPPointF(-(getWidth() / 2), -getHeight());}//时间格式化(显示今日往前30天的每一天日期)public String  format(float x){int IValue = (int) x;CharSequence format = DateFormat.format("MM/dd",System.currentTimeMillis()-(long)(list.size()-IValue)*24*60*60*1000);// CharSequence format = DateFormat.format("MM月dd日",// System.currentTimeMillis()-(long) (30-(int)x)*24*60*60*1000);return format.toString();}}
5.提示框布局:
<?xml version="1.0" encoding="utf-8"?>
<LinearLayoutxmlns:android="http://schemas.android.com/apk/res/android" android:layout_width="match_parent"android:layout_height="match_parent"><LinearLayoutandroid:background="@drawable/bg_shape_c"android:layout_width="match_parent"android:paddingLeft="10dp"android:paddingRight="10dp"android:paddingTop="6dp"android:paddingBottom="6dp"android:layout_height="wrap_content"><TextViewandroid:id="@+id/tvContent"android:text="KING"android:layout_width="wrap_content"android:layout_height="wrap_content" /></LinearLayout></LinearLayout>
6.设置可以左右滑动的折线图效果:
//xAxis.setLabelCount(list.size() / 6, false);//注意请注释掉这一句代码
lineChart.setVisibleXRange(0, 6);   //x轴可显示的坐标范围lineChart.setDrawGridBackground(false); //表格颜色lineChart.setGridBackgroundColor(Color.GRAY & 0x70FFFFFF); //表格的颜色,设置一个透明度lineChart.setTouchEnabled(true); //可点击lineChart.setDragEnabled(true);  //可拖拽lineChart.setScaleEnabled(false);  //可缩放lineChart.setPinchZoom(false);
//        lineChart.setBackgroundColor(Color.WHITE); //设置背景颜色
7.设置折线中圆点对应的颜色(设置多种颜色值)
//根据数值大小区间来设置圆点对应的颜色//在方法中判断数值的大小和对应设置的颜色private static List<Integer> getLineColors(List<Entry> yValues,int normalColor, int exceColor, int exceQcColor) {List<Integer> list = new ArrayList<>();
//		float maxSD = (float) (targetValue + sdValue * sdMultiple);
//		float minSD = (float) (targetValue - sdValue * sdMultiple);float maxSD = 3;float minSD = 0;for (int i = 0; i < yValues.size(); i++) {Entry entry = yValues.get(i);
//            if (errIndexs.contains(i)) {  //限值异常质控不用和sd比较确定显示什么颜色
//                list.add(exceQcColor);
//                continue;
//            }
//			if (entry.getVal() >= maxSD || entry.getVal() < minSD) {//此处的entry.getVal()(2.1.6版本)等于entry.getY()(3.0.1版本)if (entry.getY() >= 6) {list.add(exceColor);} else if(entry.getY() == 5){list.add(normalColor);} else if(entry.getY() < 5){
//                list.add(exceQcColor);}}return list;}
//设置折线圆点多种颜色值List<Integer> lineColors = getLineColors(entries, Color.RED, Color.YELLOW,Color.BLUE);lineDataSet.setCircleColors(lineColors);// 圆形的颜色8.设置显示折线图圆点的数值,可以自定义单位:
//设置圆点显示内容替换原来的%为元lineDataSet.setValueFormatter(new TestDefaultValueFormatter()); //1.在PieChartUtil 中创建内部类private class TestDefaultValueFormatter implements IValueFormatter {private DecimalFormat mFormat;public TestDefaultValueFormatter(){mFormat = new DecimalFormat("###");//十进制格式}@Overridepublic String getFormattedValue(float value, Entry entry, int dataSetIndex, ViewPortHandler viewPortHandler) {return mFormat.format(value)+"辆";}}lineDataSet.setDrawValues(true);//设置是否显示点的坐标值
其它案例:
https://github.com/897532167/ChartManager
https://github.com/JinBoy23520/MPAndroidChartDemoByJin
这篇关于Android 图表开源框架之MPAndroidChart LineChart折线图(三)的文章就介绍到这儿,希望我们推荐的文章对编程师们有所帮助!


