本文主要是介绍极简java性能监控工具-arthas(阿尔萨斯),希望对大家解决编程问题提供一定的参考价值,需要的开发者们随着小编来一起学习吧!
1 Arthas(阿尔萨斯)是什么?

Arthas(阿尔萨斯)是阿里巴巴开源的 Java 诊断工具,深受开发者喜爱。
当你遇到以下类似问题而束手无策时, Arthas可以帮助你解决:这个类从哪个 jar 包加载的?
为什么会报各种类相关的 Exception?
我改的代码为什么没有执行到?难道是我没 commit?
分支搞错了?遇到问题无法在线上 debug,难道只能通过加日志再重新发布吗?
线上遇到某个用户的数据处理有问题,但线上同样无法 debug,线下无法重现!
是否有一个全局视角来查看系统的运行状况?
有什么办法可以监控到 JVM的实时运行状态?
Arthas 采用命令行交互模式,同时提供丰富的 Tab 自动补全功能,进一步方便进行问题的定位和诊断。
2 安装Arthas(阿尔萨斯)
wget https://arthas.aliyun.com/arthas-boot.jar;
java -jar arthas-boot.jar
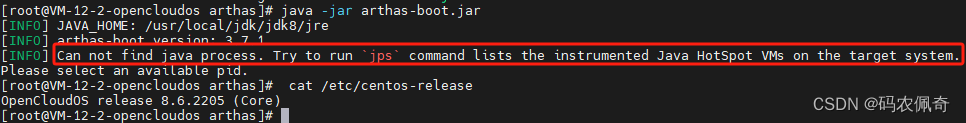
发生这个问题的原因有两个:
一个是目前机器中没有安装Oracle的jdk;
一个是没有java程序运行
解决方案:
1.卸载openJDK  安装Oracle的jdk
参加地址:https://blog.csdn.net/Jiao1225/article/details/129929943
JDK1.8 下载地址 https://pan.baidu.com/s/1kZyeR_ISALYjNAQcwxIubw?pwd=v416
2.机器运行一个java程序 执行jps获取该java程序pid
启动arths 并指定该java程序pid 表示监控该java进程
java -jar arthas-boot.jar  pid
发现又报错了!!!
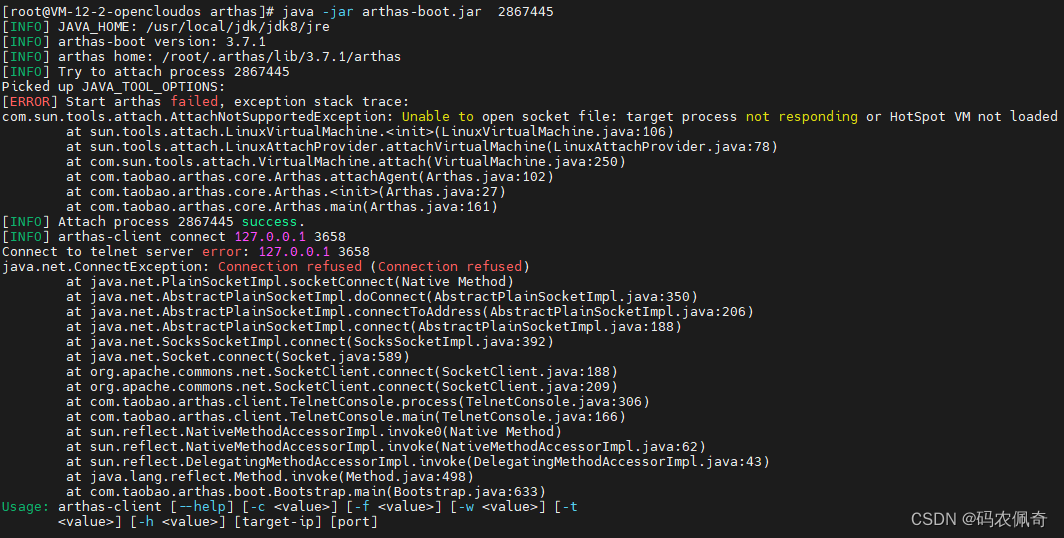
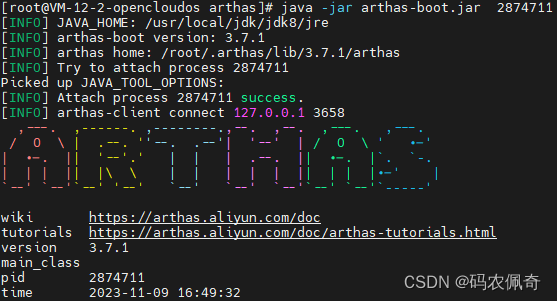
目前发生该问题原因是我服务启动失败了,修复后正常执行了,出现Arths图标表示执行成功!
3 简单使用Arths
arths 命令详解
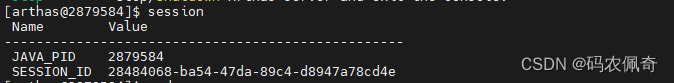
[arthas@2879584]$ helpNAME DESCRIPTIONhelp Display Arthas Helpauth Authenticates the current sessionkeymap Display all the available keymap for the specified connection.sc Search all the classes loaded by JVMsm Search the method of classes loaded by JVMclassloader Show classloader infojad Decompile classgetstatic Show the static field of a classmonitor Monitor method execution statistics, e.g. total/success/failure count, average rt, fail rate, etc.stack Display the stack trace for the specified class and methodthread Display thread info, thread stacktrace Trace the execution time of specified method invocation.watch Display the input/output parameter, return object, and thrown exception of specified method invocationtt Time Tunneljvm Display the target JVM informationmemory Display jvm memory info.perfcounter Display the perf counter information.ognl Execute ognl expression.mc Memory compiler, compiles java files into bytecode and class files in memory.redefine Redefine classes. @see Instrumentation#redefineClasses(ClassDefinition...)retransform Retransform classes. @see Instrumentation#retransformClasses(Class...)dashboard Overview of target jvm's thread, memory, gc, vm, tomcat info.dump Dump class byte array from JVMheapdump Heap dumpoptions View and change various Arthas optionscls Clear the screenreset Reset all the enhanced classesversion Display Arthas versionsession Display current session informationsysprop Display and change the system properties.sysenv Display the system env.vmoption Display, and update the vm diagnostic options.logger Print logger info, and update the logger levelhistory Display command historycat Concatenate and print filesbase64 Encode and decode using Base64 representationecho write arguments to the standard outputpwd Return working directory namembean Display the mbean informationgrep grep command for pipes.tee tee command for pipes.profiler Async Profiler. https://github.com/jvm-profiling-tools/async-profilervmtool jvm toolstop Stop/Shutdown Arthas server and exit the console.session 查看当前会话信息
jvm dashboard面板
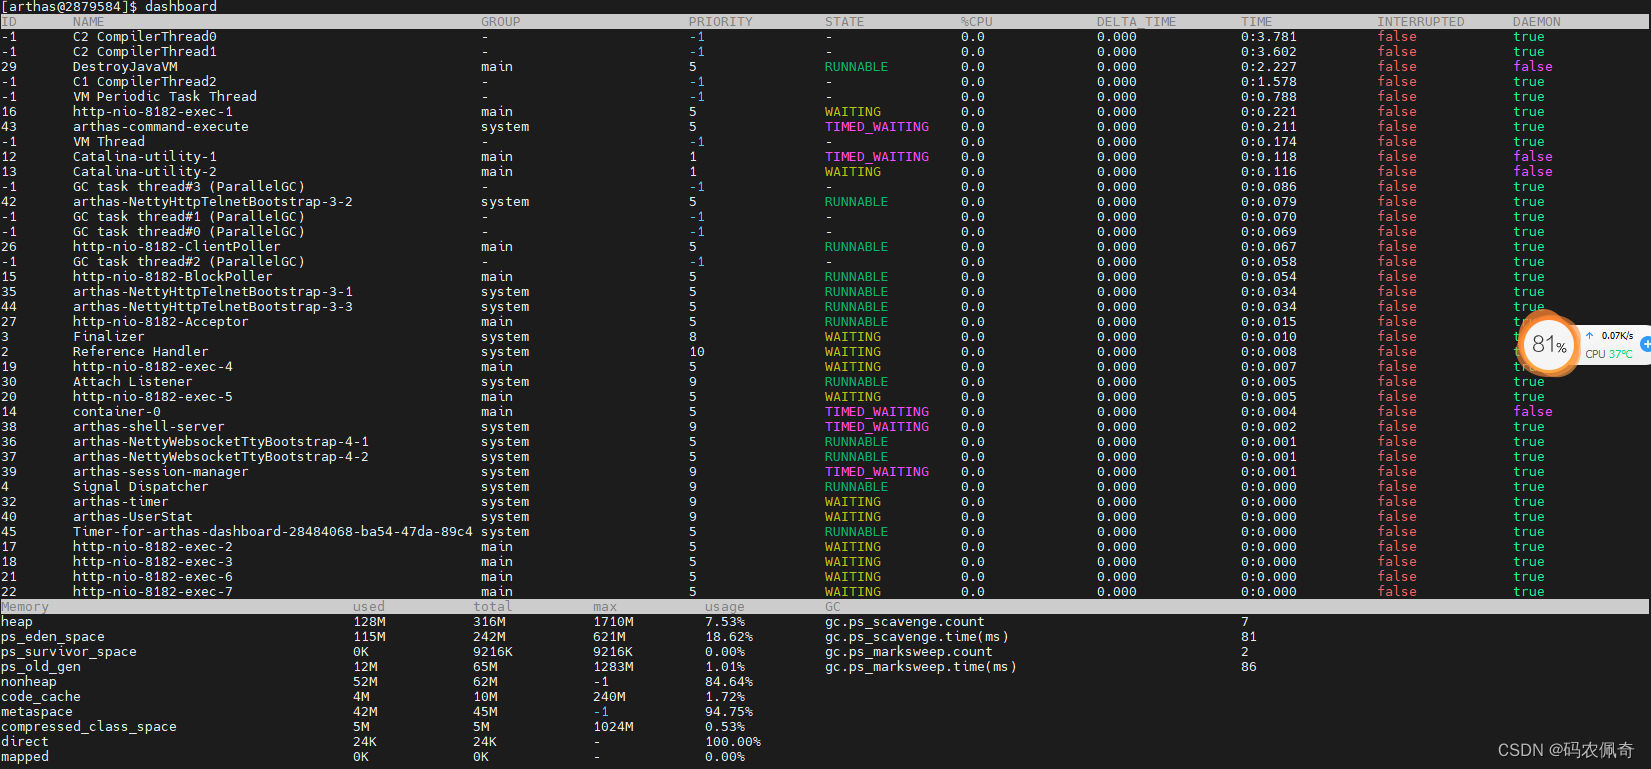
实时执行 输入 q 或者 Ctrl+C 可以退出dashboard命令
- ID:Java级别的线程ID,注意这个ID不能跟jstack中的nativeID一一对应 NAME:
- 线程名 GROUP:线程组名
- PRIORITY:线程优先级, 1~10之间的数字,越大表示优先级越高
- STATE:线程的状态
- CPU%:线程消耗的cpu占比,采样100ms,将所有线程在这100ms内的cpu使用量求和,再算出每个线程的cpu使用占比。
- TIME:线程运行总时间,数据格式为分:秒
- INTERRUPTED:线程当前的中断位状态
- DAEMON:是否是daemon线程
死锁线程查看
thread -b
查看处于等待状态的线程
thread --state WAITING
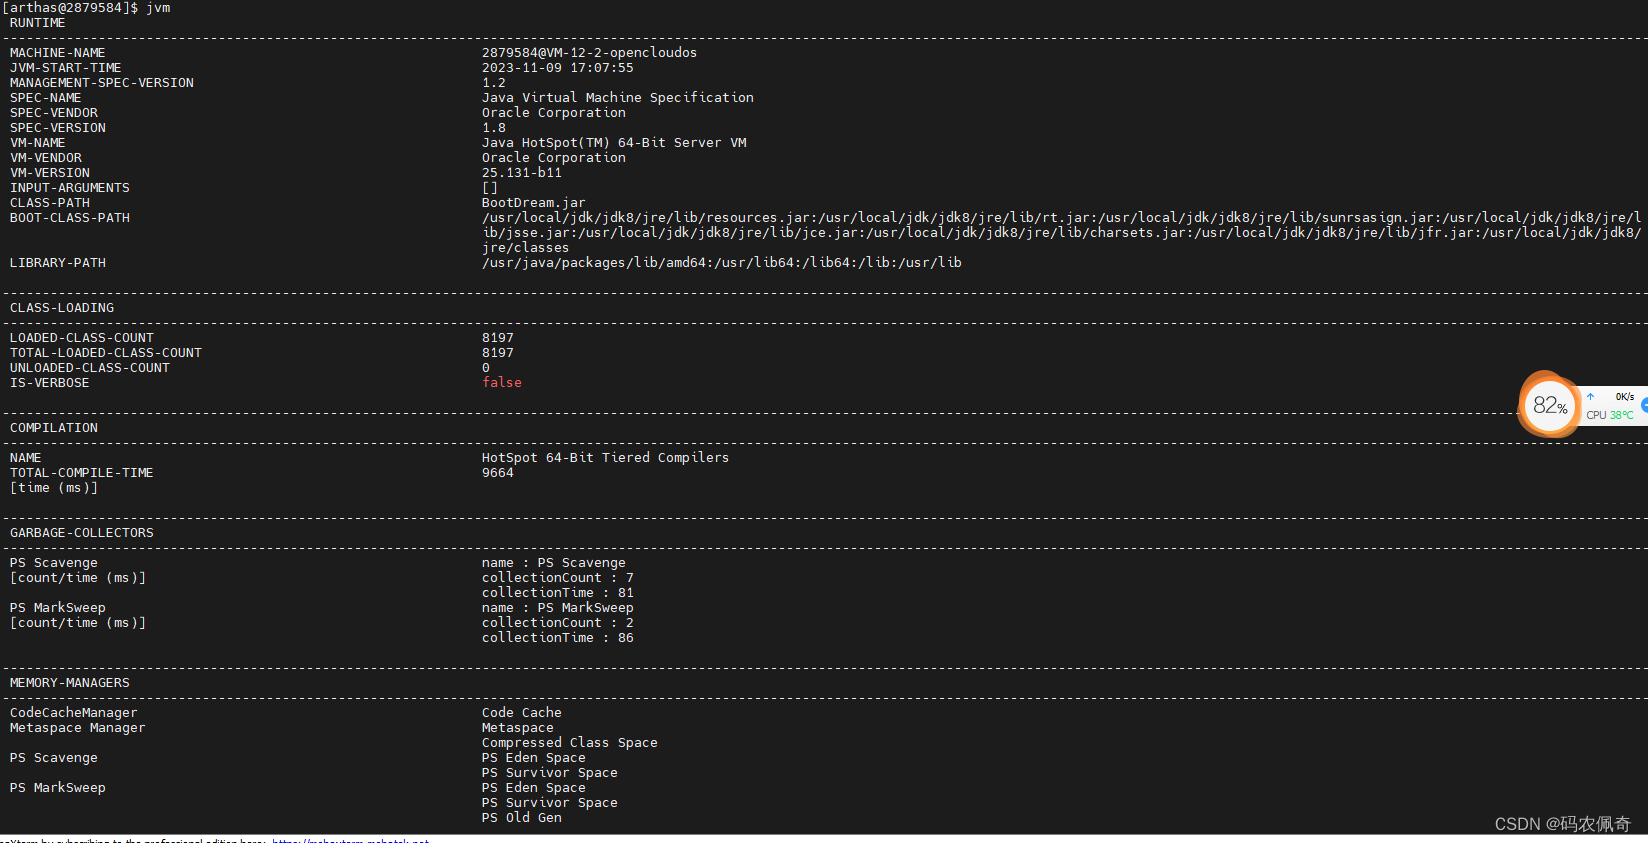
查看Jvm虚拟机信息
trace实战
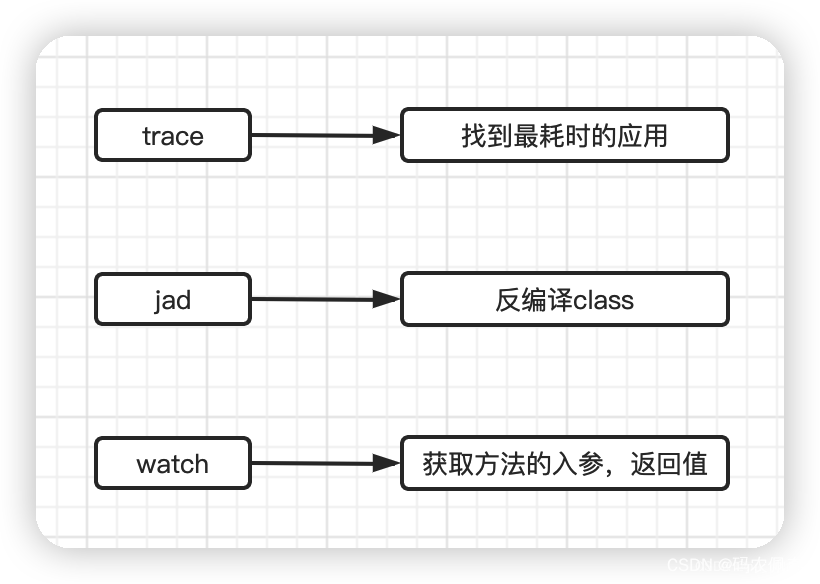
trace *.SystemController showSystemInfo
由于我机器是空跑的web项目 因此我写了一个controller 获取jvm的内存 线程 环境等信息
因此 我检查一下该controller类中的调用最耗时的方法是哪个!
```java
package com.boot.bootdream.controller;import com.alibaba.fastjson.JSON;
import lombok.extern.slf4j.Slf4j;
import org.springframework.web.bind.annotation.RequestMapping;
import org.springframework.web.bind.annotation.RestController;import java.lang.management.*;
import java.util.List;
@RestController
@Slf4j
public class SystemController {@RequestMapping("system")public  String   showSystemInfo(){showJvmInfo();showMemoryInfo();showSystem();showClassLoading();showCompilation();showThread();showGarbageCollector();showMemoryManager();showMemoryPool();return "程序执行成功!";}public static void showJvmInfo() {RuntimeMXBean rtMxBean = ManagementFactory.getRuntimeMXBean();System.out.println("Java 虚拟机的运行时系统(RuntimeMXBean):");System.out.println("jvm vendor:" + rtMxBean.getVmVendor());System.out.println("jvm name:" + rtMxBean.getVmName());System.out.println("jvm version:" + rtMxBean.getVmVersion());System.out.println("jvm bootClassPath:" + rtMxBean.getBootClassPath());System.out.println("jvm start time:" + rtMxBean.getStartTime());}/*** Java 虚拟机的内存系统*/public static void showMemoryInfo() {MemoryMXBean memoryMxBean = ManagementFactory.getMemoryMXBean();MemoryUsage heap = memoryMxBean.getHeapMemoryUsage();System.out.println("Java 虚拟机的内存系统(MemoryMXBean):");System.out.println("Heap " + heap.toString());System.out.println("Heap" +" init:" + heap.getInit() + byte2Mb(heap.getInit()) +" used:" + byte2Mb(heap.getUsed()) +" committed:" + byte2Mb(heap.getCommitted()) +" max:" + byte2Mb(heap.getMax()));System.out.println("\n");}private static String byte2Mb(long source) {return "(" + source / 1024 / 1024 + "mb)";}/*** Java 虚拟机在其上运行的操作系统*/public static void showSystem() {OperatingSystemMXBean operatingSystemMxBean = ManagementFactory.getOperatingSystemMXBean();System.out.println("Java 虚拟机在其上运行的操作系统(OperatingSystemMXBean):");System.out.println("Architecture(操作系统架构): " + operatingSystemMxBean.getArch());System.out.println("Processors(Java虚拟机可用的处理器数): " + operatingSystemMxBean.getAvailableProcessors());System.out.println("System name(操作系统名称): " + operatingSystemMxBean.getName());System.out.println("System version(操作系统版本): " + operatingSystemMxBean.getVersion());System.out.println("Last minute load(最后一分钟的系统负载平均值): " + operatingSystemMxBean.getSystemLoadAverage());System.out.println("\n");}/*** Java 虚拟机的类加载系统*/public static void showClassLoading() {ClassLoadingMXBean classLoadingMxBean = ManagementFactory.getClassLoadingMXBean();System.out.println("Java 虚拟机的类加载系统(ClassLoadingMXBean):");System.out.println("TotalLoadedClassCount(加载的类总数): " + classLoadingMxBean.getTotalLoadedClassCount());System.out.println("LoadedClassCount(当前加载的类的数量)" + classLoadingMxBean.getLoadedClassCount());System.out.println("UnloadedClassCount(卸载类的总数):" + classLoadingMxBean.getUnloadedClassCount());System.out.println("\n");}/*** Java 虚拟机的编译系统*/public static void showCompilation() {CompilationMXBean compilationMxBean = ManagementFactory.getCompilationMXBean();System.out.println("Java 虚拟机的编译系统(CompilationMXBean):");System.out.println("TotalCompilationTime(编译时间(毫秒)):" + compilationMxBean.getTotalCompilationTime());System.out.println("name(JIT编译器的名称):" + compilationMxBean.getName());System.out.println("\n");}/*** Java 虚拟机的线程系统*/public static void showThread() {ThreadMXBean threadMxBean = ManagementFactory.getThreadMXBean();System.out.println("Java 虚拟机的线程系统(ThreadMXBean):");System.out.println("ThreadCount(当前活动线程数)" + threadMxBean.getThreadCount());System.out.println("PeakThreadCount(峰值实时线程计数)" + threadMxBean.getPeakThreadCount());System.out.println("TotalStartedThreadCount(启动的线程总数)" + threadMxBean.getTotalStartedThreadCount());System.out.println("DaemonThreadCount(当前活动后台进程线程数)" + threadMxBean.getDaemonThreadCount());System.out.println("isSynchronizerUsageSupported(虚拟机是否支持监视可下载同步器的使用情况)" + threadMxBean.isSynchronizerUsageSupported());System.out.println("AllThreadIds(所有活动线程ID):" + JSON.toJSONString(threadMxBean.getAllThreadIds()));System.out.println("CurrentThreadUserTime(当前线程在用户模式下执行的CPU时间(以纳秒为单位))" + threadMxBean.getCurrentThreadUserTime());for (ThreadInfo threadInfo : threadMxBean.getThreadInfo(threadMxBean.getAllThreadIds(), 1)) {System.out.print(threadInfo.getThreadId() + threadInfo.toString());}System.out.println("\n");}/*** Java 虚拟机中的垃圾回收器。*/public static void showGarbageCollector() {List<GarbageCollectorMXBean> garbageCollectorMXBeans = ManagementFactory.getGarbageCollectorMXBeans();System.out.println("Java 虚拟机中的垃圾回收器(GarbageCollectorMXBean):");for (GarbageCollectorMXBean collectorMxBean : garbageCollectorMXBeans) {System.out.println("name(垃圾收集器名称):" + collectorMxBean.getName());System.out.println("--CollectionCount:" + collectorMxBean.getCollectionCount());System.out.println("--CollectionTime" + collectorMxBean.getCollectionTime());System.out.println("\n");}System.out.println("\n");}/*** Java 虚拟机中的内存管理器*/public static void showMemoryManager() {List<MemoryManagerMXBean> memoryManagerMxBeans = ManagementFactory.getMemoryManagerMXBeans();System.out.println("Java 虚拟机中的内存管理器(MemoryManagerMXBean):");for (MemoryManagerMXBean managerMxBean : memoryManagerMxBeans) {System.out.println("name(内存管理器名称):" + managerMxBean.getName());System.out.println("--MemoryPoolNames:" + String.join(",", managerMxBean.getMemoryPoolNames()));System.out.println("\n");}}/*** Java 虚拟机中的内存池*/public static void showMemoryPool() {List<MemoryPoolMXBean> memoryPoolMxBeans = ManagementFactory.getMemoryPoolMXBeans();System.out.println("Java 虚拟机中的内存池(MemoryPoolMXBean):");for (MemoryPoolMXBean memoryPoolMxBean : memoryPoolMxBeans) {System.out.println("name:" + memoryPoolMxBean.getName());System.out.println("--CollectionUsage:" + memoryPoolMxBean.getCollectionUsage());System.out.println("--type:" + memoryPoolMxBean.getType());System.out.println("\n");}System.out.println("\n");}
}
监听自己编写的controller
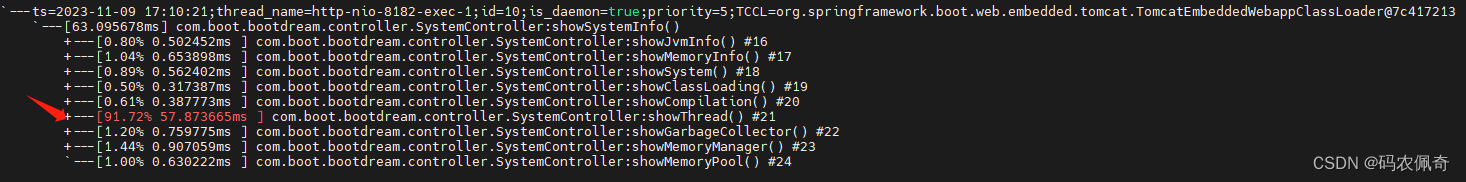
trace *.SystemController showSystemInfo
在浏览器访问http://ip:port/system
可以看到当前controller调用最耗时的方法,此时是arthas帮我们分析的
Arthas实战案例已上传网盘 有兴趣的小伙伴可以实验下!
arthas本期实战案例网盘下载地址

Arthas还有其他生成火焰图,修改jvm参数,反编译文件…
总之,arths的功能太强大了!!!
这篇关于极简java性能监控工具-arthas(阿尔萨斯)的文章就介绍到这儿,希望我们推荐的文章对编程师们有所帮助!


