本文主要是介绍python3 绘制三维空间圆的散点图,希望对大家解决编程问题提供一定的参考价值,需要的开发者们随着小编来一起学习吧!
python 没有方便好用的直接画圆的方法,一般而言,都是使用参数方程画圆,要在三维空间画圆,可利用三维空间中圆的参数方程:
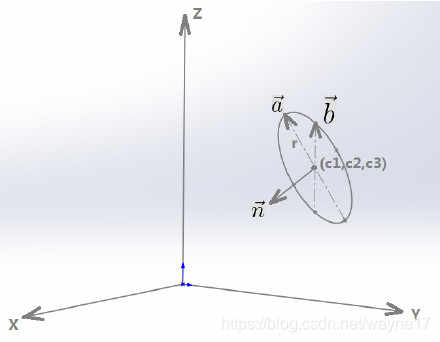
{ x ( θ ) = c 1 + r c o s ( θ ) a 1 + r s i n ( θ ) b 1 y ( θ ) = c 2 + r c o s ( θ ) a 2 + r s i n ( θ ) b 2 z ( θ ) = c 3 + r c o s ( θ ) a 3 + r s i n ( θ ) b 3 \left\{ \begin{array}{cl} x(\theta)=c_1+r cos(\theta)a_1 + r sin(\theta)b_1 \\ y(\theta)=c_2+r cos(\theta)a_2+ r sin(\theta)b_2 \\ z(\theta)=c_3+r cos(\theta)a_3 + r sin(\theta)b_3 \end{array} \right . ⎩⎨⎧x(θ)=c1+rcos(θ)a1+rsin(θ)b1y(θ)=c2+rcos(θ)a2+rsin(θ)b2z(θ)=c3+rcos(θ)a3+rsin(θ)b3
其中 ( a 1 , a 2 , a 3 ) (a_1, a_2, a_3) (a1,a2,a3) 和 ( b 1 , b 2 , b 3 ) (b_1, b_2, b_3) (b1,b2,b3)代表圆面内的单位向量 a ⃗ \vec{a} a 和 b ⃗ \vec{b} b,它们相互垂直,且都垂直于圆的法向量 n ⃗ \vec{n} n, ( c 1 , c 2 , c 3 ) (c_1, c_2, c_3) (c1,c2,c3)为圆心坐标。
因为这里我的需求是生成空间圆的散点图(带噪声)用于聚类试验用,所以代码里加了一些噪声。

import numpy as np
import matplotlib.pyplot as plt
from mpl_toolkits.mplot3d import Axes3D # 绘制3d散点图# center 为圆心,n 为圆法向量,noise 为噪声范围, r为半径
def generate_3D_circle(sample_num = 100, r = 1.8, noise = 0.3, center = [0, 0, 0], n = [1, 0, 0]):sample = np.linspace(-np.pi, np.pi, sample_num)a = np.cross(n, [1, 0, 0]) # np.cross(), 向量叉积if np.all(a == 0):  # a 是否为0向量a = np.cross(n, [0, 1, 0])b = np.cross(n, a)  # 归一化a,b(圆面两个互垂直向量)a = a / np.linalg.norm(a)b = b / np.linalg.norm(b)# 利用空间圆的参数方程生成圆c1 = center[0] * np.ones((sample_num, 1))c2 = center[1] * np.ones((sample_num, 1))c3 = center[2] * np.ones((sample_num, 1))[c_x, c_y, c_z] = c1 + r*a[0]*np.cos(sample) + r*b[0]*np.sin(sample),\c2 + r*a[1]*np.cos(sample) + r*b[1]*np.sin(sample),\c3 + r*a[2]*np.cos(sample) + r*b[2]*np.sin(sample)# 加噪声nos1 = 0.2 * np.random.normal(1.3, noise, sample_num)nos2 = 0.2 * np.random.normal(1.1, noise, sample_num)nos3 = 0.2 * np.random.normal(1.1, noise, sample_num)c_y += nos1c_x += nos2c_z += nos3return c_x, c_y, c_z# 散点生成
x=[]x.append(generate_3D_circle(center=[2, 2, 0], n = [-1, 1, 0]))
x.append(generate_3D_circle(center=[-2, 2, 0], n = [1, 1, 0]))
x.append(generate_3D_circle(center=[2, -2, 0], n = [1, 1, 0]))
x.append(generate_3D_circle(center=[-2, -2, 0], n = [-1, 1, 0]))
x.append(generate_3D_circle(center=[0, 0, 0], n = [0, 0, 1]))# 绘制散点图
fig = plt.figure()
ax = Axes3D(fig)
for i in x:ax.scatter(i[0], i[1], i[2])# X, Y, Z = [], [], []
# for i in x:
#     X.append(i[0])
#     Y.append(i[1])
#     Z.append(i[2])
# ax.scatter(X, Y, Z)
plt.show()
参考
http://blog.sina.com.cn/s/blog_6496e38e0102vi7e.html
这篇关于python3 绘制三维空间圆的散点图的文章就介绍到这儿,希望我们推荐的文章对编程师们有所帮助!


