本文主要是介绍Vue+TP分离开发实时疫情动态地图,希望对大家解决编程问题提供一定的参考价值,需要的开发者们随着小编来一起学习吧!
准备工作及运行环境:
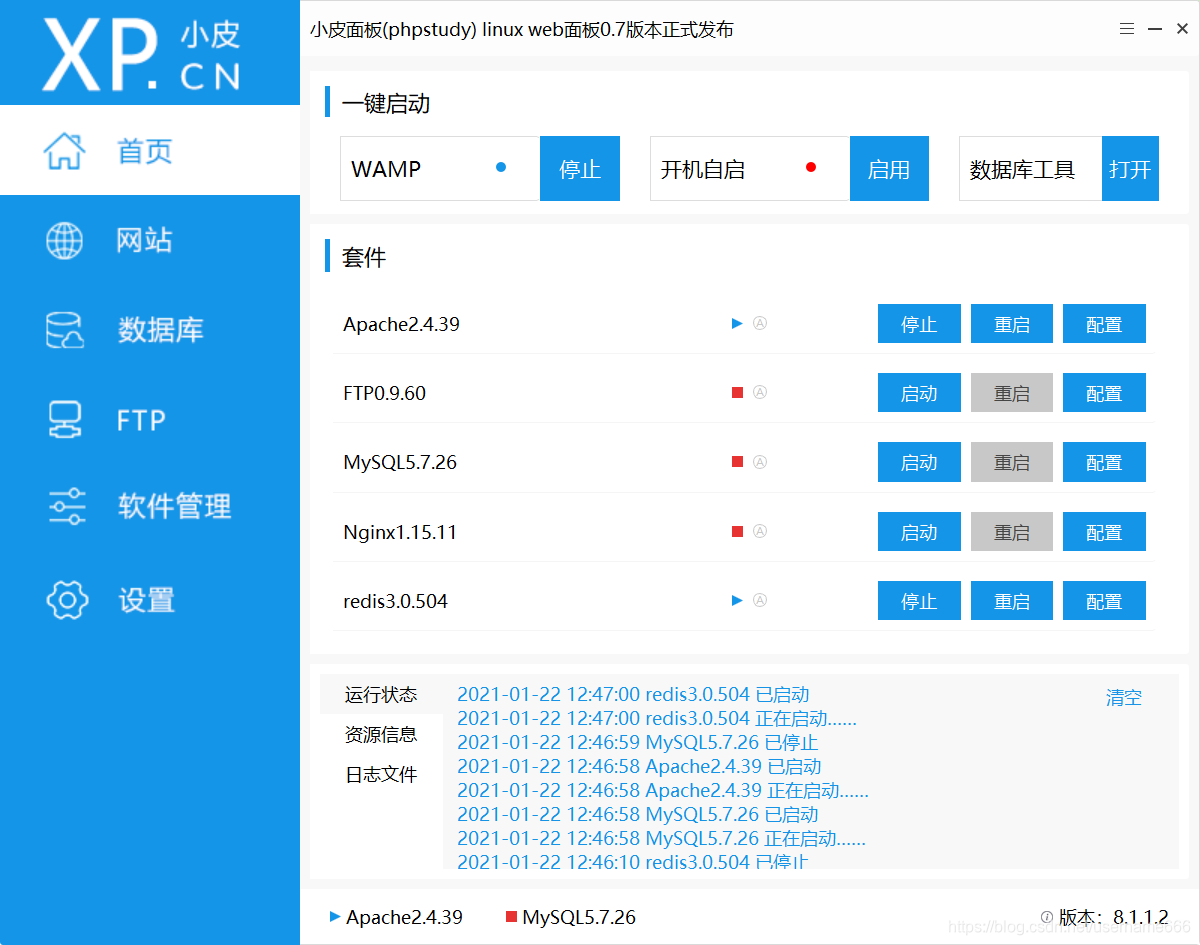
- phpstudy集成环境(安装Apache、redis)
- PhpStorm
- IDEA
- 已配置好node.js、npm
- 课件下载地址:https://www.php.cn/xiazai/learn/6678
1.前端主要文件
需要安装的插件主要有axios, echarts。
main.js:
// The Vue build version to load with the `import` command
// (runtime-only or standalone) has been set in webpack.base.conf with an alias.
import Vue from 'vue'
import App from './App'
import router from './router'
import axios from 'axios'Vue.config.productionTip = false
Vue.prototype.$axios = axios
// 与配置的域名一致
Vue.prototype.$host = 'http://inews.io2/index.php/'/* eslint-disable no-new */
new Vue({el: '#app',router,components: { App },template: '<App/>'
})
Main.vue
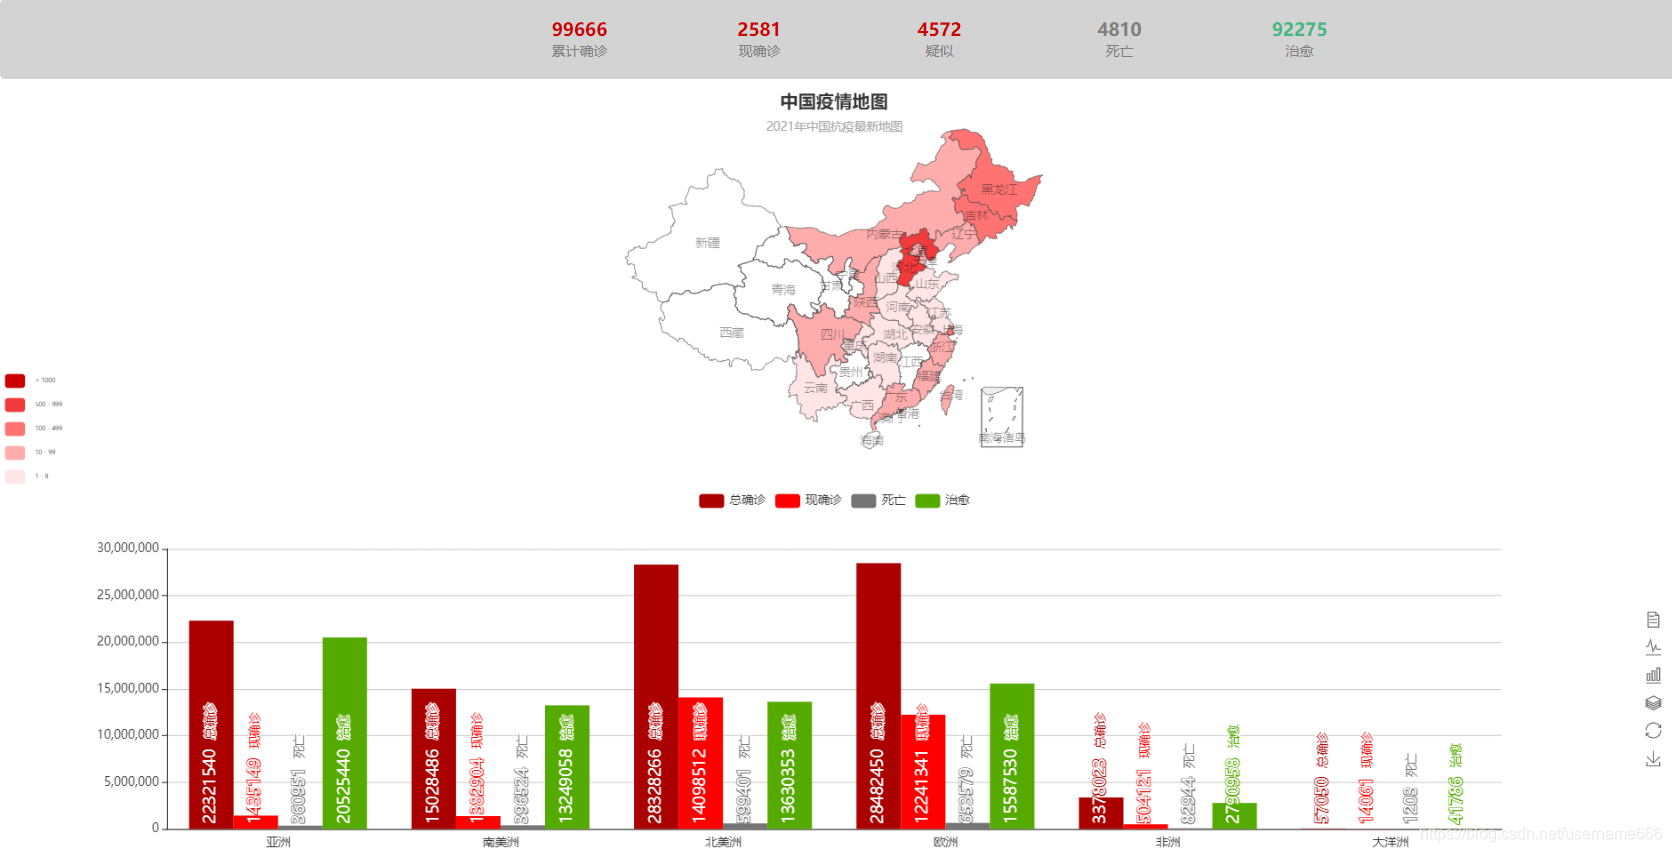
<template><div><h3>中国疫情</h3><p class="txt">来源:各地官方通报及权威媒体报道</p><p class="txt">更新:{{update_time}}</p><div class="flexbox"><div class="item"><div class="red bold">{{diagnosed}}</div><div class="gray tittle">累计确诊</div></div><div class="item"><div class="red bold">{{currentDiagnosed}}</div><div class="gray tittle">现确诊</div></div><div class="item"><div class="red bold">{{suspect}}</div><div class="gray tittle">疑似</div></div><div class="item"><div class="gray bold">{{death}}</div><div class="gray tittle">死亡</div></div><div class="item"><div class="green bold">{{cured}}</div><div class="gray tittle">治愈</div></div></div><!-- 地图 --><div :style="{height:'400px',width:'100%'}" ref="myMap"></div><!-- 柱状图 --><div ref="bar" :style="{height:'400px',width:'100%'}"></div></div>
</template><script>// 引入地图模块import echarts from 'echarts'require('echarts/map/js/china.js')export default {name: 'Main',data() {return {flag: true,msg: '查看更多地区',classA: 'container',expanded: false,update_time: '',cured: 0,currentDiagnosed: 0,death: 0,diagnosed: 0,suspect: 0,newList: [],area: [],state: [],die: '',ccfd: '',cfd: '',crd: ''}},created() {this.$axios.get(this.$host + 'api/index').then(res => {const data = res.data;this.cured = data.cured;this.death = data.death;this.currentDiagnosed = data.curDiagnosed;this.suspect = data.suspect;this.diagnosed = data.diagnosed;this.update_time = data.update_time;this.newList = data.newListthis.area = data.area;this.die = data.total_diethis.ccfd = data.total_ccfdthis.cfd = data.total_cfdthis.crd = data.total_crdthis.state = data.statethis.myMap();this.bar();}).catch(res => {console.log(res);})},methods: {bar() {var myChartBar = echarts.init(this.$refs.bar); //这里是为了获得容器所在位置var app = {};var option = null;var posList = ['left', 'right', 'top', 'bottom','inside','insideTop', 'insideLeft', 'insideRight', 'insideBottom','insideTopLeft', 'insideTopRight', 'insideBottomLeft', 'insideBottomRight'];app.configParameters = {rotate: {min: -90,max: 90},align: {options: {left: 'left',center: 'center',right: 'right'}},verticalAlign: {options: {top: 'top',middle: 'middle',bottom: 'bottom'}},position: {options: echarts.util.reduce(posList, function(map, pos) {map[pos] = pos;return map;}, {})},distance: {min: 0,max: 100}};app.config = {rotate: 90,align: 'left',verticalAlign: 'middle',position: 'insideBottom',distance: 5,onChange: function() {var labelOption = {normal: {rotate: app.config.rotate,align: app.config.align,verticalAlign: app.config.verticalAlign,position: app.config.position,distance: app.config.distance}};myChartBar.setOption({series: [{label: labelOption}, {label: labelOption}, {label: labelOption}, {label: labelOption}]});}};var labelOption = {show: true,position: app.config.position,distance: app.config.distance,align: app.config.align,verticalAlign: app.config.verticalAlign,rotate: app.config.rotate,formatter: '{c}  {name|{a}}',fontSize: 16,rich: {name: {textBorderColor: '#fff'}}};var option = {color: ['#aa0000', '#ff0000', '#747474', '#55aa00'],tooltip: {trigger: 'axis',axisPointer: {type: 'shadow'}},legend: {data: ['总确诊', '现确诊', '死亡', '治愈']},toolbox: {show: true,orient: 'vertical',left: 'right',top: 'center',feature: {mark: {show: true},dataView: {show: true,readOnly: false},magicType: {show: true,type: ['line', 'bar', 'stack', 'tiled']},restore: {show: true},saveAsImage: {show: true}}},xAxis: [{type: 'category',axisTick: {show: false},data: this.state}],yAxis: [{type: 'value'}],series: [{name: '总确诊',type: 'bar',barGap: 0,label: labelOption,data: this.cfd},{name: '现确诊',type: 'bar',label: labelOption,data: this.ccfd},{name: '死亡',type: 'bar',label: labelOption,data: this.die},{name: '治愈',type: 'bar',label: labelOption,data: this.crd}]};if (option && typeof option === "object") {myChartBar.setOption(option, true);}},myMap() {var myMap = echarts.init(this.$refs.myMap); //这里是为了获得容器所在位置myMap.setOption({backgroundColor: "#FFFFFF",title: {text: '中国疫情地图',subtext: '2021年中国抗疫最新地图',x: 'center'},// 鼠标移到图里面的浮动提示框tooltip: {// 触发trigger: 'item',formatter(params, ticket, callback) {let ccfd,cfd,die,crdif (params.data) {ccfd = params.data.value // 现确诊cfd = params.data.confirmedCount // 总确诊die = params.data.deadCount // 死亡crd = params.data.curedCount // 治愈} else {ccfd = 0cfd = 0die = 0crd = 0}let htmlStr =`<div style = 'font-size:18px';padding-bottom:10px>${params.name}</div><p style='text-align:left;margin-top:10px;'>现确诊:${ccfd}<br/>总确诊:${cfd}<br/>死亡:${die}<br/>治愈:${crd}<br/></p>`return htmlStr},backgroundColor: "#abc", //提示标签背景颜色},geo: { // 这个是重点配置区map: 'china', // 表示中国地图roam: true,label: {normal: {show: true, // 是否显示对应地名textStyle: {color: 'rgba(0,0,0,0.4)'}}}},//左侧小导航图标visualMap: {show: true,x: 'left',y: 'bottom',textStyle: {fontSize: 6},splitList: [{start: 1000}, {start: 500,end: 999}, {start: 100,end: 499},{start: 10,end: 99}, {start: 1,end: 9},],color: ['#cc0000', '#ff4d4d', '#ff9999', '#ffe5e5']},series: [{type: 'scatter',coordinateSystem: 'geo' // 对应上方配置},{type: 'map',geoIndex: 0,data: this.newList}]})}}}
</script><style scoped>.txt {font-size: 14px;color: grey;}.flexbox {margin-bottom: 10px;width: 100%;height: 80px;background-color: lightgray;border-radius: 5px;display: flex;justify-content: center;align-items: center;}.item {flex-direction: column;display: flex;width: 80px;height: 80px;margin: 0 50px;/* border:1px solid red; */justify-content: center;align-items: center;}.red {color: #cc0000}.green {color: #42B983;}.gray {color: gray}.tittle {font-size: 14px;}.bold {font-weight: 600;font-size: 18px;}
</style>
2.TP6后端主要文件
Api.php:
<?php
namespace app\index\controller;
use app\BaseController;
use think\cache\driver\Redis;
class Api extends BaseController{public function index(){$redis = new Redis();$cor_innews = $redis->get('cor_innews');$cor_exnews = $redis->get('cor_exnews');if(!$cor_innews||!$cor_exnews){// 国内数据$in_res =  file_get_contents("https://tianqiapi.com/api?version=epidemic&appid=23035354&appsecret=8YvlPNrz");// 国外数据$ex_res =  file_get_contents("http://api.tianapi.com/txapi/ncovabroad/index?key=6c6d319a9f3b53c53b375c56fbd39207");//redis缓存数据4小时$redis->set('cor_innews',$in_res,14400);$redis->set('cor_exnews',$ex_res,14400);}else{//国内疫情数据整合$in_res = json_decode($cor_innews,true);$update_time = $in_res['data']['date'];$suspect = $in_res['data']['suspect']; $curDiagnosed = $in_res['data']['currentDiagnosed'];$diagnosed = $in_res['data']['diagnosed'];$death = $in_res['data']['death'];$cured = $in_res['data']['cured'];$area = $in_res['data']['area'];//准备地图悬浮数据$list = $in_res['data']['area'];$newList = [];foreach($list as $k=>$v){$newList[$k]['name'] = $v['provinceName'];$newList[$k]['value'] = $v['currentConfirmedCount'];$newList[$k]['confirmedCount'] = $v['confirmedCount'];$newList[$k]['deadCount'] = $v['deadCount'];$newList[$k]['curedCount'] = $v['curedCount'];}//全球疫情数据汇总$ex_res = $cor_exnews;$data = json_decode($ex_res,true)['newslist'];$res=[];$res[] = getNewData("亚洲",$data);$res[] = getNewData("南美洲",$data);$res[] = getNewData("北美洲",$data);$res[] = getNewData("欧洲",$data);$res[] = getNewData("非洲",$data);$res[] = getNewData("大洋洲",$data);$total_cfd = array_column($res,'total_cfd');$total_ccfd = array_column($res,'total_ccfd');$total_crd = array_column($res,'total_crd');$total_die = array_column($res,'total_die'); $res = [];$res['area'] = $area;$res['newList']=$newList;$res['update_time']=$update_time;$res['curDiagnosed']=$curDiagnosed;$res['suspect']=$suspect;$res['diagnosed']=$diagnosed;$res['death']=$death;$res['cured']=$cured;$res['total_cfd'] = $total_cfd; $res['state'] = ['亚洲','南美洲','北美洲','欧洲','非洲','大洋洲']; $res['total_ccfd'] = $total_ccfd; $res['total_crd'] = $total_crd; $res['total_die'] = $total_die; return json($res);}}}
路由配置文件app.php:
<?php
// +----------------------------------------------------------------------
// | ThinkPHP [ WE CAN DO IT JUST THINK ]
// +----------------------------------------------------------------------
// | Copyright (c) 2006~2018 http://thinkphp.cn All rights reserved.
// +----------------------------------------------------------------------
// | Licensed ( http://www.apache.org/licenses/LICENSE-2.0 )
// +----------------------------------------------------------------------
// | Author: liu21st <liu21st@gmail.com>
// +----------------------------------------------------------------------
use think\facade\Route;Route::get('think', function () {return 'hello,ThinkPHP6!';
});Route::get('hello/:name', 'index/hello');//后端跨域路由配置
Route::get('api/index','api/index')->allowCrossDomain();
3.配置及运行
- 打开phpstudy集成面板
- 新建网站,取名为inews.io2
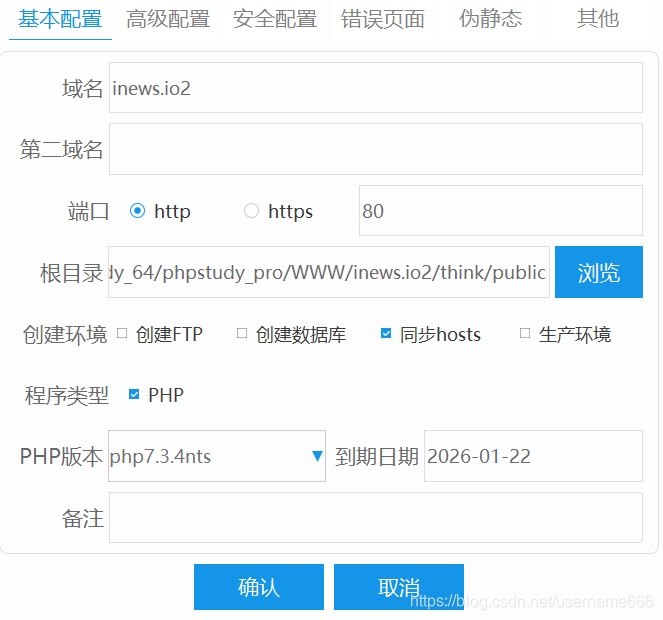
- 修改httpd-vhost.conf文件中的规则
#开启重写RewriteEngine onRewriteCond $1 !^(index\.php|\/public)#重写规则:可以不需要输入index.php来进行访问RewriteRule ^(.*)$ /index.php/$1 [L]
使用IDEA打开corno项目,安装依赖,使用npm run dev命令运行,打开浏览器,访问localhost:8080。
参考文章链接:
- https://www.it610.com/article/1296333776644808704.htm
- https://blog.csdn.net/weixin_42627280/article/details/93040217
这篇关于Vue+TP分离开发实时疫情动态地图的文章就介绍到这儿,希望我们推荐的文章对编程师们有所帮助!


