本文主要是介绍Echarts 类似进度条样式 Label 设置在柱状图的顶端外侧,希望对大家解决编程问题提供一定的参考价值,需要的开发者们随着小编来一起学习吧!
最近项目中写一个大屏演示,里面多数是Echars 图表,因为大多数都需要自己设置一些特性,才能达到效果,因此好好读了Echarts 的文档,尤其是配置项。
效果图
思路
左图
其中左侧是看到的一篇文章 https://blog.csdn.net/qq_41619796/article/details/88661612,类似进度条的样式,思路是echars 两个部分叠加,但时看了我们项目的效果图不太可以,因为项目效果图整个有效数据和背景部分都是有圆角的,这样两部分的连接处就会有问题。
右图
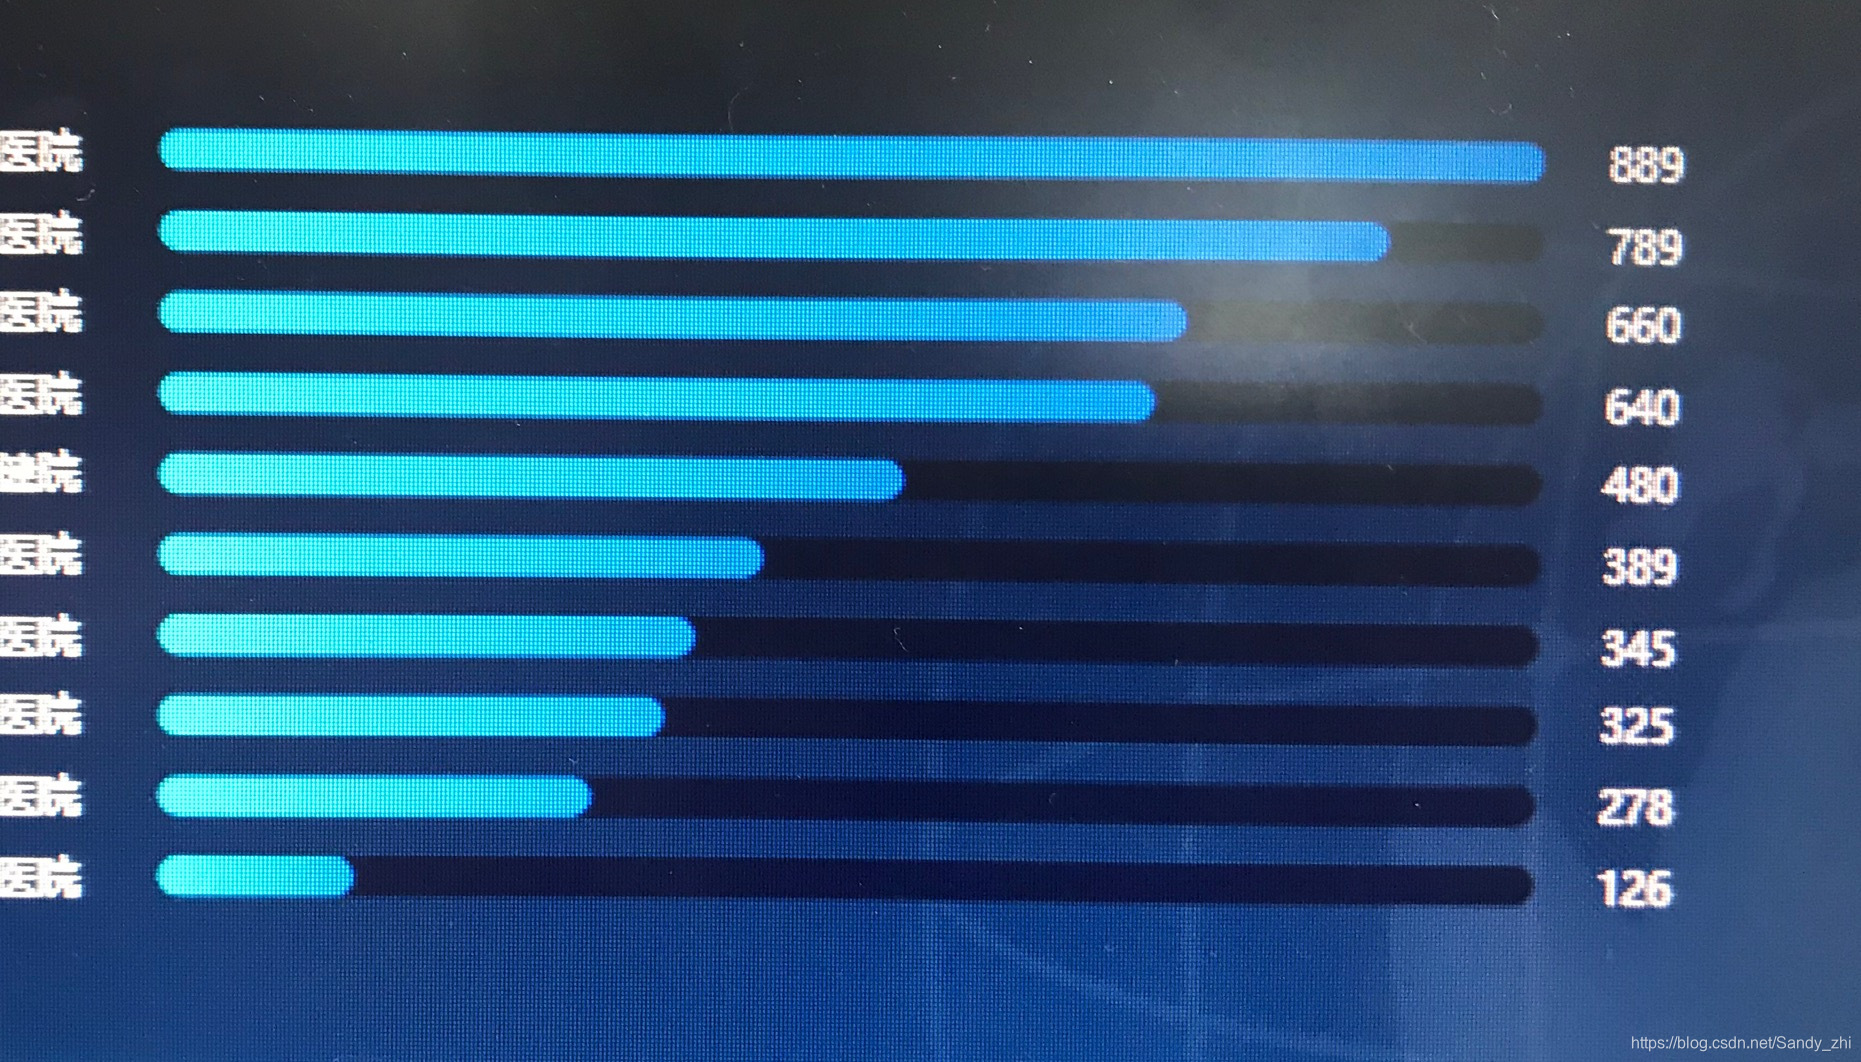
在项目实现完成后,写的demo 样式,和实际项目类似,只是实际项目是横向的,代码效果是官方案例数据,具体思路是,只需要一个坐标系,只是给柱状图设置背景及圆角,关于设置背景图在较高版本已经有现成的API,较低版本也可以实现,代码中就是,设置完成背景,因为背景的值都是最大值满格的,所以核心思路是 将有效数据的数值 设置为背景柱图的label 值,这样样式等都比较灵活方便。其中最核心的API是 label 的formatter
代码
<!DOCTYPE html>
<html lang="en"><head><meta charset="UTF-8" /><meta name="viewport" content="width=device-width, initial-scale=1.0" /><title>echars 测试</title><style>.container {display: flex;flex-wrap: wrap;justify-content: space-between;}.echarsBox,.echarBox2,.echarBox3,.echarBox4,.echarBox5,.echarBox6 {width: 500px;height: 500px;background-color: #eee;border: 5px solid #fff;}.fl {float: left;}</style>
</head><body><div class="container"><div class="echarsBox fl" id="echarBox"></div><div class="echarsBox fl" id="echarBox2"></div><div class="echarsBox fl" id="echarBox3"></div><div class="echarsBox fl" id="echarBox4"></div><div class="echarsBox fl" id="echarBox5"></div><div class="echarsBox fl" id="echarBox6"></div></div><script src="./js/echarts.js"></script><script>// 示例横向var arr = {}arr.fhId = 'echarBox' //负荷的idarr.fhArr = [{name: '10kv金羊线',value: '10'},{name: '10kv金海线',value: '20'},{name: '10kv金东线',value: '30'},{name: '10kv金澳线',value: '45'},{name: '10kv金叶线',value: '55'},]initEchartsFh(arr)function initEchartsFh(arr) {var fhArr = arr.fhArrvar data1 = [] //可用数据var data2 = []var data3 = [] //不可用数据var data4 = [] //配置项for (i in fhArr) {data1.push(fhArr[i].value)data2.push(fhArr[i].name)}for (m in data1) {data3.push(100 - parseInt(data1[m]))}var nowNum = 0for (n in data1) {var nowA = {}nowA.value = data1[n] + '%'nowA.xAxis = nowNumnowA.yAxis = 110data4.push(nowA)nowNum++}var myChart = echarts.init(document.getElementById(arr.fhId))var option = {textStyle: {// fontSize: arr.initHeight,color: '#fff', //字体颜色},tooltip: {trigger: 'axis',textStyle: {//   fontSize: arr.initHeight,color: '#fff', //字体颜色},formatter: function (params) {return params[0].name + ': ' + params[0].value + '%'},},grid: {x: 90,y: 120,x2: 60,y2: 120,}, //直角坐标系内绘图网格,单个 grid 内最多可以放置上下两个 X 轴,左右两个 Y 轴。xAxis: {axisLabel: {textStyle: {color: '#fff',// fontSize: arr.initHeight,},},data: data2,axisTick: {//x轴刻度线show: false,},splitLine: {//网格线show: false,},axisLine: {//坐标轴线show: false,},},yAxis: {show: false,max: 110,min: 0,},series: [{name: '可用',type: 'bar',stack: '使用情况',data: data1,barWidth: 30, //柱图宽度itemStyle: {color: function (params) {var colorList = ['#C33531','#EFE42A','#64BD3D','#EE9201','#29AAE3','#B74AE5','#0AAF9F','#E89589','#16A085','#4A235A','#C39BD3 ','#F9E79F','#BA4A00','#ECF0F1','#616A6B','#EAF2F8','#4A235A','#3498DB',]return colorList[params.dataIndex]},barBorderRadius: [0, 0, 50, 50], // 统一设置四个角的圆角大小},markPoint: {symbol: 'pin', //标记类型symbolSize: 1, //图形大小itemStyle: {normal: {borderColor: '#fff',borderWidth: 1, // 标注边线线宽,单位px,默认为1label: {show: true,//   fontSize: arr.initHeight,},},},data: data4, //配置项},},{name: '不可用',type: 'bar',stack: '使用情况',data: data3,itemStyle: {color: 'rgba(255,255,255,.2)',barBorderRadius: [50, 50, 0, 0], // 统一设置四个角的圆角大小},},],}myChart.setOption(option)chart3 = myChart// myChart.on('click', function (params) {//   //		//电站负荷闪动//   powerLoad('946be6fc249e40a8a63e97e98b1c576d')//   alert('负荷点击事件')//   console.log(params)//   console.log(params.name + ':' + params.value + '%')// })}// 另一种方式实现椭圆柱状图,并且label 设置在柱状图的顶端var dataAxis = ['点', '击', '柱', '子', '或', '者', '两', '指', '在', '触', '屏', '上', '滑', '动'];var data = [220, 182, 191, 234, 290, 330, 310, 123, 442, 321, 90, 149, 210, 122];var yMax = 500;var dataShadow = [];// 将实际值显示在阴影柱的label 位置 需要对label 进行处理for (var i = 0; i < data.length; i++) {dataShadow.push({value: yMax,name: data[i]});}option = {title: {text: '圆角柱状图 label 顶端外侧',// subtext: 'Feature Sample: Gradient Color, Shadow, Click Zoom'},xAxis: {data: dataAxis,axisLabel: {inside: false,textStyle: {color: '#fff'}},axisTick: {show: false},axisLine: {show: false},z: 10},yAxis: {axisLine: {show: false},axisTick: {show: false},axisLabel: {show: false,textStyle: {color: '#999'}},splitLine: {show: false}},dataZoom: [{type: 'inside'}],series: [{ // For shadowtype: 'bar',itemStyle: {color: 'rgba(0,0,0,0.05)',barBorderRadius: 10},barGap: '-100%', // 设置背景的关键代码barCategoryGap: '40%',label: {show: true,position: 'top',color: '#fff',//label 的formatter 只能使用值 {name} 或者函数自定义值formatter: function (params) {return params.name}},data: dataShadow,animation: false},{type: 'bar',barCategoryGap: '50%',itemStyle: {barBorderRadius: 10,color: new echarts.graphic.LinearGradient(0, 0, 0, 1,[{offset: 0,color: '#83bff6'},{offset: 0.5,color: '#188df0'},{offset: 1,color: '#188df0'}])},emphasis: {itemStyle: {color: new echarts.graphic.LinearGradient(0, 0, 0, 1,[{offset: 0,color: '#2378f7'},{offset: 0.7,color: '#2378f7'},{offset: 1,color: '#83bff6'}])}},data: data}]};let myChart2 = echarts.init(document.getElementById('echarBox2'))myChart2.setOption(option)// // Enable data zoom when user click bar.// var zoomSize = 6;// myChart.on('click', function (params) {//     console.log(dataAxis[Math.max(params.dataIndex - zoomSize / 2, 0)]);//     myChart.dispatchAction({//         type: 'dataZoom',//         startValue: dataAxis[Math.max(params.dataIndex - zoomSize / 2, 0)],//         endValue: dataAxis[Math.min(params.dataIndex + zoomSize / 2, data.length - 1)]//     });// });</script>
</body></html>
实际项目实现的横向效果如下:

在看了echarts 的一些API 和 配置项之后 发现,他原来可以自定义那么多样式,开心于新发现和新收获。
除非付诸行动,否则空口无凭

这篇关于Echarts 类似进度条样式 Label 设置在柱状图的顶端外侧的文章就介绍到这儿,希望我们推荐的文章对编程师们有所帮助!


