本文主要是介绍module'matplotlib.mlab'has no attribute 'normpdf',希望对大家解决编程问题提供一定的参考价值,需要的开发者们随着小编来一起学习吧!
采用mlab中的normpdf生成高斯曲线
但是发现mlab中这个属性已经移除了,报错信息:
module 'matplotlib.mlab' has no attribute 'normpdf'
使用norm.pdf 为替代的方式
import matplotlib.mlab as mlab
import matplotlib.pyplot as plt
plt.rcParams['font.sans-serif']=['SimHei']#显示中文
import numpy as np
from scipy.stats import norm
np.random.seed(10680801)
mu=100
sigma=15
x=mu+sigma*np.random.randn(500)
num_bins=60
fig,ax=plt.subplots()
n,bins,patches=ax.hist(x,num_bins,normed=1)
y=norm.pdf(bins,mu,sigma)
ax.plot(bins,y,'--')
ax.set_xlabel('IQ')
ax.set_ylabel('概率密度')
ax.set_title(r'智商分布情况直方图')
fig.tight_layout()
plt.show()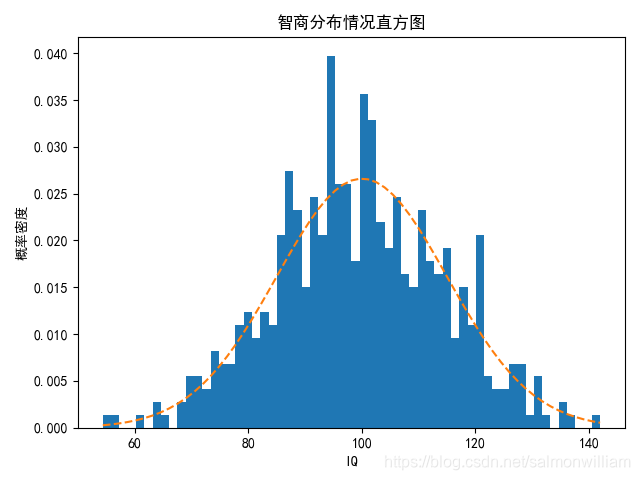
参考网址:https://www.twblogs.net/a/5d6a206abd9eee541c338fea/zh-cn
这篇关于module'matplotlib.mlab'has no attribute 'normpdf'的文章就介绍到这儿,希望我们推荐的文章对编程师们有所帮助!


