本文主要是介绍中国88个超500万人口的大中城市都在哪里?Python动态图告诉你!,希望对大家解决编程问题提供一定的参考价值,需要的开发者们随着小编来一起学习吧!
今日表情 ????

我国的城市层次
除港澳台外,中国一共有337个地级市(含4个直辖市)。一般综合考虑城市人口规模和城市经济发展水平等因素,可以将城市分成一线、新一线、二线、三线、四线、五线等不同层次。
下面我们来看一份第一财经新一线城市研究所发布的一份2021城市商业魅力排行榜城市层次榜单。

我国城市人口规模
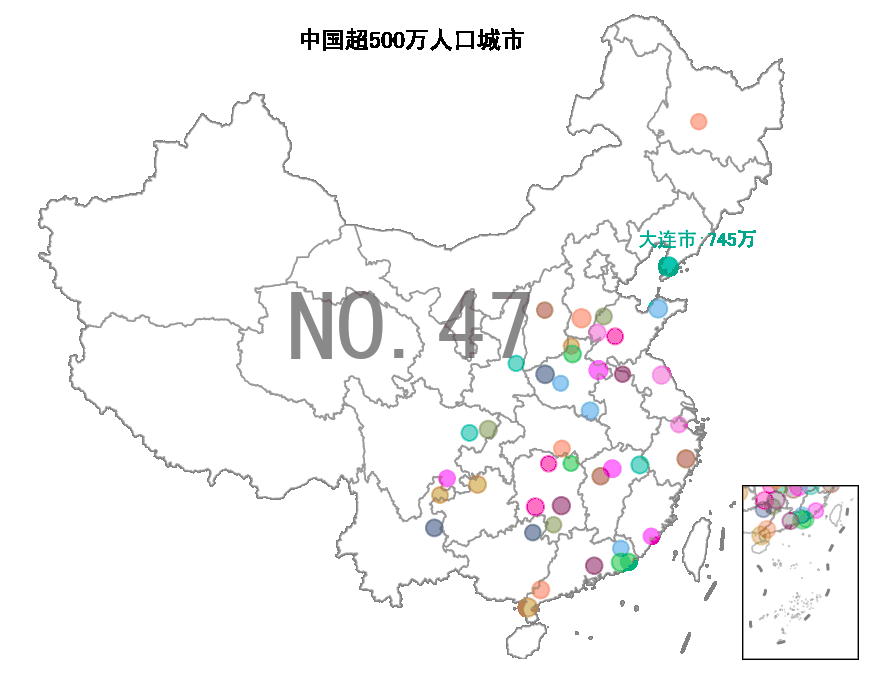
如果仅仅考虑城市人口规模的话,根据最新人口普查公开数据,中国337个地级市当中,一共有88个城市超过500万个。它们是哪些城市呢?我们用Python动态图盘点一下吧!
先上图片
再上视频
最后上代码
import numpy as np
import pandas as pd
import geopandas as gpd
import shapely
from shapely import geometry as geo
from shapely import wkt
import geopandas as gpd
import matplotlib.pyplot as plt
import matplotlib.animation as  animation
import contextily as ctximport imageio
import os
from PIL import Imageplt.rcParams['font.family'] = 'sans-serif'
plt.rcParams['font.sans-serif'] = ['SimHei']
plt.rcParams['axes.unicode_minus'] = False
plt.rcParams['animation.writer'] = 'html'
plt.rcParams['animation.embed_limit'] = 100def rgba_to_rgb(img_rgba):img_rgb = Image.new("RGB", img_rgba.size, (255, 255, 255))img_rgb.paste(img_rgba, mask=img_rgba.split()[3]) return img_rgb def html_to_gif(html_file, gif_file, duration=0.5):path = html_file.replace(".html","_frames")images = [os.path.join(path,x) for x in sorted(os.listdir(path))]frames = [imageio.imread(x) for x in images]if frames[0].shape[-1]==4:frames = [np.array(rgba_to_rgb(Image.fromarray(x))) for x in frames]imageio.mimsave(gif_file, frames, 'gif', duration=duration)return gif_filecmap = [
'#2E91E5',
'#1CA71C',
'#DA16FF',
'#B68100',
'#EB663B',
'#00A08B',
'#FC0080',
'#6C7C32',
'#862A16',
'#620042',
'#DA60CA',
'#0D2A63']*100def getCoords(geom):if isinstance(geom,geo.MultiPolygon):return [np.array(g.exterior) for g in geom.geoms]elif isinstance(geom,geo.Polygon):return [np.array(geom.exterior)]elif isinstance(geom,geo.LineString):return [np.array(geom)]elif isinstance(geom,geo.MultiLineString):return [np.array(x) for x in list(geom.geoms)]else:raise Exception("geom must be one of [polygon,MultiPolygon,LineString,MultiLineString]!")#底图数据
dfprovince = gpd.read_file("./data/dfprovince.geojson").set_crs("epsg:4326").to_crs("epsg:2343")
dfnanhai = gpd.read_file("./data/dfnanhai.geojson").set_crs("epsg:4326").to_crs("epsg:2343")
dfline9 =  dfnanhai[(dfnanhai["LENGTH"]>1.0)&(dfnanhai["LENGTH"]<2.0)]#散点数据
dfpoints = gpd.read_file("./data/china_big_cities.geojson").set_crs("epsg:4326").to_crs("epsg:2343")
dfpoints["point"] = dfpoints.representative_point()
dfpoints = dfpoints.query("population>=5000000") df = pd.DataFrame({"x":[pt.x for pt in dfpoints["point"]],"y": [pt.y for pt in dfpoints["point"]],"z":[x for x in dfpoints["population"]]})
df.index = [x for x in dfpoints["city"]] def bubble_map_dance(df,title = "中国超500万人口城市",filename = None,figsize = (8,6),dpi = 144,duration = 0.5,anotate_points = ["北京市","上海市","重庆市","赣州市","沈阳市"]):fig, ax_base =plt.subplots(figsize=figsize,dpi=dpi)ax_child=fig.add_axes([0.800,0.125,0.10,0.20])def plot_frame(i):ax_base.clear()ax_child.clear()#============================================================#绘制底图#============================================================#绘制省边界polygons = [getCoords(x) for x in dfprovince["geometry"]]for j,coords in enumerate(polygons):for x in coords:poly = plt.Polygon(x, fill=True, ec = "gray", fc = "white",alpha=0.5,linewidth=.8)poly_child = plt.Polygon(x, fill=True, ec = "gray", fc = "white",alpha=0.5,linewidth=.8)ax_base.add_patch(poly)ax_child.add_patch(poly_child )#绘制九段线coords = [getCoords(x) for x in dfline9["geometry"]]lines = [y for x in coords for y in x ]for ln in lines:x, y = np.transpose(ln)line = plt.Line2D(x,y,color="gray",linestyle="-.",linewidth=1.5)line_child = plt.Line2D(x,y,color="gray",linestyle="-.",linewidth=1.5)ax_base.add_artist(line)ax_child.add_artist(line_child)#设置spine格式for spine in['top','left',"bottom","right"]:ax_base.spines[spine].set_color("none")ax_child.spines[spine].set_alpha(0.5)ax_base.axis("off")#设置绘图范围bounds = dfprovince.total_boundsax_base.set_xlim(bounds[0]-(bounds[2]-bounds[0])/10, bounds[2]+(bounds[2]-bounds[0])/10)ax_base.set_ylim(bounds[1]+(bounds[3]-bounds[1])/3.5, bounds[3]+(bounds[3]-bounds[1])/100)ax_child.set_xlim(bounds[2]-(bounds[2]-bounds[0])/2.5, bounds[2]-(bounds[2]-bounds[0])/20)ax_child.set_ylim(bounds[1]-(bounds[3]-bounds[1])/20, bounds[1]+(bounds[3]-bounds[1])/2)#移除坐标轴刻度ax_child.set_xticks([]);ax_child.set_yticks([]);#============================================================#绘制散点#============================================================k = i//3+1m = i%3text = "NO."+str(len(df)+1-k) dfdata = df.iloc[:k,:].copy()dftmp = df.iloc[:k-1,:].copy()# 绘制散点图像if len(dftmp)>0:ax_base.scatter(dftmp["x"],dftmp["y"],s = 100*dftmp["z"]/df["z"].mean(),c = (cmap*100)[0:len(dftmp)],alpha = 0.3,zorder = 3)ax_child.scatter(dftmp["x"],dftmp["y"],s = 100*dftmp["z"]/df["z"].mean(),c = (cmap*100)[0:len(dftmp)],alpha = 0.3,zorder = 3)# 添加注释文字for i,p in enumerate(dftmp.index):px,py,pz = dftmp.loc[p,["x","y","z"]].tolist() if p in anotate_points:ax_base.annotate(p,xy = (px,py),  xycoords = "data",xytext = (-15,10),fontsize = 10,fontweight = "bold",color = cmap[i], textcoords = "offset points")# 添加标题和排名序号#ax_base.set_title(title,color = "black",fontsize = 12)ax_base.text(0.5, 0.95, title, va="center", ha="center", size = 12,transform = ax_base.transAxes)ax_base.text(0.5, 0.5, text, va="center", ha="center", alpha=0.3, size = 50,transform = ax_base.transAxes)# 添加注意力动画if m==0:px,py,pz = dfdata["x"][[-1]],dfdata["y"][[-1]],dfdata["z"][-1]p = dfdata.index[-1]+":"+str(pz//10000)+"万"ax_base.scatter(px,py,s = 800*pz/df["z"].mean(),c = cmap[len(dfdata)-1:len(dfdata)],alpha = 0.5,zorder = 4)ax_base.annotate(p,xy = (px,py),  xycoords = "data",xytext = (-15,10),fontsize = 20,fontweight = "bold",color = cmap[k-1], textcoords = "offset points",zorder = 5)if m==1:px,py,pz = dfdata["x"][[-1]],dfdata["y"][[-1]],dfdata["z"][-1]p = dfdata.index[-1]+":"+str(pz//10000)+"万"ax_base.scatter(px,py,s = 400*pz/df["z"].mean(),c = cmap[len(dfdata)-1:len(dfdata)],alpha = 0.5,zorder = 4)ax_base.annotate(p,xy = (px,py),  xycoords = "data",xytext = (-15,10),fontsize = 15,fontweight = "bold",color = cmap[k-1], textcoords = "offset points",zorder = 5)if m==2:px,py,pz = dfdata["x"][[-1]],dfdata["y"][[-1]],dfdata["z"][-1]p = dfdata.index[-1]+":"+str(pz//10000)+"万"ax_base.scatter(px,py,s = 100*pz/df["z"].mean(),c = cmap[len(dfdata)-1:len(dfdata)],alpha = 0.5,zorder = 4)ax_base.annotate(p,xy = (px,py),  xycoords = "data",xytext = (-15,10),fontsize = 10,fontweight = "bold",color = cmap[k-1], textcoords = "offset points",zorder = 5)my_animation = animation.FuncAnimation(fig,plot_frame,frames = range(0,3*len(df)),interval = int(duration*1000))if filename is None:try:from IPython.display import HTMLHTML(my_animation.to_jshtml())return HTML(my_animation.to_jshtml())except ImportError:passelse:my_animation.save(filename)return filenamehtml_file = "中国超500万人口城市.html"
bubble_map_dance(df,filename = html_file)gif_file = html_file.replace(".html",".gif")
html_to_gif(html_file,gif_file,duration=0.5)
收工。????

万水千山总是情,点个在看行不行?????
这篇关于中国88个超500万人口的大中城市都在哪里?Python动态图告诉你!的文章就介绍到这儿,希望我们推荐的文章对编程师们有所帮助!


