本文主要是介绍Python Pandas数据处理作图——波尔共振实验,希望对大家解决编程问题提供一定的参考价值,需要的开发者们随着小编来一起学习吧!

import matplotlib.pyplot as plt
import pandas as pd
from pylab import mplmpl.rcParams["font.sans-serif"] = ["SimHei"]data = {'频率比例w/wr': [1.036, 1.030, 1.025, 1.020, 1.012, 1.007, 1.002,0.997,0.993,0.990,0.986,0.977,0.969],'振幅测量值θ(度)': [51, 60, 68, 81, 107, 122, 132, 135, 127,115,103,76,61]}
df = pd.DataFrame(data)
df.set_index('频率比例w/wr', inplace=True)df.plot(kind='line', y='振幅测量值θ(度)', marker='o')plt.title('幅频特性曲线')
plt.xlabel('频率比例w/wr')
plt.ylabel('振幅测量值θ(度)')df_reset = df.reset_index()for i, txt in enumerate(df_reset['振幅测量值θ(度)']):plt.annotate(f'({df_reset["振幅测量值θ(度)"][i]}, {df_reset["频率比例w/wr"][i]:.3f})', (df_reset['频率比例w/wr'][i], df_reset['振幅测量值θ(度)'][i]), ha='center',va='bottom', textcoords='offset points', xytext=(0, 5))plt.show()
import matplotlib.pyplot as plt
import pandas as pd
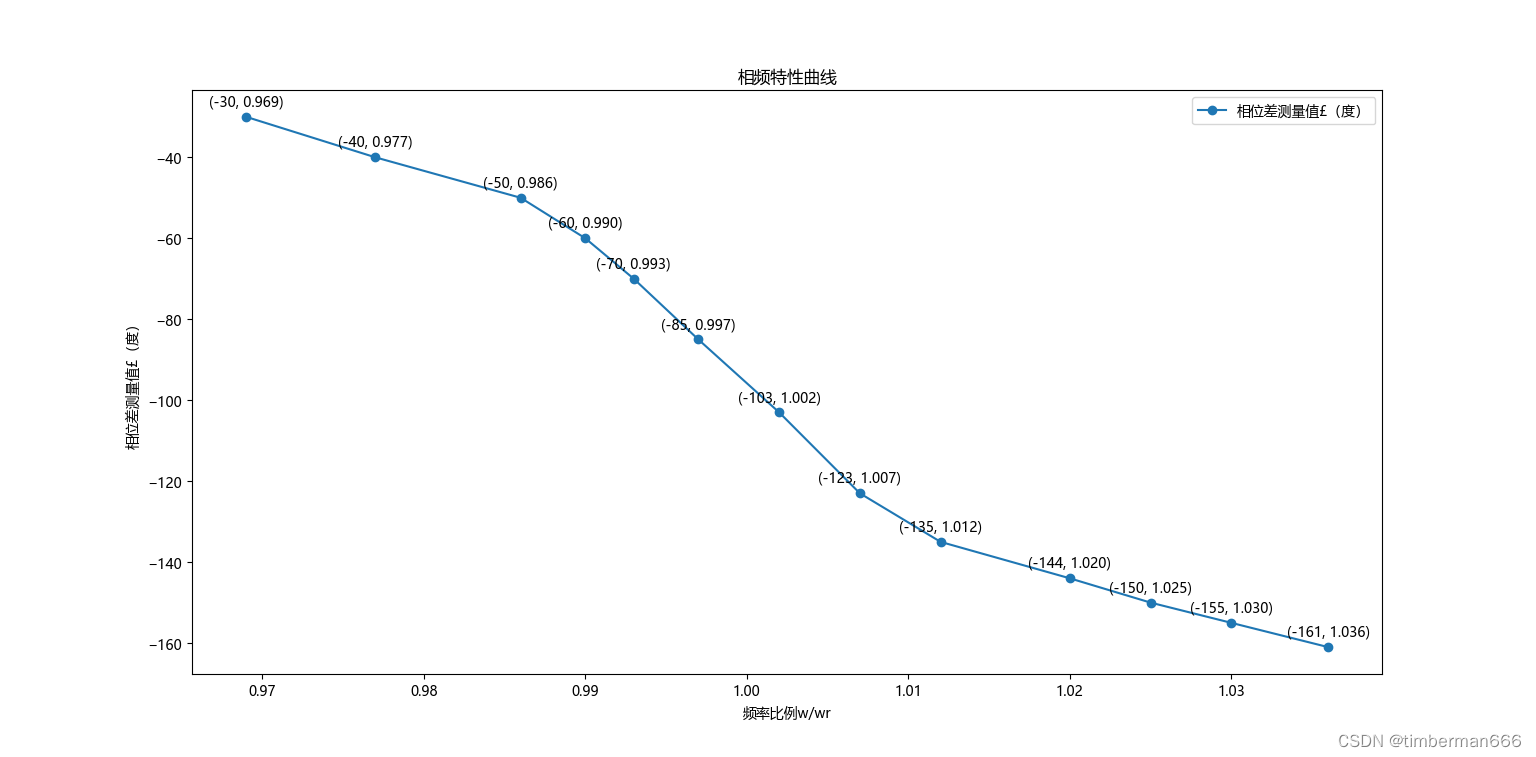
from pylab import mplmpl.rcParams["font.sans-serif"] = ["Microsoft YaHei"]data = {'频率比例w/wr': [1.036, 1.030, 1.025, 1.020, 1.012, 1.007, 1.002,0.997,0.993,0.990,0.986,0.977,0.969],'相位差测量值£(度)': [-161, -155,-150,-144,-135,-123,-103,-85,-70,-60,-50,-40,-30]}
df = pd.DataFrame(data)
df.set_index('频率比例w/wr', inplace=True)df.plot(kind='line', y='相位差测量值£(度)', marker='o')plt.title('相频特性曲线')
plt.xlabel('频率比例w/wr')
plt.ylabel('相位差测量值£(度)')df_reset = df.reset_index()for i, txt in enumerate(df_reset['相位差测量值£(度)']):plt.annotate(f'({df_reset["相位差测量值£(度)"][i]}, {df_reset["频率比例w/wr"][i]:.3f})', (df_reset['频率比例w/wr'][i], df_reset['相位差测量值£(度)'][i]), ha='center',va='bottom', textcoords='offset points', xytext=(0, 5))plt.show()
这篇关于Python Pandas数据处理作图——波尔共振实验的文章就介绍到这儿,希望我们推荐的文章对编程师们有所帮助!


