本文主要是介绍python:talib 计算 RSI,希望对大家解决编程问题提供一定的参考价值,需要的开发者们随着小编来一起学习吧!
RSI:相对强弱指标
talib_rsi.py
# -*- coding: utf-8 -*-
import os, sys
import tushare as ts
import pandas as pd
import matplotlib.pyplot as plt
import numpy as np
import talibif len(sys.argv) ==2:code = sys.argv[1]
else:print('usage: python talib_rsi.py stockcode ')sys.exit(1)if len(code) !=6:print('stock code length: 6')sys.exit(2)df = ts.get_k_data(code)
if df.empty ==True:print(" df is empty ")sys.exit(2)df = df[ df['date'] > '2020-01-01']
if len(df) <10:print(" len(df) <10 ")sys.exit(2)df['ma10'] = df['close'].rolling(window=10).mean()
df.index = pd.to_datetime(df.date)
dw = pd.DataFrame()
# RSI:相对强弱指标
dw['rsi6'] = talib.RSI(df.close, timeperiod=6)
dw['rsi14'] = talib.RSI(df.close, timeperiod=14)
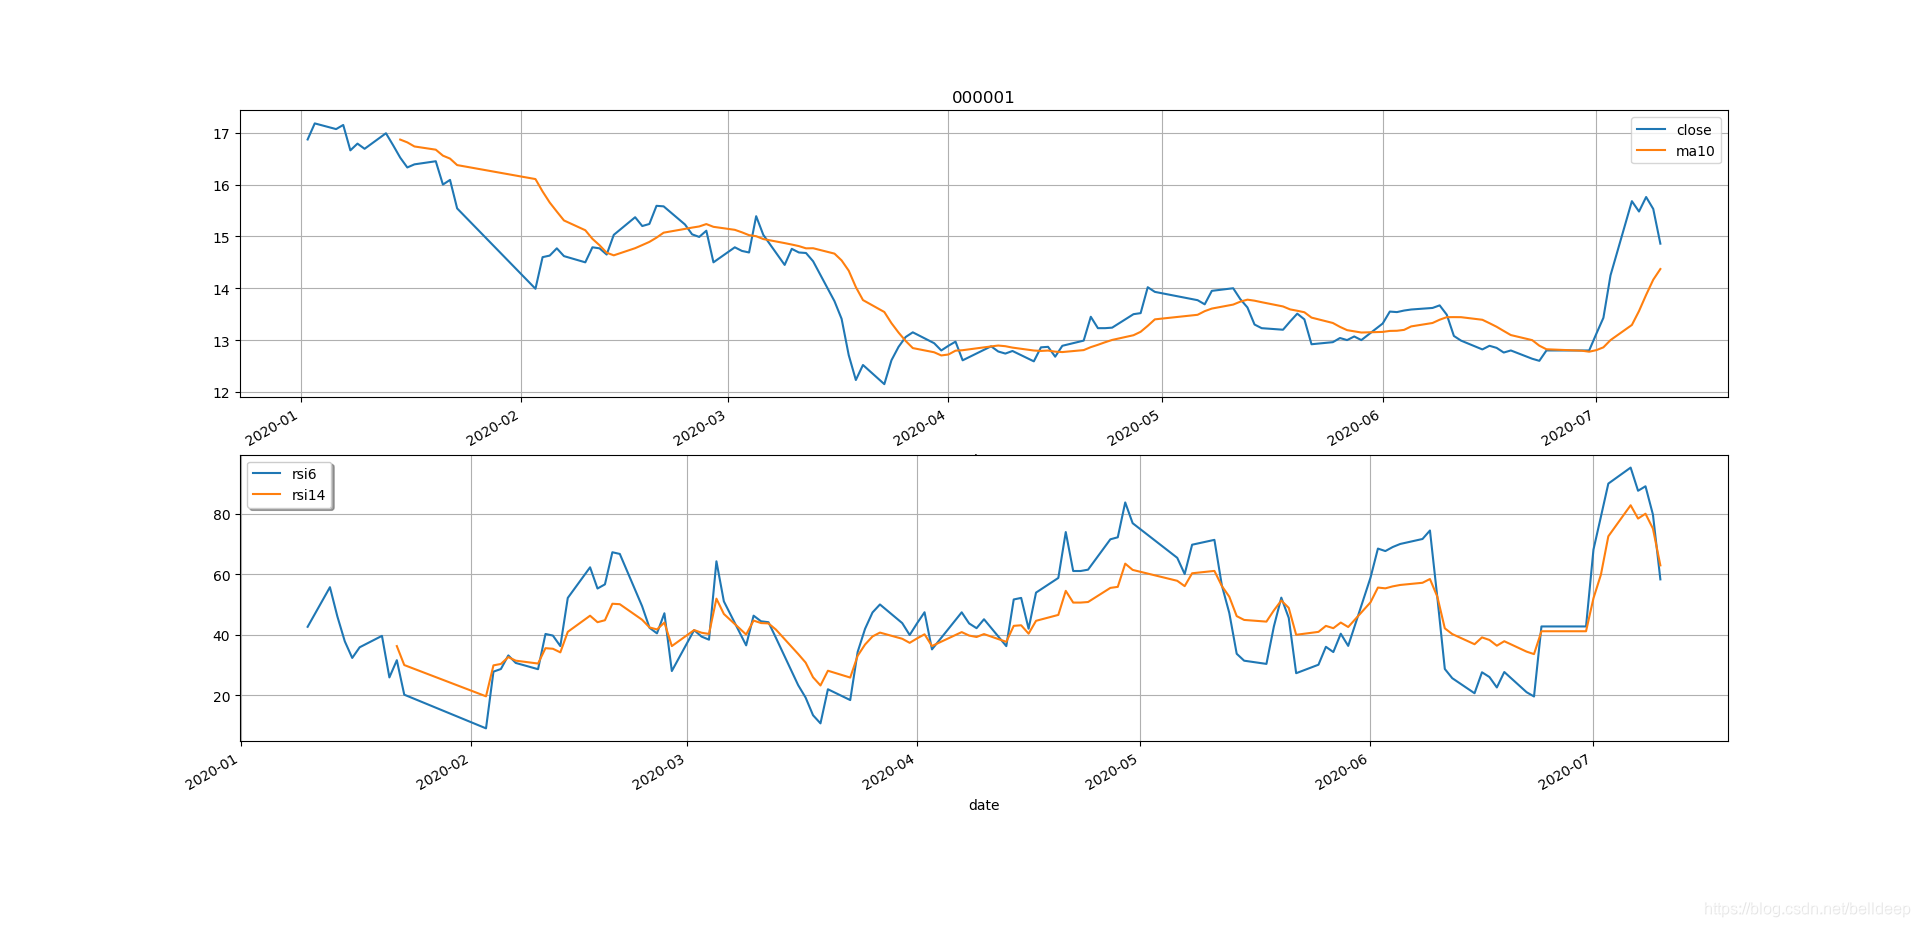
print("rsi6={0:.1f} , rsi14={1:.1f}".format(dw['rsi6'][-1], dw['rsi14'][-1]))# 画股票收盘价图
fig,axes = plt.subplots(2,1)
df[['close', 'ma10']].plot(ax=axes[0], grid=True, title=code)
# 画 RSI 曲线图
dw[['rsi6', 'rsi14']].plot(ax=axes[1], grid=True)
plt.legend(loc='best', shadow=True)
plt.show()
运行 python talib_rsi.py 000001
这篇关于python:talib 计算 RSI的文章就介绍到这儿,希望我们推荐的文章对编程师们有所帮助!


