本文主要是介绍[从头学数学] 第72节 平均数与条形统计图,希望对大家解决编程问题提供一定的参考价值,需要的开发者们随着小编来一起学习吧!
剧情提要:
[机器小伟]在[工程师阿伟]的陪同下进入练气期第八层功法的修炼,
这次要修炼的目标是[平均数与条形统计图]。

[机器小伟]在[工程师阿伟]的陪同下进入练气期第八层功法的修炼,
这次要修炼的目标是[平均数与条形统计图]。
正剧开始:
星历2016年02月04日 11:25:29, 银河系厄尔斯星球中华帝国江南行省。
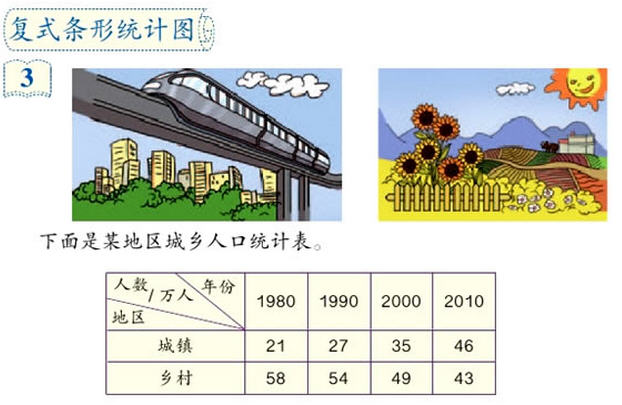
[工程师阿伟]正在和[机器小伟]一起研究复式统计表。

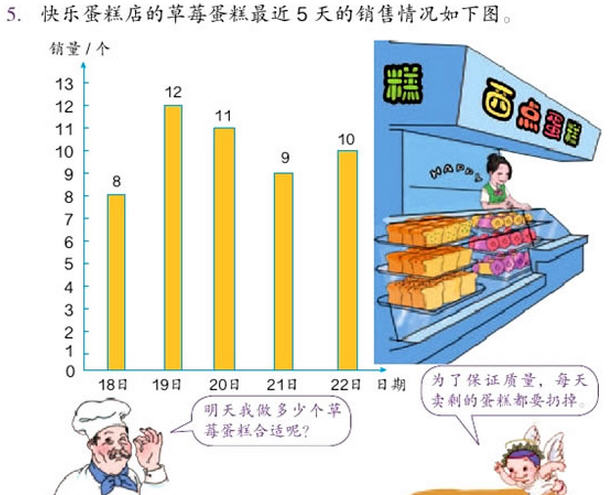
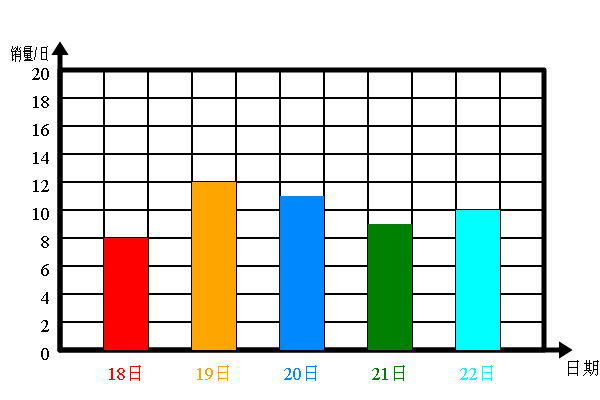
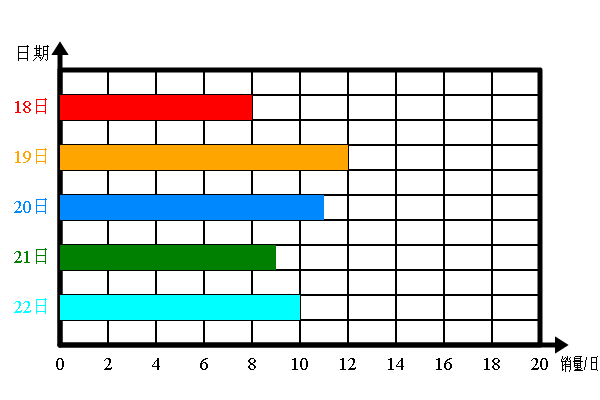
小伟现在手头已经有了可以绘制单式条形图的工具,但是还需要复习一下用法。
<span style="font-size:18px;">function myDraw() { var config = new PlotConfiguration();  config.init();  config.setPreference(); //config.setSector(1,1,1,1);//config.axis2D(0, 0, 180);var stat = new Statistic();var data = [8,12,11,9,10];var text = ['18日', '19日', '20日', '21日', '22日'];stat.init(data, '日期', '销量/日');var x = 0, y = 20;stat.histogram(text, x, y);
}</span>
还可以竖着画:
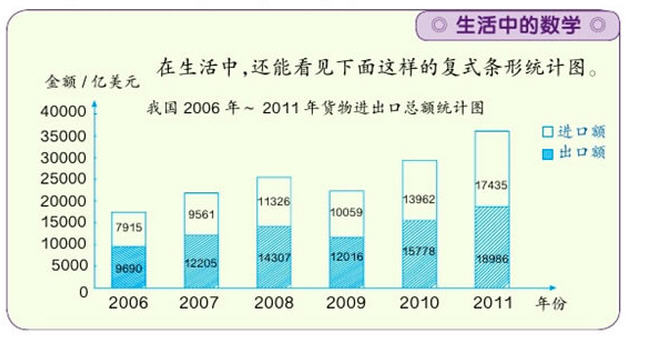
然后大Boss登场了:
小伟决定先看看[人叫板老师]怎样处理的。
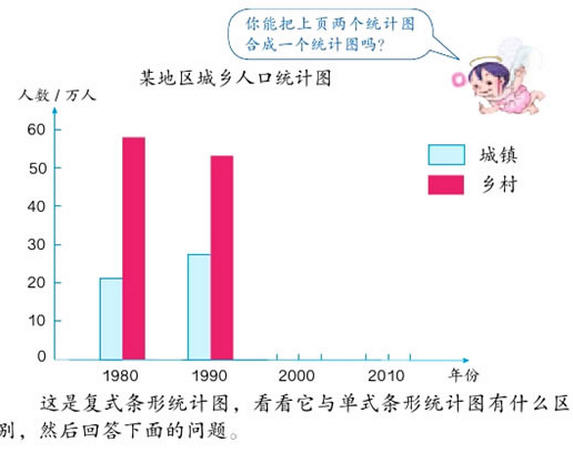
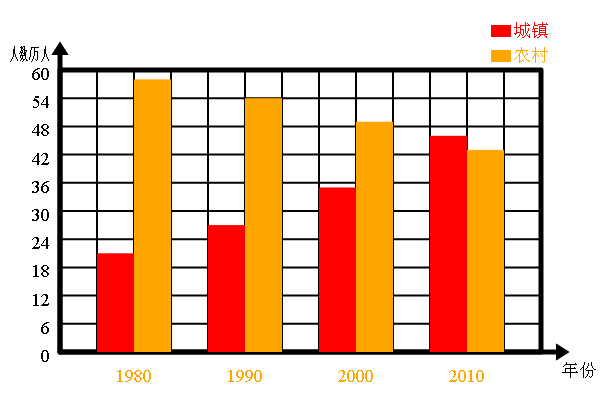
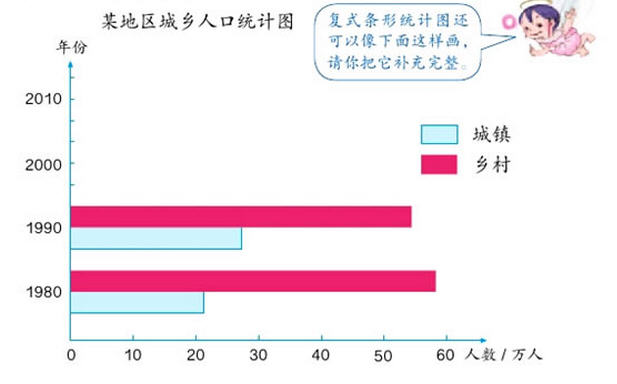
这样,复式条形图的初步方案就可以敲定了:
<span style="font-size:18px;">function myDraw() { var config = new PlotConfiguration();  config.init();  config.setPreference(); //config.setSector(1,1,1,1);//config.axis2D(0, 0, 180);var stat = new Statistic();var data = [[21,58],[27,54],[35,49],[46,43]];var text = ['1980', '1990', '2000', '2010'];var text2 = ['城镇', '农村'];stat.init(data, '年份', '人数/万人', 2);var x = 0, y = 20;stat.multiHistogram(text,text2, x, y);/*document.write(stat.max()+',');document.write(stat.min()+',');document.write(stat.mean()+',');*/
}//复式直方图this.multiHistogram = function(lableArray, lableArray2, xOffset, yOffset) {//lableArray是统计数据中横轴的描述//lableArray2是所统计的项目的描述lableArray = lableArray ? lableArray : [];var lables = lableArray.length;xOffset = xOffset ? xOffset : 0;yOffset = yOffset ? yOffset : 0;var colorArray = ['red', 'orange', '#0088FF', 'green', 'cyan', 'blue', '#FF00FF','#888888', 'black'];var colors = colorArray.length;var height = 380, width = 580;plot.save().translate(xOffset+60, yOffset+50);plot.setLineWidth(2).setTextAlign('right');var max = Math.ceil(this.max());  var min = Math.floor(this.min()); var mod = 1;while (max > mod * 10) {mod *= 10;}if (mod > 10) mod /= 10;//最大值的末位为0的近似数,比如最大值25,最合适的近似数为30var adjmax = Math.ceil(max/mod)*mod;if (adjmax == max) {adjmax+=mod;}adjmax /= mod;var size = this.size();  var perH = Math.round((height-100) / adjmax); var part = size*(this.multi+1)+1;var perW = Math.round((width-100) / part);//宽和高度边界var wBound = part*perW, hBound = adjmax*perH;plot.setLineWidth(5).strokeRect(0, 0, wBound, hBound);this.axis2D(0, hBound, wBound+20, hBound+20, this.xLabel, this.yLabel);plot.setLineWidth(2);var count = 0;for (var i = hBound; i >-1; i -= hBound / 10) {plot.fillText((adjmax*mod/10*count).toFixed(0), -10, i+10, 30);count++;if (i > 0) {plot.beginPath().moveTo(0, i).lineTo(wBound, i).closePath().stroke();}}for (var i = 0; i < part; i++) {plot.beginPath().moveTo(i*perW, 0).lineTo(i*perW, hBound).closePath().stroke();}var xpos, xpos2;for (var i = 0; i < size; i++) { for (var j = 0; j < this.multi; j++) {xpos = perW*((this.multi+1)*i+j+1);plot.setFillStyle(colorArray[j%colors]);  plot.fillRect(xpos, hBound, perW, -this.statisticalSample[i][j]/mod*perH); }xpos2 = perW*((this.multi+1)*i+1) + 0.5*this.multi*perW;plot.setTextAlign('center');if (i < lables) {plot.fillText(lableArray[i], xpos2, hBound+30, 100);  }//plot.fillText(this.statisticalSample[i].toFixed(0), xpos2, hBound+40, 100);  }  for (var j = 0; j < this.multi; j++) {plot.setFillStyle(colorArray[j%colors]);  plot.fillRect(wBound - 50, -20-25*(this.multi-j-1), 20, 12);plot.fillText(lableArray2[j], wBound-10, -20-25*(this.multi-j-1)+12, 50);}plot.restore();}</span>
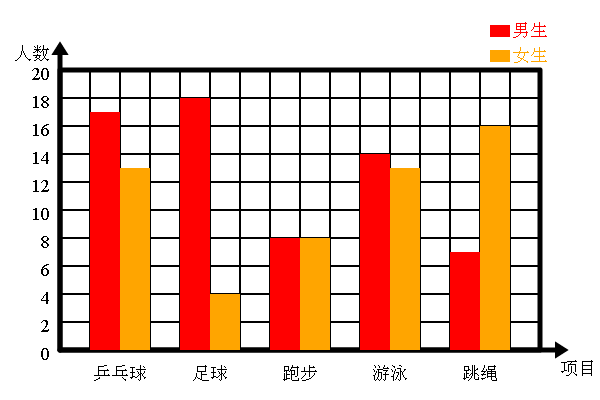
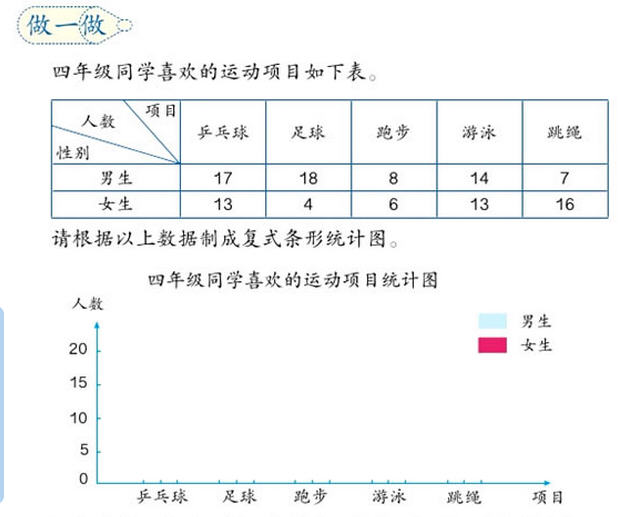
<span style="font-size:18px;">function myDraw() { var config = new PlotConfiguration();  config.init();  config.setPreference(); //config.setSector(1,1,1,1);//config.axis2D(0, 0, 180);var stat = new Statistic();var data = [[17,13],[18,4],[8,8],[14,13],[7,16]];var text = ['乒乓球', '足球', '跑步', '游泳', '跳绳'];var text2 = ['男生', '女生'];stat.init(data, '项目', '人数', 2);var x = 0, y = 20;stat.multiHistogram(text,text2, x, y);/*document.write(stat.max()+',');document.write(stat.min()+',');document.write(stat.mean()+',');*/
}</span>


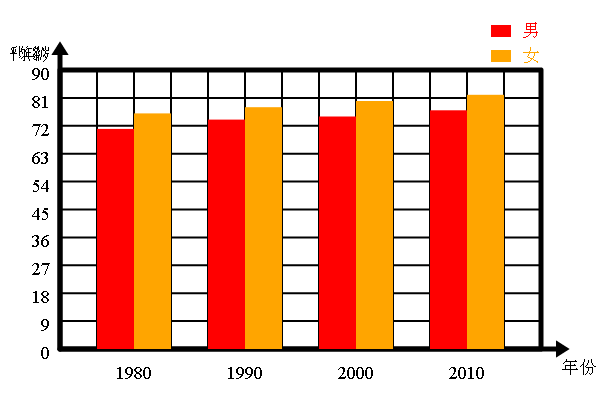
<span style="font-size:18px;">function myDraw() { var config = new PlotConfiguration();  config.init();  config.setPreference(); //config.setSector(1,1,1,1);//config.axis2D(0, 0, 180);var stat = new Statistic();var data = [[71,76],[74,78],[75,80],[77,82]];var text = ['1980','1990','2000', '2010'];var text2 = ['男', '女'];stat.init(data, '年份', '平均年龄/岁', 2);var x = 0, y = 20;stat.multiHistogram(text,text2, x, y);/*document.write(stat.max()+',');document.write(stat.min()+',');document.write(stat.mean()+',');*/
}</span>
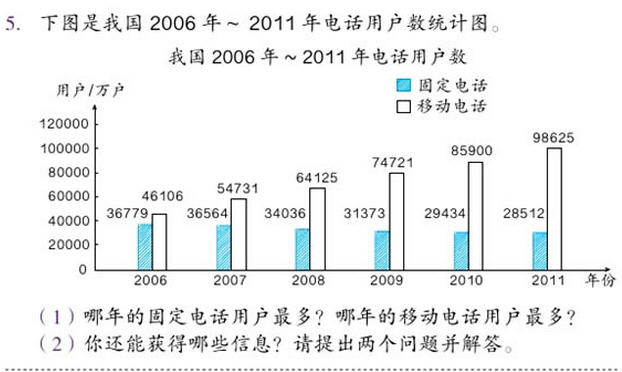
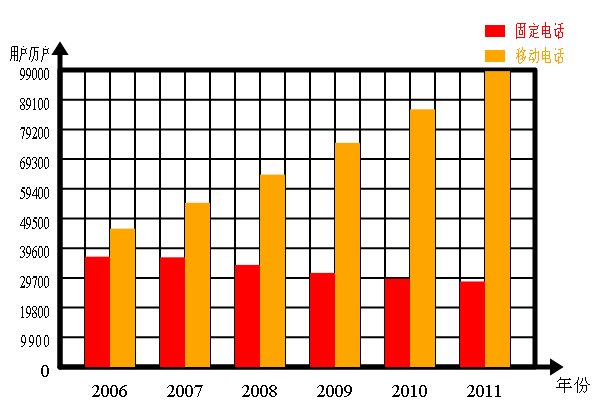
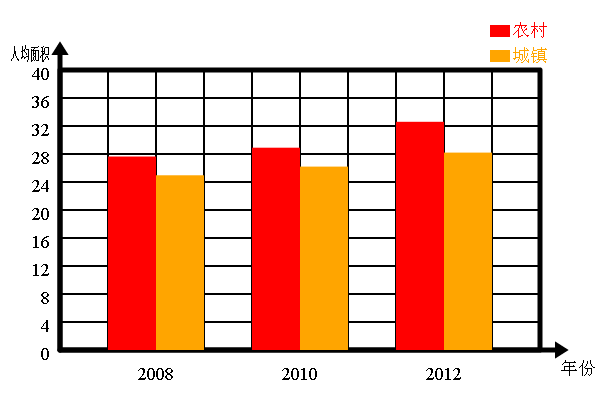
<span style="font-size:18px;">function myDraw() { var config = new PlotConfiguration();  config.init();  config.setPreference(); //config.setSector(1,1,1,1);//config.axis2D(0, 0, 180);var stat = new Statistic();var data = [[36779,46106],[36564,54731],[34036,64125],[31373,74721],[29434,85900],[28512,98625]];var text = ['2006','2007','2008', '2009', '2010', '2011'];var text2 = ['固定电话', '移动电话'];stat.init(data, '年份', '用户/万户', 2);var x = 0, y = 20;stat.multiHistogram(text,text2, x, y);/*document.write(stat.max()+',');document.write(stat.min()+',');document.write(stat.mean()+',');*/
}</span><span style="font-size:18px;">/**
* @usage 统计类
* @author mw
* @date 2016年01月05日 星期二 10:14:34
* @param
* @return
*
*/
function Statistic() {this.statisticalSample = new Array();this.sampleSize = 0;this.multi = 1;this.xLabel = '';this.yLabel = '';//初始化this.init = function(array, textX, textY, multi) {//multi为复式统计中每个数据的项数this.statisticalSample = array;this.sampleSize = this.statisticalSample.length;this.multi = multi ? Math.round(multi) : 1;this.xLabel = textX;this.yLabel = textY;}this.axis2D = function(x, y, rx, ry, textX, textY) {//原点是(x, y), rx, ry分别是x轴的长度,y轴的长度//textX, textY分别为x轴和y轴的标注plot.save();plot.setFillStyle('black').setStrokeStyle('black');plot.beginPath().moveTo(x,y).lineTo(x+rx,y).closePath().stroke();plot.beginPath().moveTo(x,y-ry).lineTo(x,y).closePath().stroke(); var r0 = 10;//x轴箭头plot.beginPath().moveTo(x+rx- r0*Math.cos(Math.PI/3), y-r0*Math.sin(Math.PI/3)).lineTo(x+rx+r0*Math.sin(Math.PI/3), y).lineTo(x+rx -r0*Math.cos(Math.PI/3), y+r0*Math.sin(Math.PI/3)).closePath().fill()plot.setTextAlign('left').fillText(textX, x+rx, y+25, 40);plot.setTextAlign('right').fillText(textY, x-10, y-ry+10, 40);//y轴箭头plot.beginPath().moveTo(x+ r0*Math.sin(Math.PI/3), y-ry+r0*Math.cos(Math.PI/3)).lineTo(x, y-ry-r0*Math.sin(Math.PI/3)).lineTo(x-r0*Math.sin(Math.PI/3), y-ry+r0*Math.cos(Math.PI/3)).closePath().fill()plot.restore();} //最大值this.max = function() {var max = Number.NEGATIVE_INFINITY;if (this.multi == 1) {for (var i = 0; i < this.sampleSize; i++) {if (max < this.statisticalSample[i]) {max = this.statisticalSample[i];}}}else {for (var i = 0; i < this.sampleSize; i++) {for (var j = 0; j < this.multi; j++) {if (max < this.statisticalSample[i][j]) {max = this.statisticalSample[i][j];}}}}return max;}//最小值this.min = function() {var min = Number.POSITIVE_INFINITY;if (this.multi == 1) {for (var i = 0; i < this.sampleSize; i++) {if (min > this.statisticalSample[i]) {min = this.statisticalSample[i];}}}else {for (var i = 0; i < this.sampleSize; i++) {for (var j = 0; j < this.multi; j++) {if (min > this.statisticalSample[i][j]) {min = this.statisticalSample[i][j];}}} }return min;}//总计this.total = function() {if (this.multi == 1) {var value = 0;for (var i = 0; i < this.sampleSize; i++) {value += this.statisticalSample[i];}return value;}else {var value = [];var tmp = 0;for (var j = 0; j < this.multi; j++) {tmp = 0;for (var i = 0; i < this.sampleSize; i++) {tmp += this.statisticalSample[i][j];}value.push(tmp);}return value;}}//平均数this.mean = function() {var value = this.total();if (this.sampleSize != 0) {for (var i = 0; i < value.length; i++) {value[i] /= this.sampleSize;}}return value;}//样本数量this.size = function() {return this.sampleSize;}//直方图this.histogram = function(lableArray, xOffset, yOffset) {lableArray = lableArray ? lableArray : [];var lables = lableArray.length;xOffset = xOffset ? xOffset : 0;yOffset = yOffset ? yOffset : 0;var colorArray = ['red', 'orange', '#0088FF', 'green', 'cyan', 'blue', '#FF00FF','#888888', 'black'];var colors = colorArray.length;var height = 380, width = 580;plot.save().translate(xOffset+60, yOffset+50);plot.setLineWidth(2).setTextAlign('right');var max = Math.ceil(this.max()); var min = Math.floor(this.min()); var mod = 1;while (max > mod * 10) {mod *= 10;}if (mod > 10) mod /= 10;//最大值的末位为0的近似数,比如最大值25,最合适的近似数为30var adjmax = Math.ceil(max/mod)*mod;if (adjmax == max) {adjmax+=mod;}adjmax /= mod;var size = this.size(); var perH = Math.round((height-100) / adjmax); var perW = Math.round((width-100) / (size*2+1));//宽和高度边界var wBound = (2*size+1)*perW, hBound = adjmax*perH;plot.setLineWidth(5).strokeRect(0, 0, wBound, hBound);this.axis2D(0, hBound, wBound+20, hBound+20, this.xLabel, this.yLabel);plot.setLineWidth(2);var count = 0;for (var i = hBound; i >-1; i -= hBound / 10) {plot.fillText((adjmax*mod/10*count).toFixed(0), -10, i+10, 30);count++;if (i > 0) {plot.beginPath().moveTo(0, i).lineTo(wBound, i).closePath().stroke();}}for (var i = 0; i < 2*size+1; i++) {plot.beginPath().moveTo(i*perW, 0).lineTo(i*perW, hBound).closePath().stroke();}var xpos, xpos2;for (var i = 0; i < size; i++) { xpos = perW*(1+2*i);xpos2 = xpos + 0.5*perW;plot.setFillStyle(colorArray[i%colors]); plot.fillRect(perW*(1+2*i), hBound, perW, -this.statisticalSample[i]/mod*perH); plot.setTextAlign('center');if (i < lables) {plot.fillText(lableArray[i], xpos2, hBound+30, 100); }//plot.fillText(this.statisticalSample[i].toFixed(0), xpos2, hBound+40, 100); } plot.restore();}//垂直方向直方图this.verticalhistogram = function(lableArray, xOffset, yOffset) {lableArray = lableArray ? lableArray : [];var lables = lableArray.length;xOffset = xOffset ? xOffset : 0;yOffset = yOffset ? yOffset : 0;var colorArray = ['red', 'orange', '#0088FF', 'green', 'cyan', 'blue', '#FF00FF','#888888', 'black'];var colors = colorArray.length;var height = 380, width = 580;plot.save().translate(xOffset+60, yOffset+50);var max = Math.ceil(this.max()); var min = Math.floor(this.min()); var mod = 1;while (max > mod * 10) {mod *= 10;}//最大值的末位为0的近似数,比如最大值25,最合适的近似数为30if (mod > 10) mod /= 10;var adjmax = Math.ceil(max/mod)*mod;if (adjmax == max) {adjmax+=mod;}adjmax /= mod;var size = this.size(); var perH = Math.round((height-100) / (size*2+1)); var perW = Math.round((width-100) / adjmax);//宽和高度边界var hBound = (2*size+1)*perH, wBound = adjmax*perW;plot.setLineWidth(5).strokeRect(0, 0, wBound, hBound);this.axis2D(0, hBound, wBound+20, hBound+20, this.xLabel, this.yLabel);plot.setLineWidth(2).setTextAlign('center');var count = 0;for (var i = 0; i < wBound+1; i += wBound / 10) {plot.fillText((adjmax*mod/10*count).toFixed(0), i, hBound+25, 30);count++;if (i > 0) {plot.beginPath().moveTo(i, 0).lineTo(i, hBound).closePath().stroke();}}for (var i = 0; i < 2*size+1; i++) {plot.beginPath().moveTo(0, i*perH).lineTo(wBound, i*perH).closePath().stroke();}var ypos, ypos2;for (var i = 0; i < size; i++) { ypos = perH*(1+2*i);ypos2 = ypos + 0.5*perH+5;plot.setFillStyle(colorArray[i%colors]); plot.fillRect(0, ypos, this.statisticalSample[i]/mod*perW, perH); plot.setTextAlign('right');if (i < lables) {plot.fillText(lableArray[i], -10, ypos2, 100); }} plot.restore();}//复式直方图this.multiHistogram = function(lableArray, lableArray2, xOffset, yOffset) {//lableArray是统计数据中横轴的描述//lableArray2是所统计的项目的描述lableArray = lableArray ? lableArray : [];var lables = lableArray.length;xOffset = xOffset ? xOffset : 0;yOffset = yOffset ? yOffset : 0;var colorArray = ['red', 'orange', '#0088FF', 'green', 'cyan', 'blue', '#FF00FF','#888888', 'black'];var colors = colorArray.length;var height = 380, width = 580;plot.save().translate(xOffset+60, yOffset+50);plot.setLineWidth(2).setTextAlign('right');var max = Math.ceil(this.max()); var min = Math.floor(this.min()); var mod = 1;while (max > mod * 10) {mod *= 10;}if (mod > 10) mod /= 10;//最大值的末位为0的近似数,比如最大值25,最合适的近似数为30var adjmax = Math.ceil(max/mod)*mod;if (adjmax == max) {adjmax+=mod;}adjmax /= mod;var size = this.size(); var perH = Math.round((height-100) / adjmax); var part = size*(this.multi+1)+1;var perW = Math.round((width-100) / part);//宽和高度边界var wBound = part*perW, hBound = adjmax*perH;plot.setLineWidth(5).strokeRect(0, 0, wBound, hBound);this.axis2D(0, hBound, wBound+20, hBound+20, this.xLabel, this.yLabel);plot.setLineWidth(2);var count = 0;for (var i = hBound; i >-1; i -= hBound / 10) {plot.fillText((adjmax*mod/10*count).toFixed(0), -10, i+10, 30);count++;if (i > 0) {plot.beginPath().moveTo(0, i).lineTo(wBound, i).closePath().stroke();}}for (var i = 0; i < part; i++) {plot.beginPath().moveTo(i*perW, 0).lineTo(i*perW, hBound).closePath().stroke();}var xpos, xpos2;for (var i = 0; i < size; i++) { for (var j = 0; j < this.multi; j++) {xpos = perW*((this.multi+1)*i+j+1);plot.setFillStyle(colorArray[j%colors]); plot.fillRect(xpos, hBound, perW, -this.statisticalSample[i][j]/mod*perH); }xpos2 = perW*((this.multi+1)*i+1) + 0.5*this.multi*perW;plot.setFillStyle('black');plot.setTextAlign('center');if (i < lables) {plot.fillText(lableArray[i], xpos2, hBound+30, 100); }//plot.fillText(this.statisticalSample[i].toFixed(0), xpos2, hBound+40, 100); } plot.setTextAlign('left');for (var j = 0; j < this.multi; j++) { plot.setFillStyle(colorArray[j%colors]); plot.fillRect(wBound - 50, -20-25*(this.multi-j-1), 20, 12);plot.fillText(lableArray2[j], wBound-20, -20-25*(this.multi-j-1)+12, 50);}plot.restore();}
}</span>本节到此结束,欲知后事如何,请看下回分解。
这篇关于[从头学数学] 第72节 平均数与条形统计图的文章就介绍到这儿,希望我们推荐的文章对编程师们有所帮助!