本文主要是介绍springboot集成prometheus监控,希望对大家解决编程问题提供一定的参考价值,需要的开发者们随着小编来一起学习吧!
1 Maven pom.xml引入依赖
<dependency><groupId>io.prometheus</groupId><artifactId>simpleclient_spring_boot</artifactId>
</dependency>
2 启动类引入注解
import io.prometheus.client.spring.boot.EnablePrometheusEndpoint;
import io.prometheus.client.spring.boot.EnableSpringBootMetricsCollector;
import org.springframework.boot.SpringApplication;
import org.springframework.boot.autoconfigure.SpringBootApplication;@SpringBootApplication
@EnablePrometheusEndpoint
@EnableSpringBootMetricsCollector
public class Application {public static void main(String[] args) {SpringApplication.run(Application.class, args);}
3 Controller类写需要监控的指标,比如Counter
import io.prometheus.client.Counter;
import org.springframework.web.bind.annotation.RequestMapping;
import org.springframework.web.bind.annotation.RestController;import java.util.Random;@RestController
public class SampleController {private static Random random = new Random();private static final Counter requestTotal = Counter.build().name("my_sample_counter").labelNames("status").help("A simple Counter to illustrate custom Counters in Spring Boot and Prometheus").register();@RequestMapping("/endpoint")public void endpoint() {if (random.nextInt(2) > 0) {requestTotal.labels("success").inc();} else {requestTotal.labels("error").inc();}}
}
4 设置springboot应用的服务名和端口,在application.properties
spring.application.name=mydemo
server.port=8888
5 配置prometheus.yml
global:scrape_interval:     15s # By default, scrape targets every 15 seconds.evaluation_interval: 15s # By default, scrape targets every 15 seconds.# scrape_timeout is set to the global default (10s).# Attach these labels to any time series or alerts when communicating with# external systems (federation, remote storage, Alertmanager).external_labels:monitor: 'codelab-monitor'# Load rules once and periodically evaluate them according to the global 'evaluation_interval'.
rule_files:# - "first.rules"# - "second.rules"# A scrape configuration containing exactly one endpoint to scrape:
# Here it's Prometheus itself.
scrape_configs:# The job name is added as a label `job=<job_name>` to any timeseries scraped from this config.- job_name: 'prometheus'# Override the global default and scrape targets from this job every 5 seconds.scrape_interval: 5s# metrics_path defaults to '/metrics'# scheme defaults to 'http'.static_configs:- targets: ['localhost:9090']- job_name: 'mydemo'# Override the global default and scrape targets from this job every 5 seconds.scrape_interval: 5smetrics_path: '/prometheus'# scheme defaults to 'http'.static_configs:- targets: ['10.94.20.52:8888']
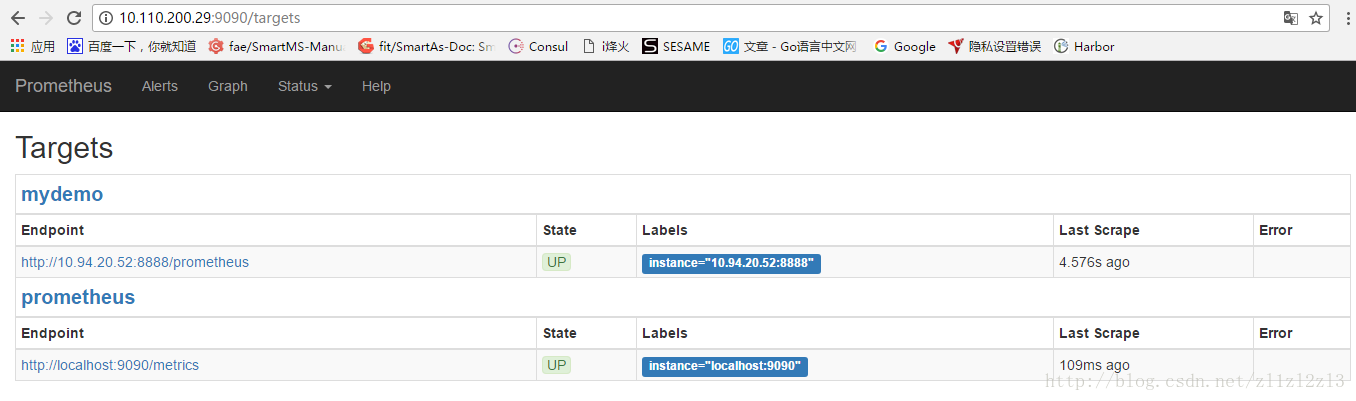
最关键的配置就是targets: [‘10.94.20.52:8888’],就是springboot应用的ip和端口
注:在application.xml里设置属性:spring.metrics.servo.enabled=false,去掉重复的metrics,不然在prometheus的控制台的targets页签里,会一直显示此endpoint为down状态。
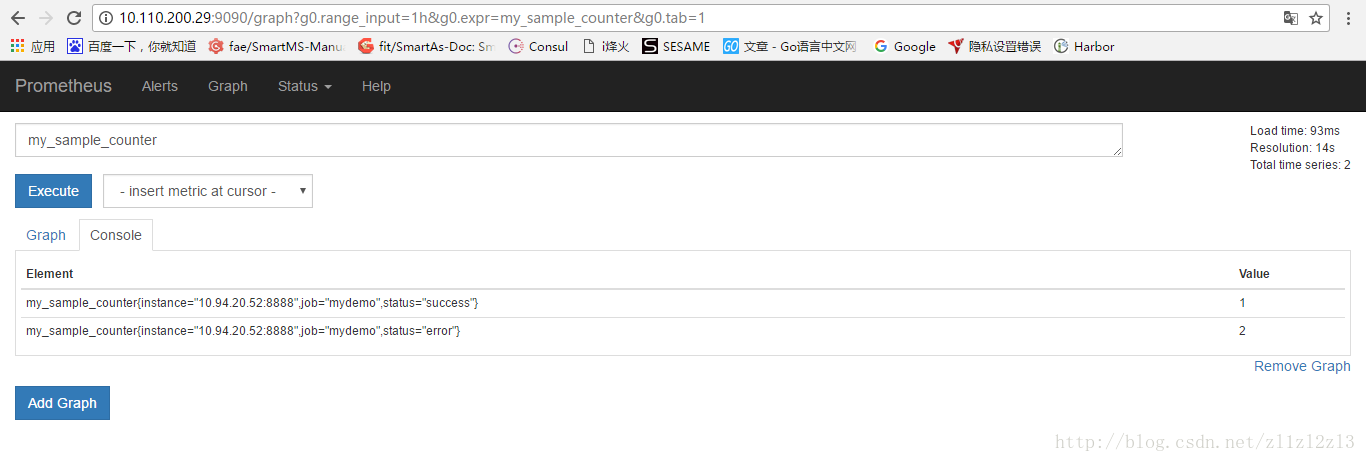
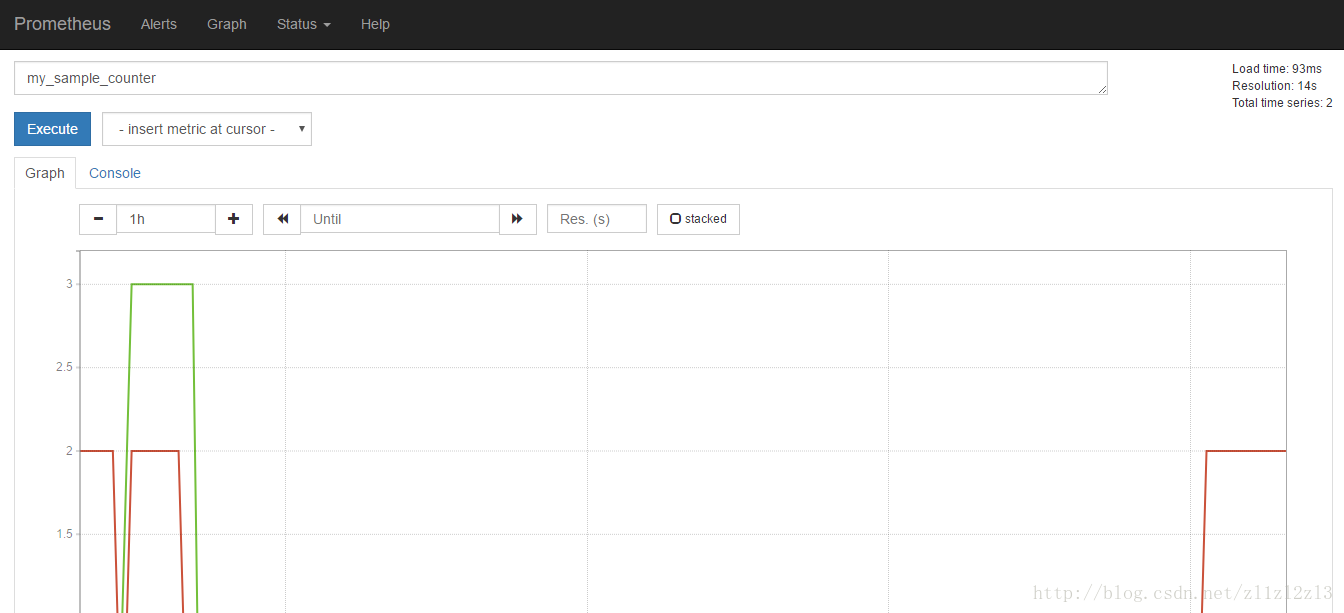
6 多次访问 http://localhost:8888/mydemo/endpoint,然后在prometheus控制台查看相关metrics信息,my_sample_counter,2个页签:Graph,Console
这篇关于springboot集成prometheus监控的文章就介绍到这儿,希望我们推荐的文章对编程师们有所帮助!