本文主要是介绍卡尔曼滤波源码注释和调用示例,希望对大家解决编程问题提供一定的参考价值,需要的开发者们随着小编来一起学习吧!
卡尔曼滤波源码注释和调用示例
flyfish
Python版本代码地址
C++版代码地址
主要用于分析代码,增加了中文注释
import numpy as np
import scipy.linalg"""
0.95分位数的卡方分布表,N自由度(包含N=1到9的值)。
取自MATLAB/Octave的chi2inv函数,用作Mahalanobis门限。
"""
chi2inv95 = {1: 3.8415,2: 5.9915,3: 7.8147,4: 9.4877,5: 11.070,6: 12.592,7: 14.067,8: 15.507,9: 16.919
}class KalmanFilter(object):"""一个用于图像空间中跟踪边界框的简单卡尔曼滤波器。8维状态空间x, y, a, h, vx, vy, va, vh包含边界框中心位置 (x, y)、长宽比 a、高度 h 及其相应的速度。对象运动遵循恒定速度模型。边界框位置 (x, y, a, h) 被作为状态空间的直接观测值(线性观测模型)。"""def __init__(self):ndim, dt = 4, 1.# 创建卡尔曼滤波器模型矩阵self._motion_mat = np.eye(2 * ndim, 2 * ndim)for i in range(ndim):self._motion_mat[i, ndim + i] = dtself._update_mat = np.eye(ndim, 2 * ndim)# 运动和观测不确定性相对于当前状态估计进行选择。这些权重控制模型中的不确定性量。这有点hacky。self._std_weight_position = 1. / 20self._std_weight_velocity = 1. / 160def initiate(self, measurement):"""从未关联的测量创建跟踪。参数----------measurement : ndarray边界框坐标 (x, y, a, h) 包含中心位置 (x, y)、长宽比 a 和高度 h。返回值-------(ndarray, ndarray)返回新跟踪的均值向量(8维)和协方差矩阵(8x8维)。"""mean_pos = measurementmean_vel = np.zeros_like(mean_pos)mean = np.r_[mean_pos, mean_vel]std = [2 * self._std_weight_position * measurement[3],2 * self._std_weight_position * measurement[3],1e-2,2 * self._std_weight_position * measurement[3],10 * self._std_weight_velocity * measurement[3],10 * self._std_weight_velocity * measurement[3],1e-5,10 * self._std_weight_velocity * measurement[3]]covariance = np.diag(np.square(std))return mean, covariancedef predict(self, mean, covariance):"""基于模型预测下一状态。参数----------mean : ndarray当前状态的均值向量(8维)。covariance : ndarray当前状态的协方差矩阵(8x8维)。返回值-------(ndarray, ndarray)返回预测的均值向量和协方差矩阵。"""std_pos = [self._std_weight_position * mean[3],self._std_weight_position * mean[3],1e-2,self._std_weight_position * mean[3]]std_vel = [self._std_weight_velocity * mean[3],self._std_weight_velocity * mean[3],1e-5,self._std_weight_velocity * mean[3]]motion_cov = np.diag(np.square(np.r_[std_pos, std_vel]))mean = np.dot(self._motion_mat, mean)covariance = np.linalg.multi_dot((self._motion_mat, covariance, self._motion_mat.T)) + motion_covreturn mean, covariancedef project(self, mean, covariance):"""将状态分布(均值和协方差)投影到观测空间。参数----------mean : ndarray状态分布的均值向量(8维)。covariance : ndarray状态分布的协方差矩阵(8x8维)。返回值-------(ndarray, ndarray)返回观测空间中的均值向量(4维)和协方差矩阵(4x4维)。"""std = [self._std_weight_position * mean[3],self._std_weight_position * mean[3],1e-1,self._std_weight_position * mean[3]]innovation_cov = np.diag(np.square(std))mean = np.dot(self._update_mat, mean)covariance = np.linalg.multi_dot((self._update_mat, covariance, self._update_mat.T))return mean, covariance + innovation_covdef update(self, mean, covariance, measurement):"""使用观测值更新状态分布。参数----------mean : ndarray先验状态分布的均值向量(8维)。covariance : ndarray先验状态分布的协方差矩阵(8x8维)。measurement : ndarray当前观测到的边界框坐标 (x, y, a, h)。返回值-------(ndarray, ndarray)更新后的状态分布的均值向量和协方差矩阵。"""projected_mean, projected_cov = self.project(mean, covariance)chol_factor, lower = scipy.linalg.cho_factor(projected_cov, lower=True, check_finite=False)kalman_gain = scipy.linalg.cho_solve((chol_factor, lower),np.dot(covariance, self._update_mat.T).T, check_finite=False).Tinnovation = measurement - projected_meannew_mean = mean + np.dot(innovation, kalman_gain.T)new_covariance = covariance - np.linalg.multi_dot((kalman_gain, projected_cov, kalman_gain.T))return new_mean, new_covariancedef gating_distance(self, mean, covariance, measurements, only_position=False):"""计算状态分布和观测值之间的门限距离。可从 `chi2inv95` 中获得合适的距离门限。如果 `only_position` 为 False,则卡方分布有4个自由度,否则为2个。参数----------mean : ndarray状态分布的均值向量(8维)。covariance : ndarray状态分布的协方差矩阵(8x8维)。measurements : ndarrayN×4维矩阵,包含N个观测值,每个观测值的格式为 (x, y, a, h),其中 (x, y) 为边界框中心位置,a 为长宽比,h 为高度。only_position : 可选[bool]如果为True,距离计算仅针对边界框中心位置。返回值-------ndarray返回长度为N的数组,其中第i个元素包含 (mean, covariance) 和 `measurements[i]` 之间的平方Mahalanobis距离。"""mean, covariance = self.project(mean, covariance)if only_position:mean, covariance = mean[:2], covariance[:2, :2]measurements = measurements[:, :2]cholesky_factor = np.linalg.cholesky(covariance)d = measurements - meanz = scipy.linalg.solve_triangular(cholesky_factor, d.T, lower=True, check_finite=False, overwrite_b=True)squared_maha = np.sum(z * z, axis=0)return squared_maha
调用示例1
import numpy as np
from kalman_filter_cn import KalmanFilterclass KalmanFilterTracker:def __init__(self, initial_measurement):self.kf = KalmanFilter()self.mean, self.covariance = self.kf.initiate(initial_measurement)self.history = [initial_measurement[:2]]  # 只记录位置 (x, y)def predict_and_update(self, measurement):self.mean, self.covariance = self.kf.predict(self.mean, self.covariance)self.mean, self.covariance = self.kf.update(self.mean, self.covariance, measurement)self.history.append(self.mean[:2])  # 只记录位置 (x, y)return self.mean, self.covariance# 示例用法
initial_measurement = np.array([0, 0, 1, 1])
tracker = KalmanFilterTracker(initial_measurement)measurements = [np.array([1, 1, 1, 1]),np.array([2, 2, 1, 1]),np.array([3, 3, 1, 1]),np.array([4, 4, 1, 1]),np.array([5, 5, 1, 1])
]for measurement in measurements:tracker.predict_and_update(measurement)print("History of positions:", tracker.history)
import matplotlib.pyplot as plt
from matplotlib.animation import FuncAnimationdef animate_kalman_filter(history):fig, ax = plt.subplots()ax.set_xlim(0, 6)ax.set_ylim(0, 6)line, = ax.plot([], [], 'bo-', label='Kalman Filter')true_line, = ax.plot([], [], 'ro--', label='True Path')def init():line.set_data([], [])true_line.set_data([], [])return line, true_linedef update(frame):x_data = [h[0] for h in history[:frame+1]]y_data = [h[1] for h in history[:frame+1]]line.set_data(x_data, y_data)true_x = [i for i in range(len(history))]true_y = [i for i in range(len(history))]true_line.set_data(true_x, true_y)return line, true_lineani = FuncAnimation(fig, update, frames=len(history), init_func=init, blit=True, repeat=True)ani.save('kalman_filter.gif', writer='imagemagick')plt.legend()plt.show()animate_kalman_filter(tracker.history)

调用示例2
import numpy as np
import matplotlib.pyplot as plt
from matplotlib.animation import FuncAnimation
from kalman_filter_cn import KalmanFilter
from typing import Tupleclass KalmanFilterTracker:def __init__(self, initial_measurement: np.ndarray) -> None:self.kf = KalmanFilter()self.mean, self.covariance = self.kf.initiate(initial_measurement)self.history = [initial_measurement[:2]]  # 只记录位置 (x, y)def predict_and_update(self, measurement: np.ndarray) -> Tuple[np.ndarray, np.ndarray]:self.mean, self.covariance = self.kf.predict(self.mean, self.covariance)self.mean, self.covariance = self.kf.update(self.mean, self.covariance, measurement)self.history.append(self.mean[:2])  # 只记录位置 (x, y)return self.mean, self.covarianceclass KalmanFilterAnimation:def __init__(self, tracker: KalmanFilterTracker, measurements: np.ndarray) -> None:self.tracker = trackerself.measurements = measurementsdef init(self):self.line.set_data([], [])self.true_line.set_data([], [])return self.line, self.true_linedef update(self, frame):x_data = [h[0] for h in self.tracker.history[:frame+1]]y_data = [h[1] for h in self.tracker.history[:frame+1]]self.line.set_data(x_data, y_data)true_x = [m[0] for m in self.measurements[:frame+1]]true_y = [m[1] for m in self.measurements[:frame+1]]self.true_line.set_data(true_x, true_y)return self.line, self.true_linedef animate(self) -> None:fig, ax = plt.subplots()ax.set_xlim(0, 10)ax.set_ylim(-1.5, 1.5)self.line, = ax.plot([], [], 'bo-', label='Kalman Filter')self.true_line, = ax.plot([], [], 'ro--', label='True Path')ani = FuncAnimation(fig, self.update, frames=len(self.tracker.history),init_func=self.init, blit=True, repeat=True)ani.save('kalman_filter_curve.gif', writer='imagemagick')plt.legend()plt.show()# 初始化卡尔曼滤波器
initial_measurement = np.array([0, 0, 1, 1])
tracker = KalmanFilterTracker(initial_measurement)# 生成测量值,形成曲线轨迹(正弦波)
measurements = []
for t in np.linspace(0, 10, 100):x = ty = np.sin(t)measurements.append(np.array([x, y, 1, 1]))# 更新卡尔曼滤波器
for measurement in measurements:tracker.predict_and_update(measurement)# 创建动画并生成GIF
animation = KalmanFilterAnimation(tracker, measurements)
animation.animate()
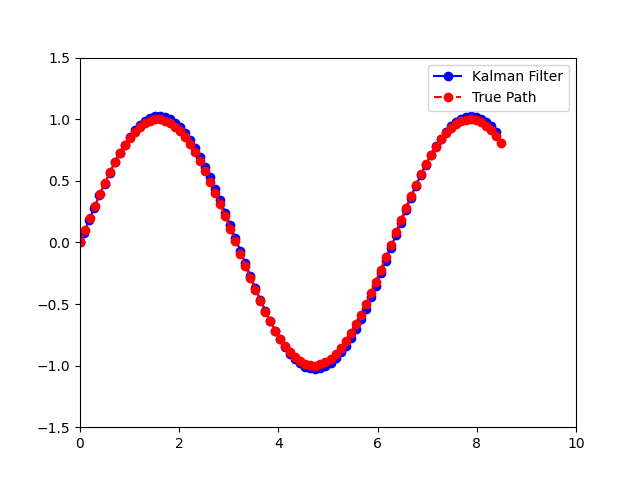
如果要分析滤波器性能、调试滤波器以及可视化滤波器是非常有用的,那么可以这样做
class KalmanFilterTracker:def __init__(self, initial_measurement: np.ndarray) -> None:self.kf = KalmanFilter()self.mean, self.covariance = self.kf.initiate(initial_measurement)self.history = [initial_measurement[:2]] # 只记录位置 (x, y)self.states = [self.mean] # 存储历史状态均值self.covariances = [self.covariance] # 存储历史协方差矩阵def predict_and_update(self, measurement: np.ndarray) -> Tuple[np.ndarray, np.ndarray]:self.mean, self.covariance = self.kf.predict(self.mean, self.covariance)self.mean, self.covariance = self.kf.update(self.mean, self.covariance, measurement)self.history.append(self.mean[:2]) # 只记录位置 (x, y)self.states.append(self.mean) # 存储历史状态均值self.covariances.append(self.covariance) # 存储历史协方差矩阵return self.mean, self.covariance
记录历史值可以分析滤波器的性能,查找和修正可能的问题。对于可视化和演示目的,存储历史值可以让绘制出估计轨迹和实际轨迹,以便直观地比较和展示滤波效果。
如果只是单纯的用,在递归估计中,只需保持前一时刻的状态即可
class KalmanFilterTracker:def __init__(self, initial_measurement: np.ndarray) -> None:self.kf = KalmanFilter()self.mean, self.covariance = self.kf.initiate(initial_measurement)def predict_and_update(self, measurement: np.ndarray) -> Tuple[np.ndarray, np.ndarray]:self.mean, self.covariance = self.kf.predict(self.mean, self.covariance)self.mean, self.covariance = self.kf.update(self.mean, self.covariance, measurement)return self.mean, self.covariance
这篇关于卡尔曼滤波源码注释和调用示例的文章就介绍到这儿,希望我们推荐的文章对编程师们有所帮助!


