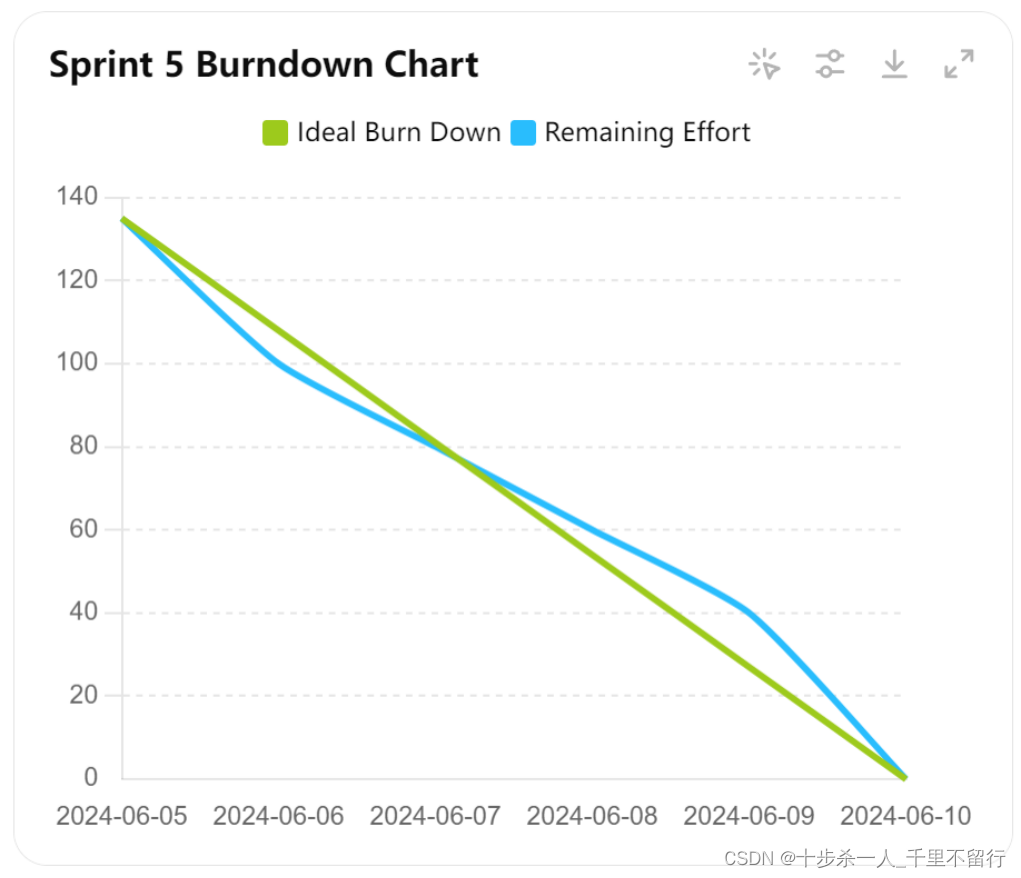
本文主要是介绍用ChatGPT 4o画漂亮的燃尽图代码,希望对大家解决编程问题提供一定的参考价值,需要的开发者们随着小编来一起学习吧!
把代码给ChatGPT,然后他就会帮我生成出来了。
而且图是动态的,可以调整颜色文字之类的内容

# Given data for Sprint 5 Progress
data_sprint_5 = {'User Story': ['BEAN-40', 'BEAN-42', 'BEAN-41', 'BEAN-22', 'BEAN-33', 'BEAN-44', 'BEAN-10', 'BEAN-26', 'BEAN-37', 'BEAN-36', 'BEAN-14', 'BEAN-39', 'BEAN-17', 'BEAN-38', 'BEAN-29', 'BEAN-9'],'Task': ['Build Test Framework Base on Python','Final Report','Summary Reports','As a staff member, I want to be able to send and receive messages so that I can communicate effectively with the customers and the managers','As a manager, I want to be able to send and receive messages so that I can communicate effectively with the customers and the managers','Design Test Cases','As a customer, I want to provide feedback on menu items so that I can contribute to improving the menu and share my experiences with the business','As a manager, I want to manage a points-based rewards system so that I can engage customers and drive sales','Should display the estimated preparation time, When selecting the option for immediate pickup','Add multiple quantities of the same item from the product page!','As a customer, I want to be able to send and receive messages so that I can communicate effectively with the staff members','Design Test Framework and Strategy','As a customer, I want to view and manage my points-based rewards section so that I can manage my points','Error info when click booking button','As a manager, I want to view management reports to gain insights into customer behaviour and preferences so that I can take informed business decisions','As a customer, I want to view my past orders so that I can easily reorder favourite items and track my purchase history'],'Developer': ['Cedar', 'Cedar', 'Cedar', 'Luke, Arjun', 'Luke, Arjun', 'Luke, Arjun', 'Luke, Arjun', 'Luke, Arjun', 'Luke, Arjun', 'Luke, Arjun', 'Luke, Arjun', 'Luke, Arjun', 'Luke, Arjun', 'Luke, Arjun', 'Luke, Arjun', 'Luke, Arjun'],'Estimated Hours': [10, 10, 10, 11, 9, 9, 12, 9, 12, 10, 5, 5, 5, 5, 5, 5]
}# Create a DataFrame from the given data
sprint_5_df = pd.DataFrame(data_sprint_5)# Dates for the sprint
dates_sprint_5 = pd.date_range(start="2024-06-05", end="2024-06-10")# Initialize remaining hours with total estimated hours at the start of the sprint
total_hours_sprint_5 = sprint_5_df['Estimated Hours'].sum()
remaining_hours_sprint_5 = total_hours_sprint_5
actual_burndown_sprint_5 = [remaining_hours_sprint_5]# Update remaining hours only when a task is completed
for i, row in sprint_5_df.iterrows():# For this example, assume all tasks are completedremaining_hours_sprint_5 -= row['Estimated Hours']actual_burndown_sprint_5.append(remaining_hours_sprint_5)# Extend the actual burndown to match the length of the dates if needed
while len(actual_burndown_sprint_5) < len(dates_sprint_5) + 1:actual_burndown_sprint_5.append(remaining_hours_sprint_5)# Ideal burndown calculation
ideal_burndown_sprint_5 = [total_hours_sprint_5 - (total_hours_sprint_5 / len(dates_sprint_5)) * i for i in range(len(dates_sprint_5))]# Ensure the lengths are the same for plotting
if len(actual_burndown_sprint_5) > len(dates_sprint_5) + 1:actual_burndown_sprint_5 = actual_burndown_sprint_5[:len(dates_sprint_5) + 1]# Plotting the Burndown Chart
plt.figure(figsize=(10, 6))
plt.plot(dates_sprint_5, ideal_burndown_sprint_5, label='Ideal Burn Down', linestyle='--')
plt.plot(dates_sprint_5.insert(0, dates_sprint_5[0] - pd.Timedelta(days=1)), actual_burndown_sprint_5, label='Remaining Effort', marker='o')
plt.xlabel('Date')
plt.ylabel('Hours Remaining')
plt.title('Sprint 5 Burndown Chart')
plt.legend()
plt.grid(True)
plt.xticks(dates_sprint_5, rotation=45)
plt.yticks(range(0, total_hours_sprint_5 + 1, 5))
plt.tight_layout()plt.show()
调整后的图

这篇关于用ChatGPT 4o画漂亮的燃尽图代码的文章就介绍到这儿,希望我们推荐的文章对编程师们有所帮助!


