本文主要是介绍matlab使用教程(95)—显示地理数据,希望对大家解决编程问题提供一定的参考价值,需要的开发者们随着小编来一起学习吧!
下面的示例说明了多种表示地球地貌的方法。此示例中的数据取自美国商务部海洋及大气管理局 (NOAA) 国家地理数据中心,数据通告编号为 88-MGG-02。
1.关于地貌数据
数据文件 topo.mat 包含地貌数据。topo 是海拔数据,topomap1 是海拔的颜色图。
load topo topo topomap1    % load data
whos('topo','topomap1')
Name Size Bytes Class Attributestopo 180x360 518400 double topomap1 64x3 1536 double
2.创建等高线图
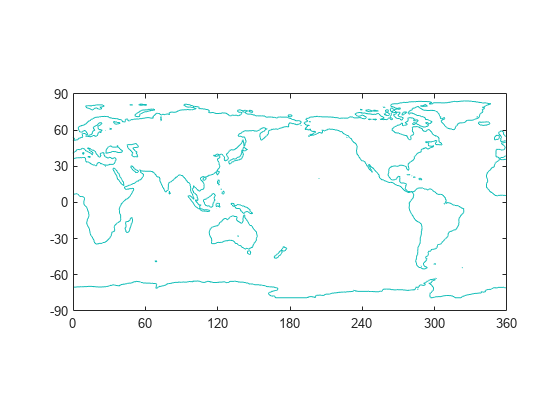
以可视化形式呈现地貌数据的一种方法是创建等高线图。若要显示地球上各大洲的轮廓,请绘制海拔为零的点。contour 中的前三个输入参量指定等高线图上的 X、Y 和 Z 值。第四个参量指定要绘制的等高线层级。
x = 0:359;                                % longitude
y = -89:90;                               % latitudefigure
contour(x,y,topo,[0 0])axis equal                                % set axis units to be the same size
box on                                    % display bounding boxax = gca;                                 % get current axis
ax.XLim = [0 360];                        % set x limits
ax.YLim = [-90 90];                       % set y limits
ax.XTick = [0 60 120 180 240 300 360];    % define x ticks
ax.YTick = [-90 -60 -30 0 30 60 90];      % define y ticks
3.以图像形式查看数据
您可以使用高程数据和自定义颜色图创建地貌图像。地貌数据被视为自定义颜色图的索引。将图像的 CDataMapping 设置为 'scaled' 以将数据值线性缩放至颜色图的范围。在颜色图上,不同深浅的绿色表示海拔数据,不同深浅的蓝色表示海平面下的深度。
image([0 360],[-90 90], flip(topo), 'CDataMapping', 'scaled')
colormap(topomap1)axis equal                                % set axis units to be the same sizeax = gca;                                 % get current axis
ax.XLim = [0 360];                        % set x limits
ax.YLim = [-90 90];                       % set y limits
ax.XTick = [0 60 120 180 240 300 360];    % define x ticks
ax.YTick = [-90 -60 -30 0 30 60 90];      % define y ticks
4.使用纹理映射
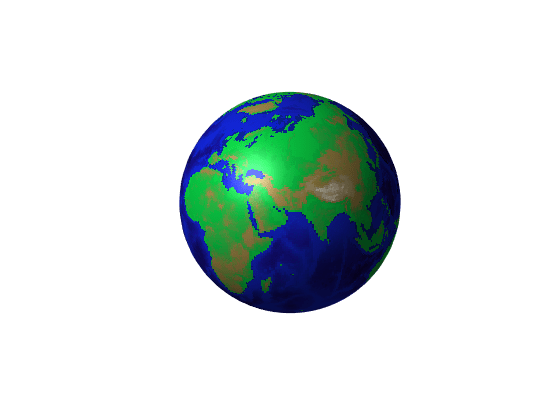
纹理映射将二维图像映射到三维曲面上。若要将地貌映射到球形曲面,请将由 CData 属性指定的曲面颜色设置为地貌数据并将 FaceColor 属性设置为 'texturemap'。
clf
[x,y,z] = sphere(50);          % create a sphere
s = surface(x,y,z);            % plot spherical surfaces.FaceColor = 'texturemap';    % use texture mapping
s.CData = topo;                % set color data to topographic data
s.EdgeColor = 'none';          % remove edges
s.FaceLighting = 'gouraud';    % preferred lighting for curved surfaces
s.SpecularStrength = 0.4;      % change the strength of the reflected lightlight('Position',[-1 0 1])     % add a lightaxis square off                % set axis to square and remove axis
view([-30,30])                 % set the viewing angle
这篇关于matlab使用教程(95)—显示地理数据的文章就介绍到这儿,希望我们推荐的文章对编程师们有所帮助!


