本文主要是介绍vue echarts 柱状图 堆叠柱状图,希望对大家解决编程问题提供一定的参考价值,需要的开发者们随着小编来一起学习吧!
echarts堆叠柱状图(效果图在文章末尾)
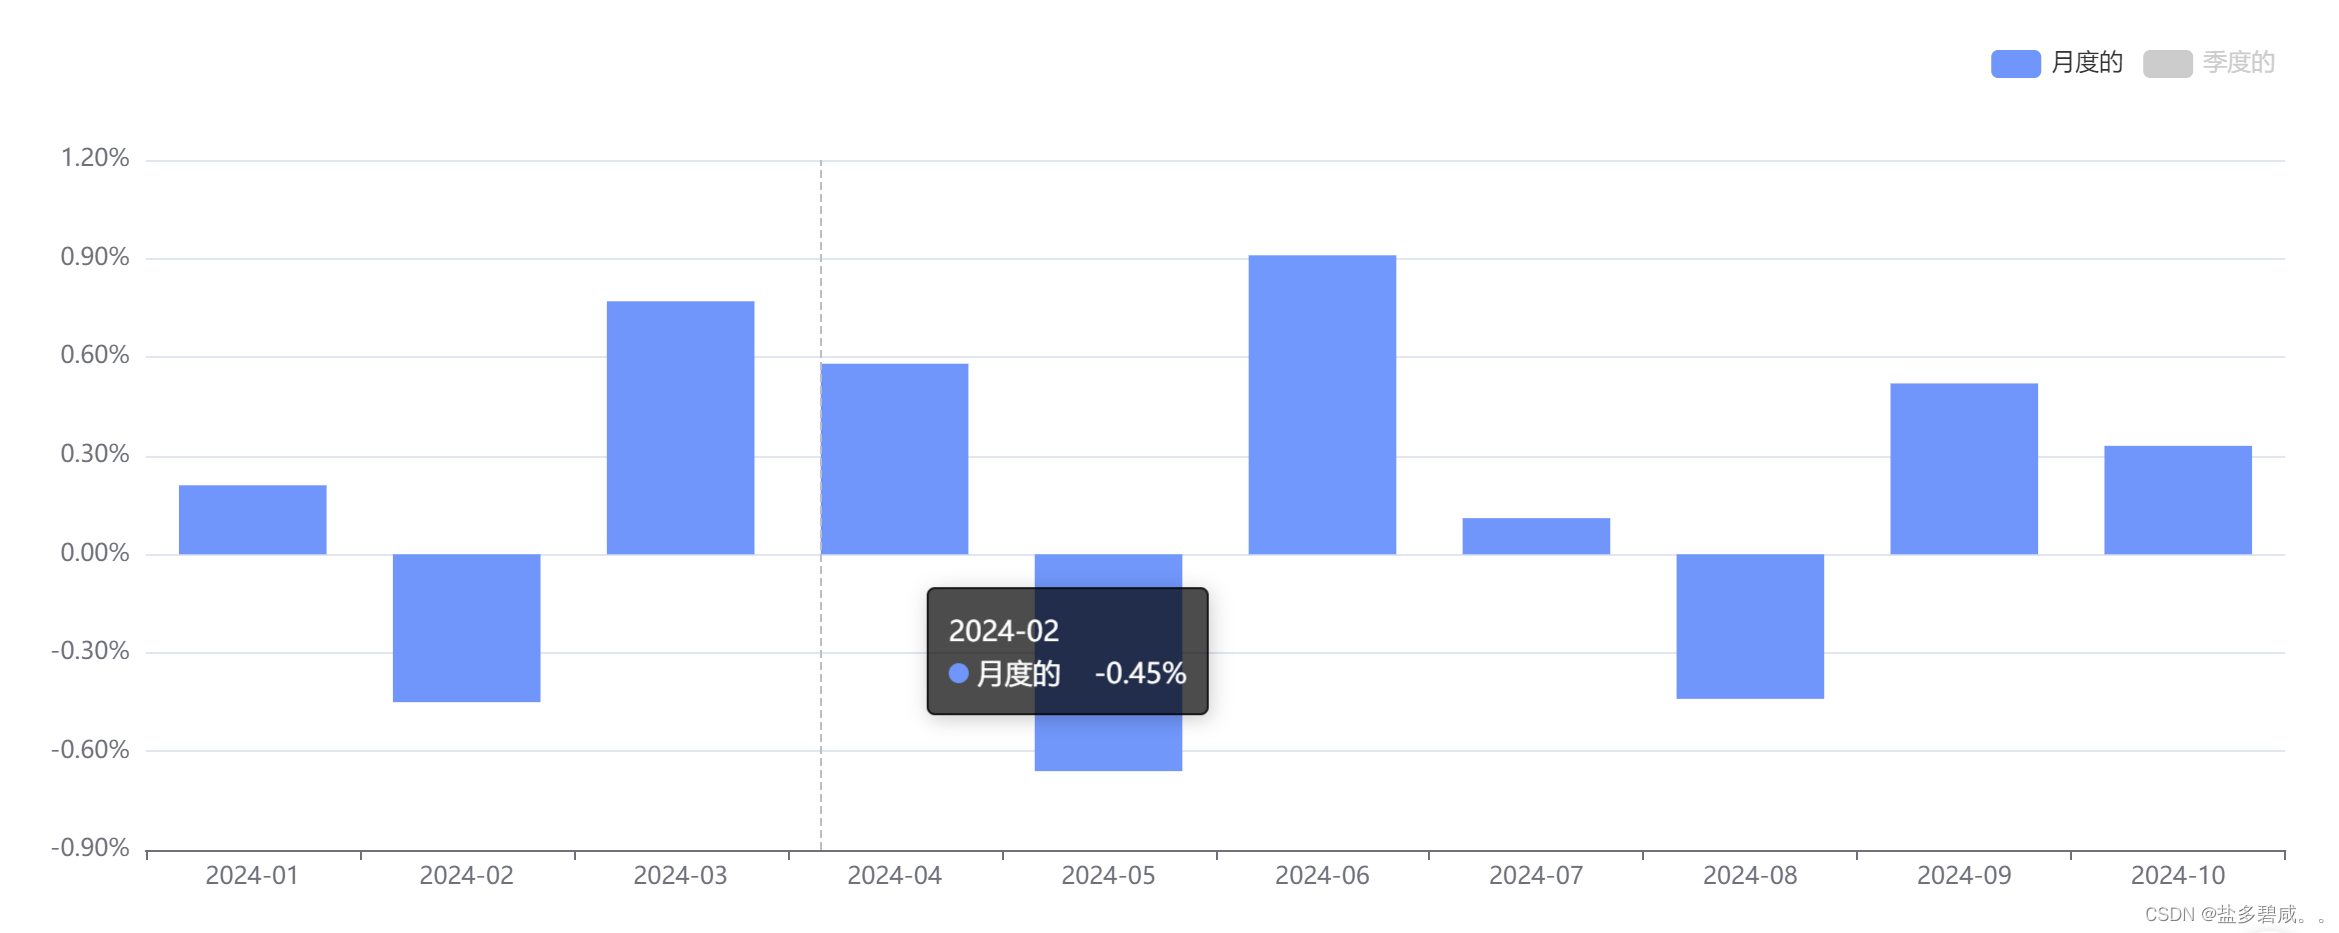
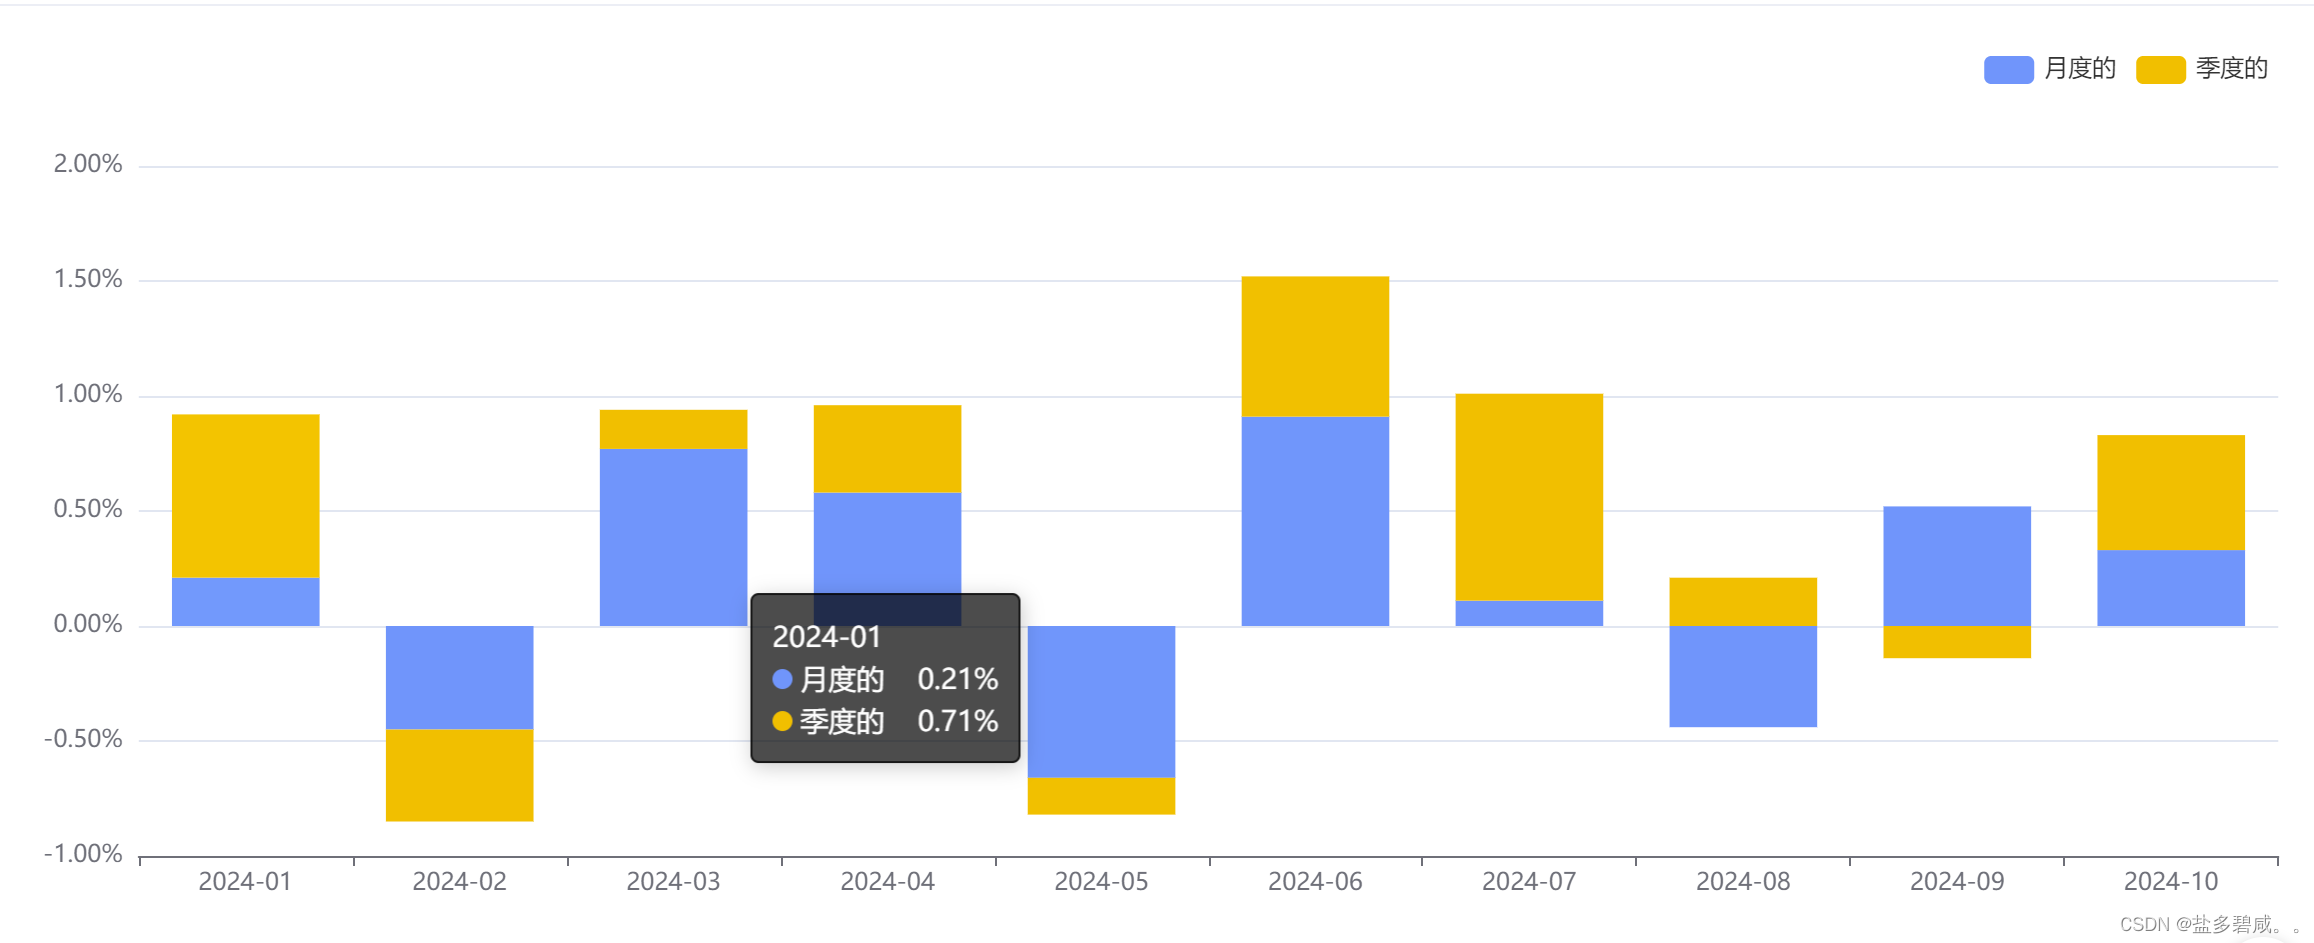
1、默认只显示 月度的 数据,手动点击 legend 季度的 数据才会显示;
2、监听左侧菜单栏的宽度变化,图表宽度自适应展示
<template><div><div id="barChart" ref="barChartRef" style="width: 100%; height: 450px"></div></div>
</template><script>
import * as echarts from 'echarts';
export default {name: '',props: {},components: {},data () {return {chart: null,_thisForChart: null,_thisForWindow: null,}},created() {},mounted() {this.$nextTick(() => {this.initBarChart()this.addEventListenerToSidebarContainer(this)this.addEventListenerToWindowResize(this)})},beforeDestroy () {this.removeEventListenerToSidebarContainer()this.removeEventListenerToWindowResize()},computed: {},watch: {},methods: {initBarChart() {let xAxisData = ['2024-01','2024-02','2024-03','2024-04','2024-05','2024-06','2024-07','2024-08','2024-09','2024-10',] // X轴数据let mounthly = ['0.21','-0.45','0.77','0.58','-0.66','0.91','0.11','-0.44','0.52','0.33'] // 月度的let quarterlyData = ['0.71','-0.40','0.17','0.38','-0.16','0.61','0.90','0.21','-0.14','0.50',] // 季度的var chartDom = document.getElementById('barChart');this.chart = echarts.init(chartDom);var emphasisStyle = {itemStyle: {shadowBlur: 10,shadowColor: 'rgba(0,0,0,0.1)'}};let option = {color: ['#6394F9','#F8BF20'],legend: {show: true,data: ['月度的', '季度的'],right: '1%',selected: {'季度的': false,} // 默认不显示月度的},grid: {left: '5%',right: '1%',bottom: '10%',},tooltip: {trigger: 'axis',backgroundColor: 'rgba( 0, 0, 0,0.7)',borderColor: 'rgba( 0, 0, 0,0.7)',formatter:function(params) {var str = params[0].name + '</br>'for(let item of params) {str = `<span style='color: #fff;'>${str}</span><div style='display:flex;align-items:center;justify-content:space-between;'><span>${item.marker}<span style='color: #fff;'>${item.seriesName}</span></span> <span style='color: #fff;'>${item.value}%</span></div>`}return str;}},xAxis: {data: xAxisData,name: '',axisLine: { onZero: false },splitLine: { show: false },splitArea: { show: false }},yAxis: {splitLine: {lineStyle: {type: 'solid',}},axisLabel: {show: true,formatter: (value) => {return `${value.toFixed(2)}%`}},},series: [{name: '月度的',type: 'bar',stack: 'one',// emphasis: emphasisStyle,// barWidth: '60%', // 设置柱宽为系列宽度的data: mounthly,},{name: '季度的',type: 'bar',stack: 'one',// emphasis: emphasisStyle,// barWidth: '60%', // 设置柱宽为系列宽度的data: quarterlyData,}]}this.chart.setOption(option,true);},// 监听侧边栏导航的宽度发生变化addEventListenerToSidebarContainer(_this) {let sidebarContainer = document.getElementsByClassName("sidebar-container")[0];this._thisForChart = _this;sidebarContainer &&sidebarContainer.addEventListener("transitionend", this.sidebarResizeHandler);},removeEventListenerToSidebarContainer() {let sidebarContainer = document.getElementsByClassName("sidebar-container")[0];this._thisForChart = nullsidebarContainer &&sidebarContainer.removeEventListener("transitionend", this.sidebarResizeHandler);},sidebarResizeHandler(e) {if (e.propertyName === "width") {this._thisForChart.chart.resize();}},// window 的尺寸发生变化的时候 会执行图表的resizeaddEventListenerToWindowResize(_this) {this._thisForWindow = _this;window.addEventListener("resize", this.windowResizeHandler);},removeEventListenerToWindowResize(_this) {this. _thisForWindow = nullwindow.removeEventListener("resize", this.windowResizeHandler);},windowResizeHandler(e) {this._thisForWindow.chart.resize();},},}
</script><style lang="scss" scoped></style>
展示效果图:
这篇关于vue echarts 柱状图 堆叠柱状图的文章就介绍到这儿,希望我们推荐的文章对编程师们有所帮助!


