本文主要是介绍关于后台管理系统的一些系统监控案例,希望对大家解决编程问题提供一定的参考价值,需要的开发者们随着小编来一起学习吧!
关于后台管理系统的一些系统监控案例
在阅读开源的项目的时候,发现了一个很神奇的功能。
https://github.com/valarchie/AgileBoot-Back-End
我这个是本地去运行的,发现他可以检测到这么多的数据
下面我们就来看他是如何进行的这样一个检测
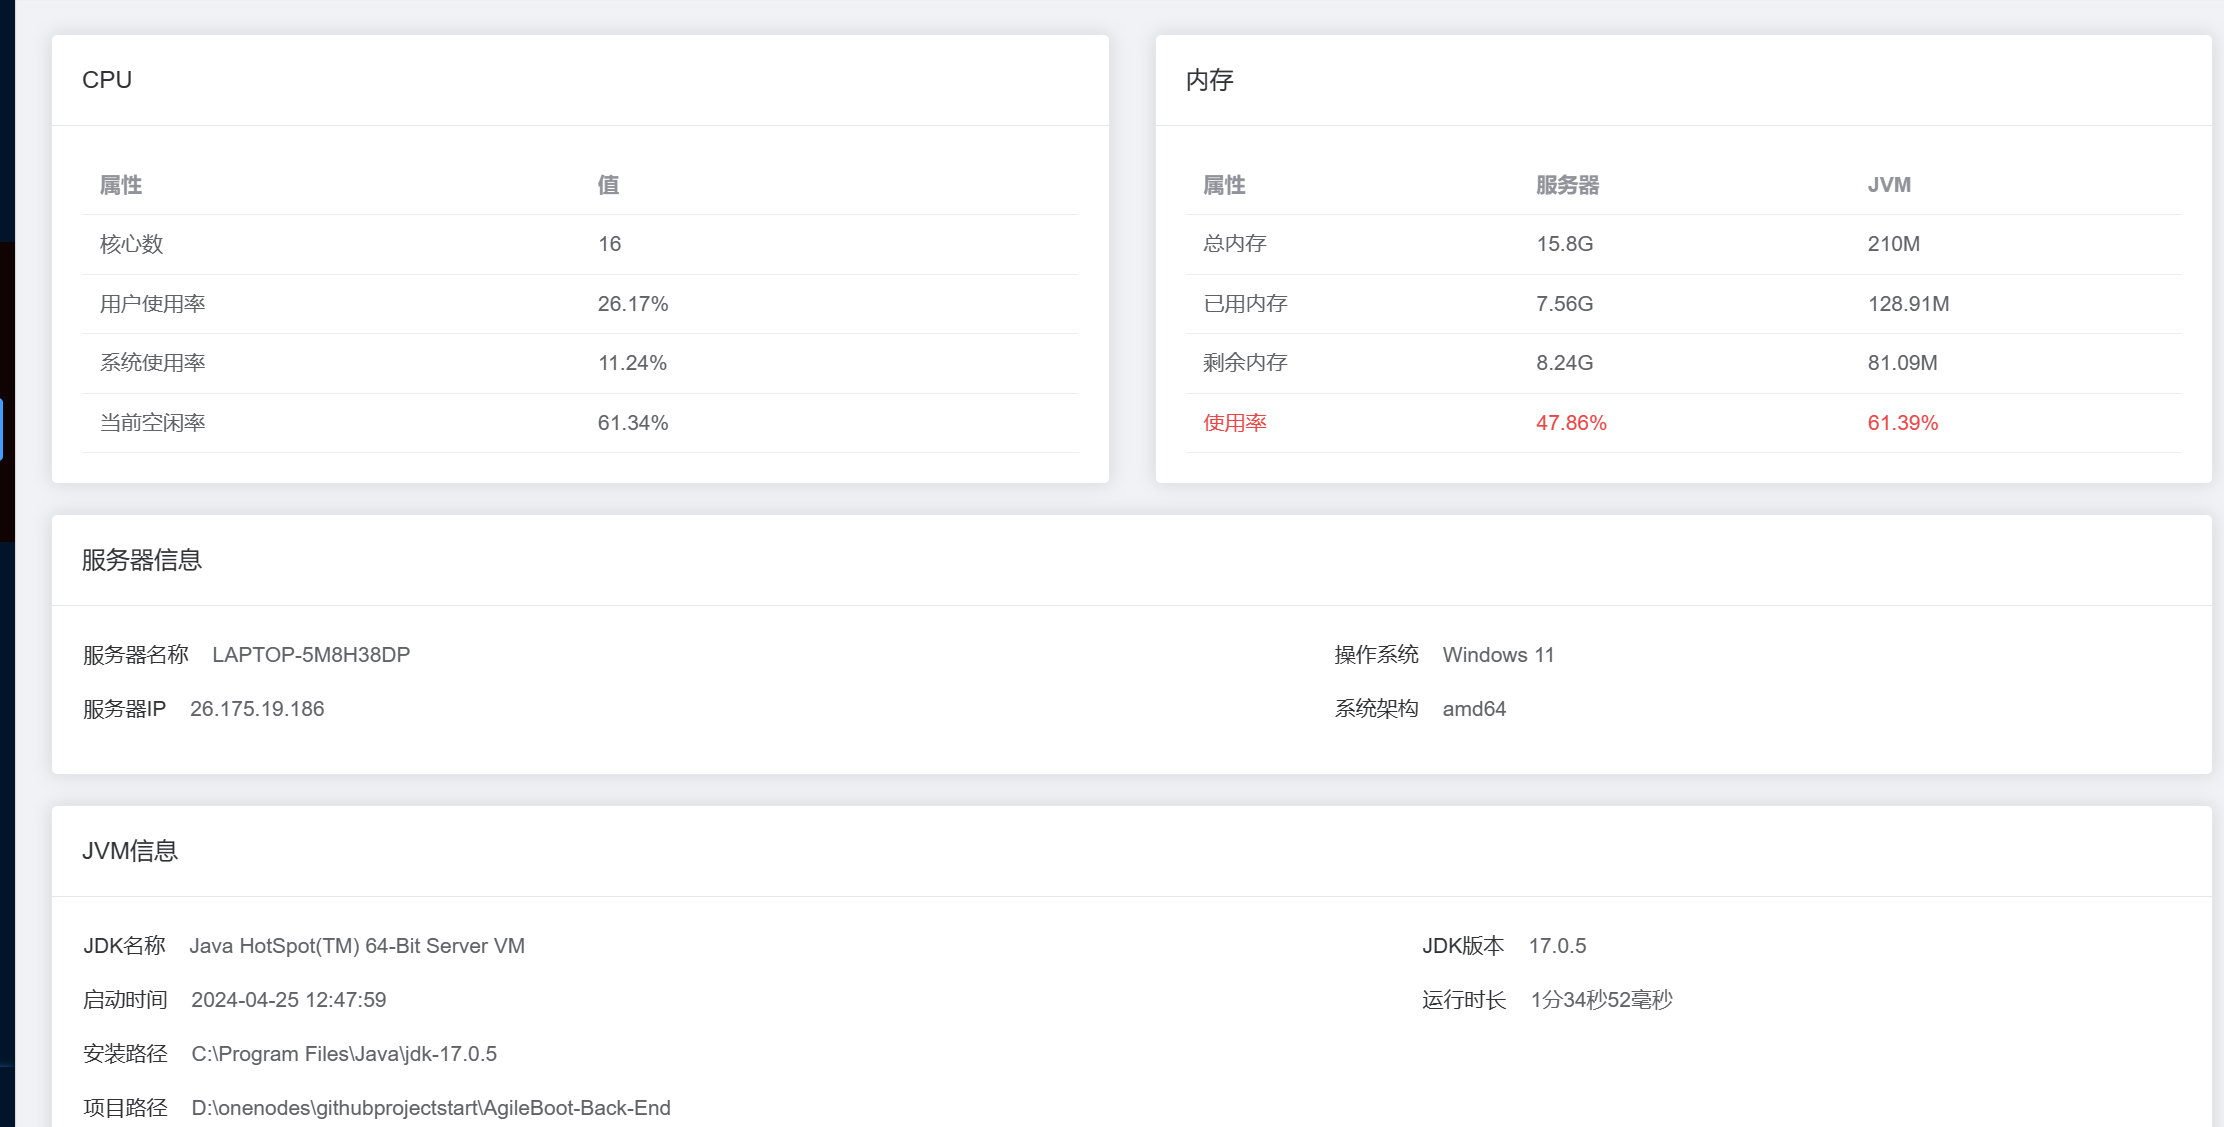
我们首先来看他后端返回的一个结果:
{"code": 0,"msg": "操作成功","data": {"cpuInfo": {"cpuNum": 16,"total": 1625000.0,"sys": 5.86,"used": 18.84,"wait": 0.0,"free": 74.82},"memoryInfo": {"total": 15.8,"used": 9.77,"free": 6.02,"usage": 61.86},"jvmInfo": {"total": 210.0,"max": 4046.0,"free": 72.05,"version": "17.0.5","home": "C:\\Program Files\\Java\\jdk-17.0.5","name": "Java HotSpot(TM) 64-Bit Server VM","startTime": "2024-04-25 12:47:59","usage": 65.69,"used": 137.95,"runTime": "3分54秒728毫秒","inputArgs": "[-XX:TieredStopAtLevel=1, -Dspring.output.ansi.enabled=always, -Dcom.sun.management.jmxremote, -Dspring.jmx.enabled=true, -Dspring.liveBeansView.mbeanDomain, -Dspring.application.admin.enabled=true, -Dmanagement.endpoints.jmx.exposure.include=*, -javaagent:E:\\ideasss\\IntelliJ IDEA 2022.3.1\\lib\\idea_rt.jar=13917:E:\\ideasss\\IntelliJ IDEA 2022.3.1\\bin, -Dfile.encoding=UTF-8]"},"systemInfo": {"computerName": "LAPTOP-5M8H38DP","computerIp": "26.175.19.186","userDir": "D:\\onenodes\\githubprojectstart\\AgileBoot-Back-End","osName": "Windows 11","osArch": "amd64"},"diskInfos": [{"dirName": "C:\\","sysTypeName": "NTFS","typeName": "本地固定磁盘 (C:)","total": "200.0 GB","free": "34.6 GB","used": "165.4 GB","usage": 82.7096},{"dirName": "D:\\","sysTypeName": "NTFS","typeName": "本地固定磁盘 (D:)","total": "137.0 GB","free": "9.0 GB","used": "128.0 GB","usage": 93.4018},{"dirName": "E:\\","sysTypeName": "NTFS","typeName": "本地固定磁盘 (E:)","total": "137.7 GB","free": "52.7 GB","used": "85.0 GB","usage": 61.7589}]}
}
可以看到是如此之多。首先我们来看后台他是如何进行一个获取的。
我们从上往下慢慢的去看
服务器数据检测
/*** CPU相关信息*/
private CpuInfo cpuInfo = new CpuInfo();
他这里定义了cpu有这些字段
/*** 核心数*/
private int cpuNum;/*** CPU总的使用率*/
private double total;/*** CPU系统使用率*/
private double sys;/*** CPU用户使用率*/
private double used;/*** CPU当前等待率*/
private double wait;/*** CPU当前空闲率*/
private double free;
之后来看是如何获取的:
/*** 设置CPU信息*/
private void fillCpuInfo(CentralProcessor processor) {// CPU信息long[] prevTicks = processor.getSystemCpuLoadTicks();Util.sleep(OSHI_WAIT_SECOND);long[] ticks = processor.getSystemCpuLoadTicks();long nice = ticks[TickType.NICE.getIndex()] - prevTicks[TickType.NICE.getIndex()];long irq = ticks[TickType.IRQ.getIndex()] - prevTicks[TickType.IRQ.getIndex()];long softIrq = ticks[TickType.SOFTIRQ.getIndex()] - prevTicks[TickType.SOFTIRQ.getIndex()];long steal = ticks[TickType.STEAL.getIndex()] - prevTicks[TickType.STEAL.getIndex()];long cSys = ticks[TickType.SYSTEM.getIndex()] - prevTicks[TickType.SYSTEM.getIndex()];long user = ticks[TickType.USER.getIndex()] - prevTicks[TickType.USER.getIndex()];long ioWait = ticks[TickType.IOWAIT.getIndex()] - prevTicks[TickType.IOWAIT.getIndex()];long idle = ticks[TickType.IDLE.getIndex()] - prevTicks[TickType.IDLE.getIndex()];long totalCpu = user + nice + cSys + idle + ioWait + irq + softIrq + steal;cpuInfo.setCpuNum(processor.getLogicalProcessorCount());cpuInfo.setTotal(totalCpu);cpuInfo.setSys(cSys);cpuInfo.setUsed(user);cpuInfo.setWait(ioWait);cpuInfo.setFree(idle);
}
这里用到了
CentralProcessor这个接口
这个是github的一个项目。oshi/oshi: Native Operating System and Hardware Information (github.com)
oshi。
通过他就可以获得一些系统的参数。
同时也可以获取到内存。
/*** 设置内存信息*/
private void fillMemoryInfo(GlobalMemory memory) {memoryInfo.setTotal(memory.getTotal());memoryInfo.setUsed(memory.getTotal() - memory.getAvailable());memoryInfo.setFree(memory.getAvailable());
}
以及磁盘:
/*** 设置磁盘信息*/
private void fillDiskInfos(OperatingSystem os) {FileSystem fileSystem = os.getFileSystem();List<OSFileStore> fsArray = fileSystem.getFileStores();for (OSFileStore fs : fsArray) {long free = fs.getUsableSpace();long total = fs.getTotalSpace();long used = total - free;DiskInfo diskInfo = new DiskInfo();diskInfo.setDirName(fs.getMount());diskInfo.setSysTypeName(fs.getType());diskInfo.setTypeName(fs.getName());diskInfo.setTotal(convertFileSize(total));diskInfo.setFree(convertFileSize(free));diskInfo.setUsed(convertFileSize(used));if (total != 0){diskInfo.setUsage(NumberUtil.div(used * 100, total, 4));} else {//Windows下如果有光驱(可能是虚拟光驱),total为0,不能做除数diskInfo.setUsage(0);}diskInfos.add(diskInfo);}
之后的服务器信息,如果本地运行也就是本地的信息

/*** 设置服务器信息*/
private void fillSystemInfo() {Properties props = System.getProperties();systemInfo.setComputerName(NetUtil.getLocalHostName());systemInfo.setComputerIp(NetUtil.getLocalhost().getHostAddress());systemInfo.setOsName(props.getProperty("os.name"));systemInfo.setOsArch(props.getProperty("os.arch"));systemInfo.setUserDir(props.getProperty("user.dir"));
}
是这样进行的一个获取。
NetUtil就是Hutool里面的东西。
剩下的东西就是从java的自带类System.getProperties里面获取到的。
下面是他可以获得的常见属性:
java.version: Java运行时环境版本java.vendor: Java运行时环境的供应商java.vendor.url: Java供应商的URLjava.home: Java运行时环境的安装目录user.dir: 用户的当前工作目录java.class.version: Java类文件的版本号os.name: 操作系统的名称os.arch: 操作系统的架构os.version: 操作系统的版本file.separator: 文件路径分隔符(例如,在Windows上是\,在Unix上是/)path.separator: 路径的分隔符(例如,在Windows上是;,在Unix上是:)line.separator: 行分隔符(例如,\n在Unix上,\r\n在Windows上)java.specification.version: Java平台的规范版本java.specification.vendor: Java平台规范的供应商java.specification.name: Java平台规范的名称java.vm.specification.version: Java虚拟机规范的版本java.vm.specification.vendor: Java虚拟机规范的供应商java.vm.specification.name: Java虚拟机规范的名称java.vm.version: Java虚拟机实现的版本java.vm.vendor: Java虚拟机实现的供应商java.vm.name: Java虚拟机实现的名称java.runtime.version: Java运行时环境的版本java.runtime.name: Java运行时环境的名称java.ext.dirs: 系统扩展目录的路径java.endorsed.dirs: 被认可的库的目录java.library.path: 系统库的路径java.io.tmpdir: 临时文件目录的路径java.compiler: 要使用的JIT编译器的名称java.class.path: 类路径,用于搜索类文件和库user.name: 用户的账号名称user.home: 用户的主目录user.timezone: 用户的时区
这里需要注意的是,我们在用osi的时候
public static ServerInfo fillInfo() {ServerInfo serverInfo = new ServerInfo();oshi.SystemInfo si = new oshi.SystemInfo();HardwareAbstractionLayer hal = si.getHardware();serverInfo.fillCpuInfo(hal.getProcessor());serverInfo.fillMemoryInfo(hal.getMemory());serverInfo.fillSystemInfo();serverInfo.fillJvmInfo();serverInfo.fillDiskInfos(si.getOperatingSystem());return serverInfo;
}
要给他传递参数,才能正确的获取到这个。
缓存监控
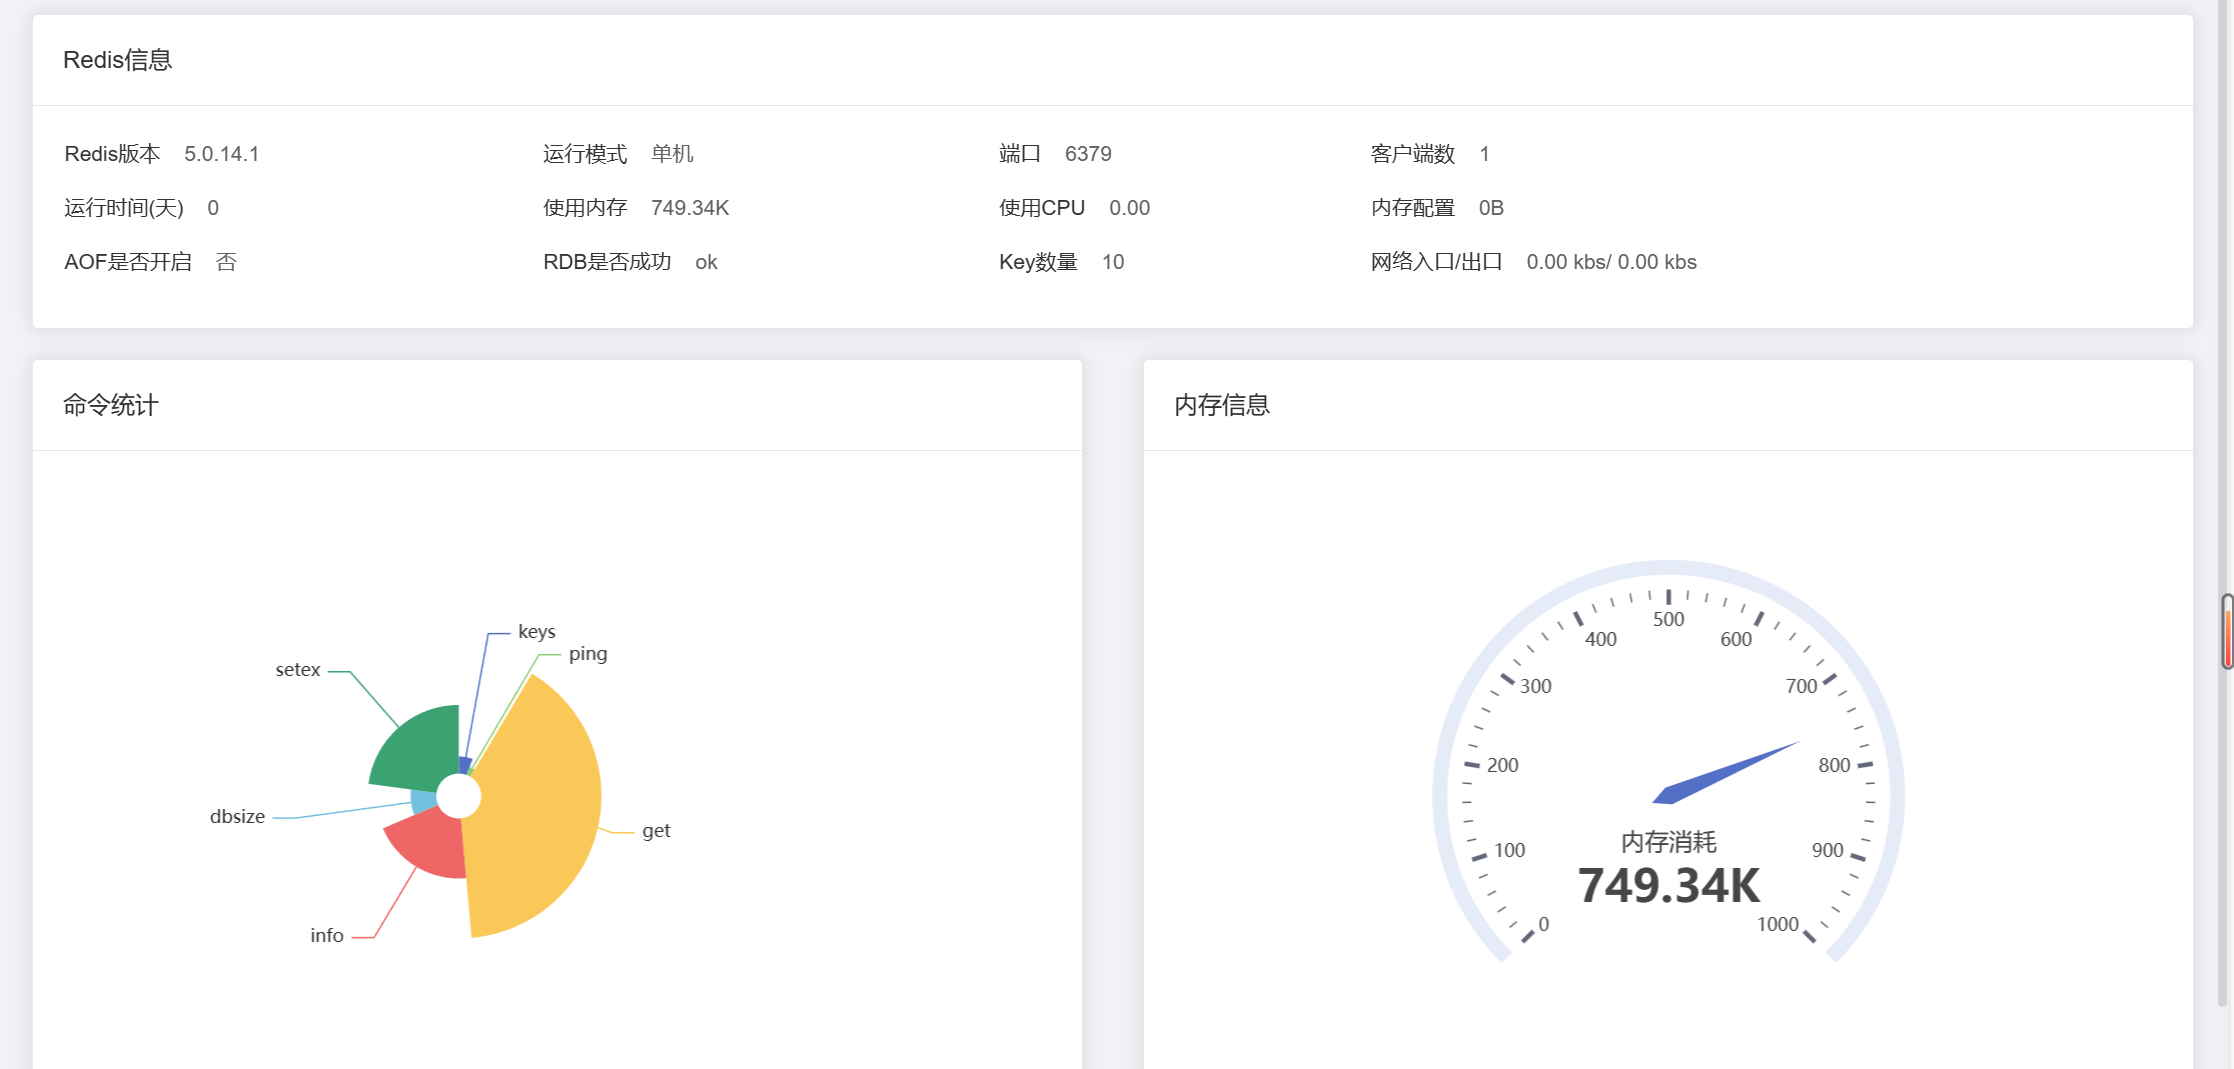
之后来看他是如何获得redis的信息的。
下面是响应的数据:
{"code": 0,"msg": "操作成功","data": {"info": {"uptime_in_seconds": "1902","maxmemory_human": "0B","aof_last_cow_size": "0","master_replid2": "0000000000000000000000000000000000000000","mem_replication_backlog": "0","aof_rewrite_scheduled": "0","total_net_input_bytes": "4834","rss_overhead_ratio": "0.00","hz": "10","redis_build_id": "5627b8177c9289c","aof_last_bgrewrite_status": "ok","multiplexing_api": "WinSock_IOCP","client_recent_max_output_buffer": "0","allocator_resident": "587202560","mem_fragmentation_bytes": "0","repl_backlog_first_byte_offset": "0","redis_mode": "standalone","redis_git_dirty": "0","allocator_rss_bytes": "8388608","repl_backlog_histlen": "0","rss_overhead_bytes": "-586477112","total_system_memory": "0","loading": "0","evicted_keys": "0","cluster_enabled": "0","redis_version": "5.0.14.1","repl_backlog_active": "0","mem_aof_buffer": "0","allocator_frag_bytes": "539235920","instantaneous_ops_per_sec": "0","used_memory_human": "749.34K","role": "master","maxmemory": "0","used_memory_lua": "37888","rdb_current_bgsave_time_sec": "-1","used_memory_startup": "661224","lazyfree_pending_objects": "0","used_memory_dataset_perc": "51.43%","allocator_frag_ratio": "14.62","arch_bits": "64","mem_clients_normal": "49950","expired_time_cap_reached_count": "0","mem_fragmentation_ratio": "1.00","aof_last_rewrite_time_sec": "-1","master_replid": "d9ae6531155b1ebd86e9dfe419a6bf0504a02e8a","aof_rewrite_in_progress": "0","config_file": "","lru_clock": "2745918","maxmemory_policy": "noeviction","run_id": "50a68c2d09ac5826c61be90414ee99e82a71a4ce","latest_fork_usec": "0","total_commands_processed": "37","expired_keys": "0","used_memory": "767320","mem_clients_slaves": "0","keyspace_misses": "6","executable": "e:\redis\redis-server.exe","db1": "keys=5,expires=0,avg_ttl=0","db0": "keys=10,expires=7,avg_ttl=2093322","db2": "keys=3,expires=0,avg_ttl=0","used_memory_peak_human": "749.34K","db4": "keys=6,expires=0,avg_ttl=0","keyspace_hits": "8","rdb_last_cow_size": "0","used_memory_overhead": "712750","active_defrag_hits": "0","tcp_port": "6379","uptime_in_days": "0","used_memory_peak_perc": "100.00%","blocked_clients": "0","sync_partial_err": "0","used_memory_scripts_human": "0B","aof_current_rewrite_time_sec": "-1","aof_enabled": "0","master_repl_offset": "0","used_memory_dataset": "54570","used_cpu_user": "0.296875","rdb_last_bgsave_status": "ok","atomicvar_api": "pthread-mutex","allocator_rss_ratio": "1.01","client_recent_max_input_buffer": "2","aof_last_write_status": "ok","mem_allocator": "jemalloc-5.2.1-redis","used_memory_scripts": "0","used_memory_peak": "767320","process_id": "1480","used_cpu_sys": "0.109375","repl_backlog_size": "1048576","connected_slaves": "0","total_system_memory_human": "0B","sync_full": "0","connected_clients": "1","allocator_active": "578813952","total_net_output_bytes": "18441","pubsub_channels": "0","active_defrag_key_hits": "0","rdb_changes_since_last_save": "8","instantaneous_input_kbps": "0.00","configured_hz": "10","used_memory_rss_human": "708.45K","expired_stale_perc": "0.00","active_defrag_misses": "0","used_cpu_sys_children": "0.000000","number_of_cached_scripts": "0","sync_partial_ok": "0","used_memory_lua_human": "37.00K","rdb_last_save_time": "1714020048","pubsub_patterns": "0","slave_expires_tracked_keys": "0","redis_git_sha1": "ec77f72d","used_memory_rss": "725448","rdb_last_bgsave_time_sec": "-1","os": "Windows  ","mem_not_counted_for_evict": "0","active_defrag_running": "0","rejected_connections": "0","active_defrag_key_misses": "0","allocator_allocated": "39578032","instantaneous_output_kbps": "0.00","second_repl_offset": "-1","rdb_bgsave_in_progress": "0","used_cpu_user_children": "0.000000","total_connections_received": "1","migrate_cached_sockets": "0"},"dbSize": 10,"commandStats": [{"name": "keys","value": "2"},{"name": "ping","value": "1"},{"name": "get","value": "14"},{"name": "info","value": "9"},{"name": "dbsize","value": "4"},{"name": "setex","value": "8"}]}
}
之后我们先来看他的代码实现:
public RedisCacheInfoDTO getRedisCacheInfo() {Properties info = (Properties) redisTemplate.execute((RedisCallback<Object>) RedisServerCommands::info);Properties commandStats = (Properties) redisTemplate.execute((RedisCallback<Object>) connection -> connection.info("commandstats"));Long dbSize = redisTemplate.execute(RedisServerCommands::dbSize);if (commandStats == null || info == null) {throw new ApiException(Internal.INTERNAL_ERROR, "获取Redis监控信息失败。");}RedisCacheInfoDTO cacheInfo = new RedisCacheInfoDTO();cacheInfo.setInfo(info);cacheInfo.setDbSize(dbSize);cacheInfo.setCommandStats(new ArrayList<>());commandStats.stringPropertyNames().forEach(key -> {String property = commandStats.getProperty(key);CommandStatusDTO commonStatus = new CommandStatusDTO();commonStatus.setName(StrUtil.removePrefix(key, "cmdstat_"));commonStatus.setValue(StrUtil.subBetween(property, "calls=", ",usec"));cacheInfo.getCommandStats().add(commonStatus);});return cacheInfo;
}
这个我们分三步来进行解析。
也就是他set的三个对象。Info dbSize和commandStats
首先是info
Properties info = (Properties) redisTemplate.execute((RedisCallback<Object>) RedisServerCommands::info);
execute 方法的作用是执行一个 Redis 命令,并返回执行结果。它的参数类型是 RedisCallback,它是一个函数式接口,用于表示一个可以执行 Redis 命令的回调函数。
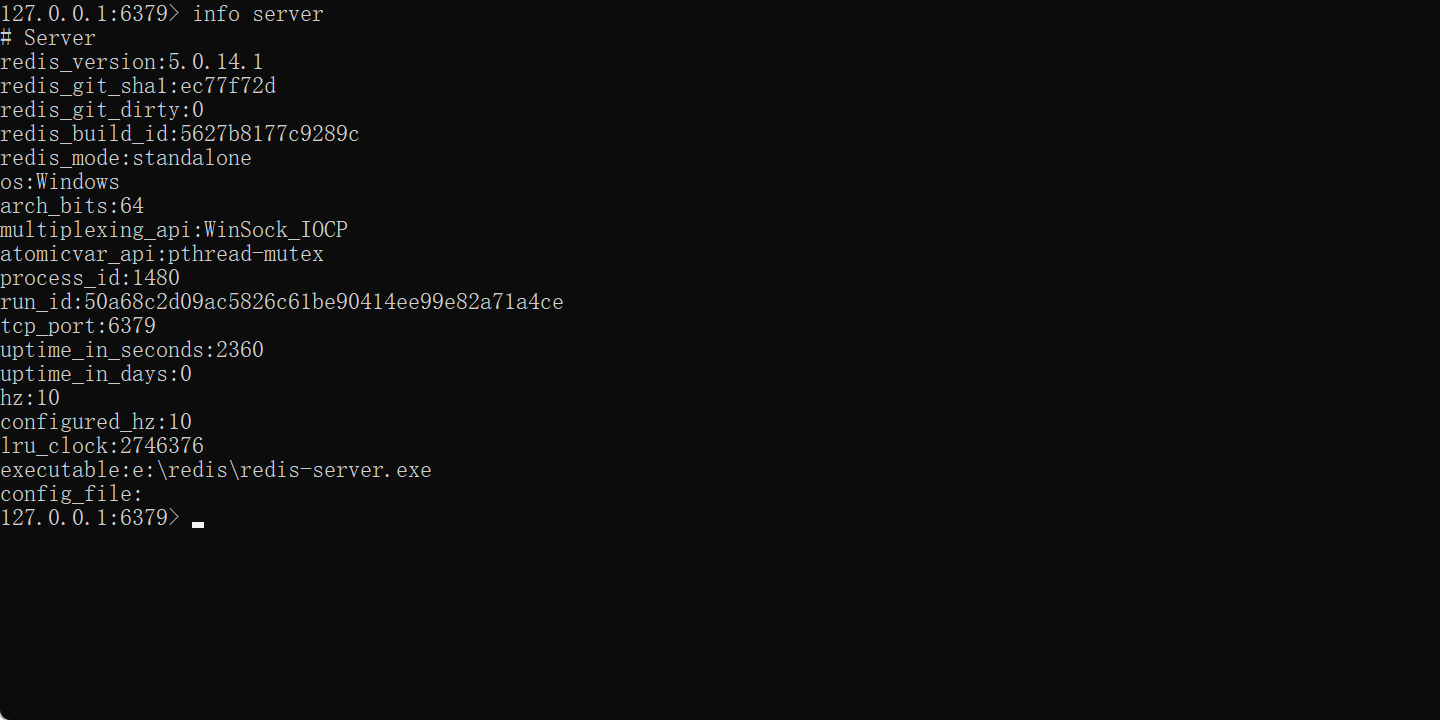
他这个就相当于执行了redis的一个
info server的指令
可以获得下面的信息
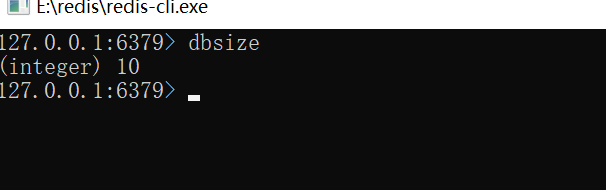
之后的dbsize也是同理
之后来看
commandStats.stringPropertyNames().forEach(key -> {String property = commandStats.getProperty(key);CommandStatusDTO commonStatus = new CommandStatusDTO();commonStatus.setName(StrUtil.removePrefix(key, "cmdstat_"));commonStatus.setValue(StrUtil.subBetween(property, "calls=", ",usec"));cacheInfo.getCommandStats().add(commonStatus);
});
这个是从Redis 服务器返回的命令统计信息。
这里的关键是
commonStatus.setValue(StrUtil.subBetween(property, "calls=", ",usec"));:从属性值中提取命令调用次数,并设置到 commonStatus 对象中,使用 StrUtil.subBetween 方法提取。这里假设属性值的格式为 "calls=xxx,usec=xxx",通过 subBetween 方法提取出调用次数。
至此,缓存监控结束。
在线用户
最后是一个在线用户功能。
这个实现起来比较简单
public List<OnlineUserDTO> getOnlineUserList(String username, String ipAddress) {Collection<String> keys = redisTemplate.keys(CacheKeyEnum.LOGIN_USER_KEY.key() + "*");Stream<OnlineUserDTO> onlineUserStream = keys.stream().map(o ->CacheCenter.loginUserCache.getObjectOnlyInCacheByKey(o)).filter(Objects::nonNull).map(OnlineUserDTO::new);List<OnlineUserDTO> filteredOnlineUsers = onlineUserStream.filter(o ->StrUtil.isEmpty(username) || username.equals(o.getUsername())).filter( o ->StrUtil.isEmpty(ipAddress) || ipAddress.equals(o.getIpAddress())).collect(Collectors.toList());Collections.reverse(filteredOnlineUsers);return filteredOnlineUsers;
}
这段代码的核心功能是从 Redis 缓存中获取所有在线用户的信息,并根据给定的用户名和 IP 地址过滤出符合条件的在线用户列表。
那么这个ip是如何获取的呢?
其实我们可以发现在登陆的时候就已经获取到了。
他在redis里面是这样进行的一个存储
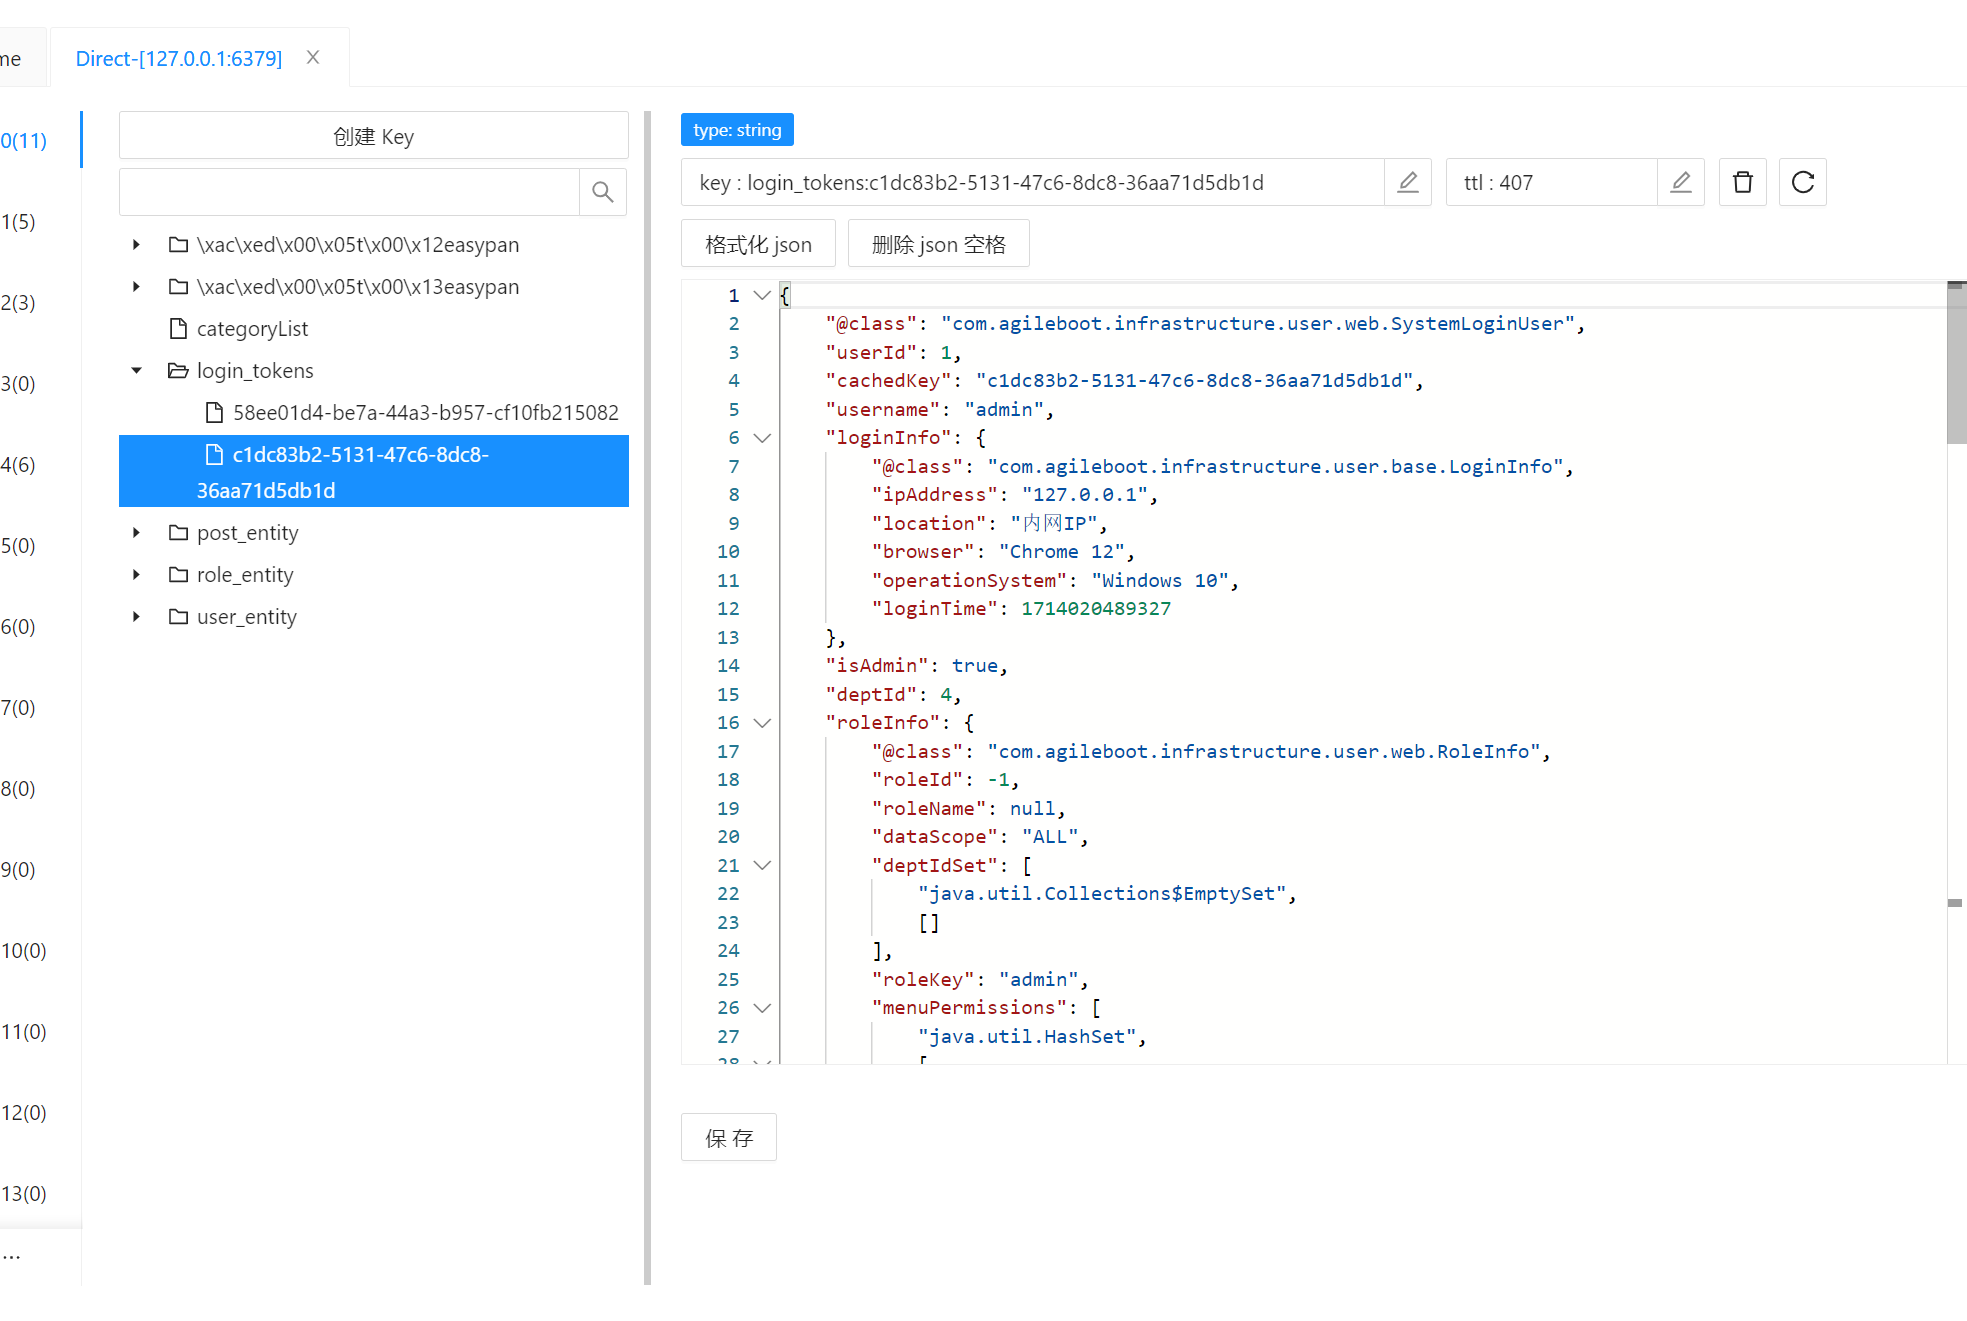
这里就不讲如何获取ip了。相信这个操作对大家来说是很简单的。
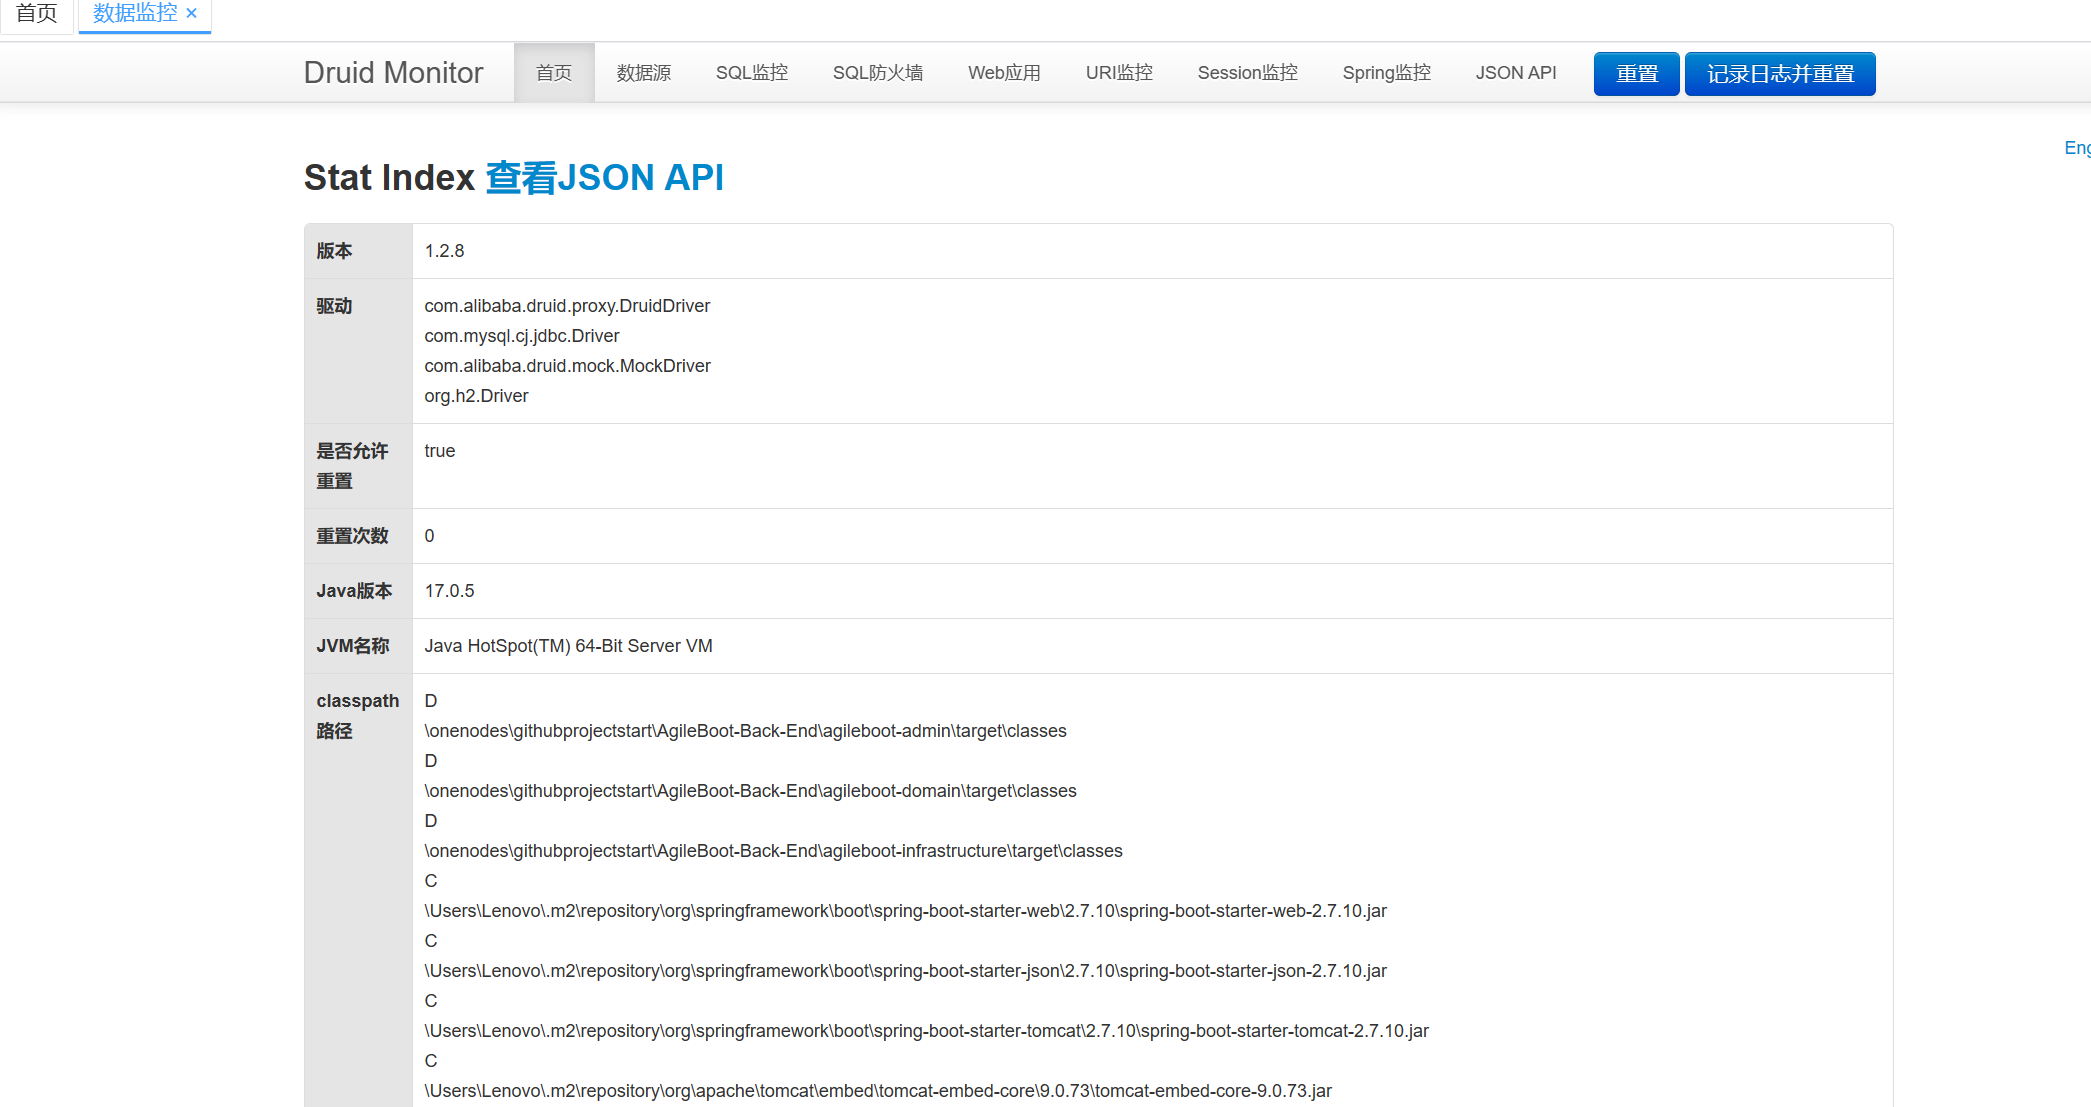
之后是他这个数据监控。我就不多说了
用的是druid的
这篇关于关于后台管理系统的一些系统监控案例的文章就介绍到这儿,希望我们推荐的文章对编程师们有所帮助!


