本文主要是介绍matlab使用教程(49)—绘制极坐标图,希望对大家解决编程问题提供一定的参考价值,需要的开发者们随着小编来一起学习吧!
以下示例演示如何在极坐标中创建线图、散点图和直方图。此外,还演示了如何对极坐标图添加注释和更改轴范围。
1创建极坐标线图
通过极坐标中的天线以可视方式呈现辐射图。加载文件 antennaData.mat ,该文件包含变量 theta 和rho 。变量 rho 用于测量天线对 theta 的每个值的辐射强度。通过使用 polarplot 函数在极坐标中绘制数据图,以可视化方式呈现该辐射图。
load('antennaData.mat')
figure
polarplot(theta,rho)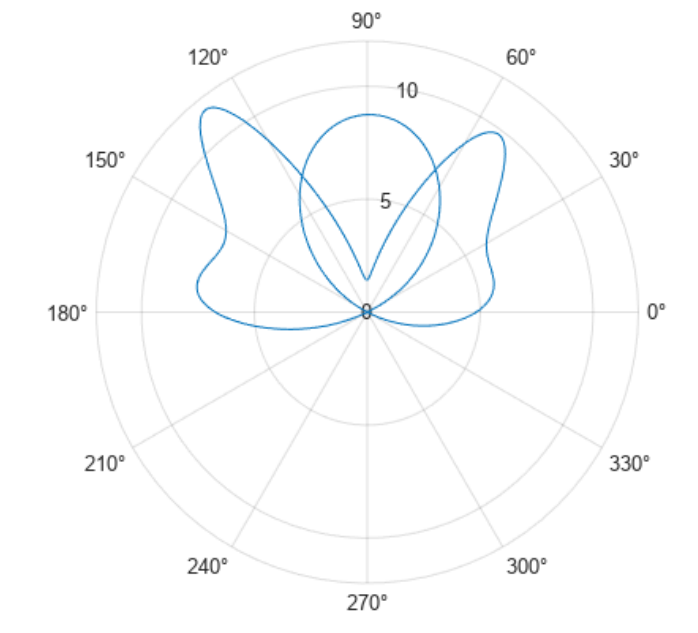
在 R2022a 之前,默认情况下极坐标区不包括度符号。要添加度符号,请使用 pax = gca 获取极坐标区。然后使用 pax.ThetaTickLabel = string(pax.ThetaTickLabel) + char(176) 修改刻度标签。
1.1多个极坐标线图
使用 hold on 保留当前极坐标区,然后通过 polarplot 绘制其他数据图。
rng('default')
noisy = rho + rand(size(rho));
hold on
polarplot(theta,noisy)
hold off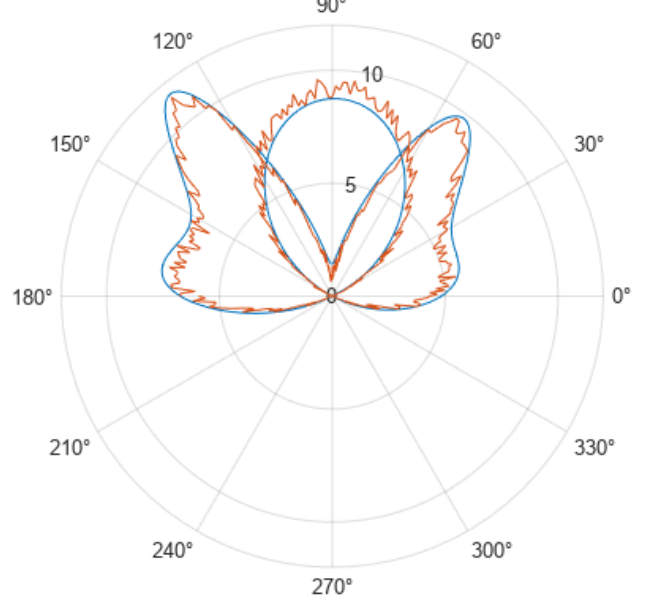
1.2为极坐标图添加注释
使用 legend 和 title 之类的注释函数,标记与其他可视化类型类似的极坐标图。
legend('Original','With Noise')
title('Antenna Radiation Pattern')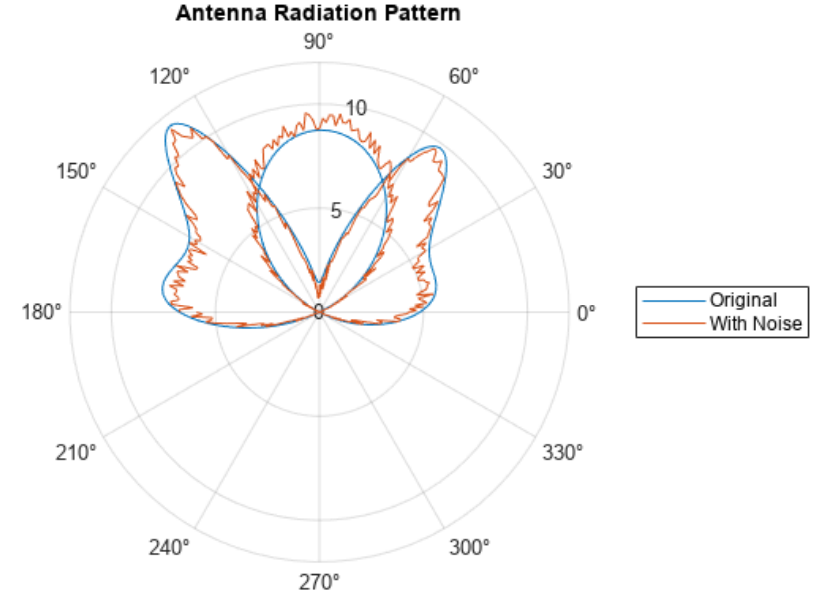
1.3更改极坐标区范围
默认情况下,在极坐标图中,半径的负值将被绘制为正值。使用 rlim 将 r 坐标轴范围调整为包含负值。
rmin = min(rho);
rmax = max(rho);
rlim([rmin rmax])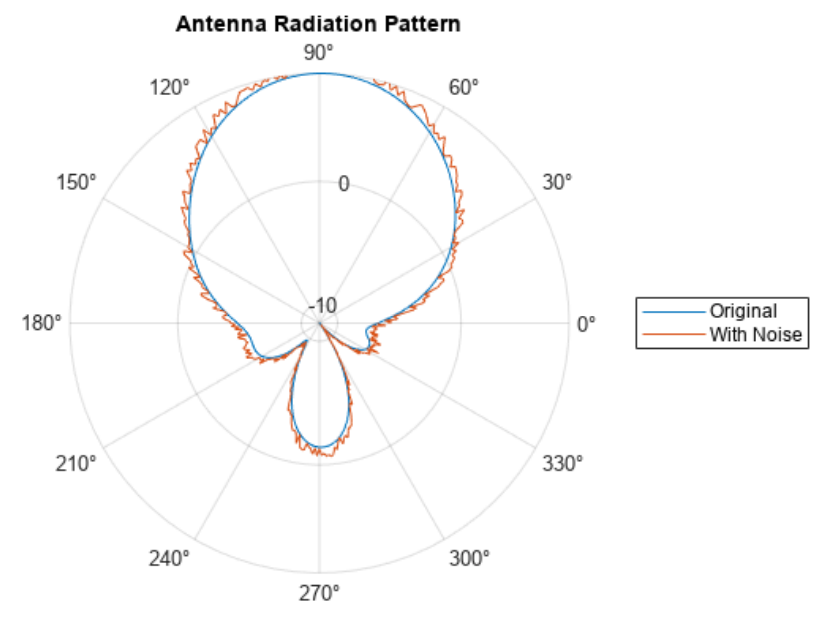
使用 thetalim 将 theta 坐标轴范围更改为 0 到 180。
thetalim([0 180])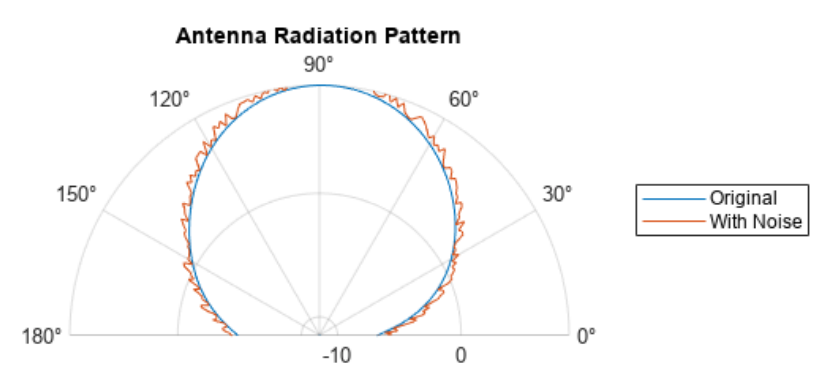
2.创建极坐标散点图
在极坐标中绘制风速数据图。加载文件 windData.dat ,该文件包含变量 direction 、 speed 、
humidity 和 C 。通过使用 polarscatter 函数在极坐标中绘制数据图,以可视化方式呈现风速图。
load('windData.mat')
polarscatter(direction,speed)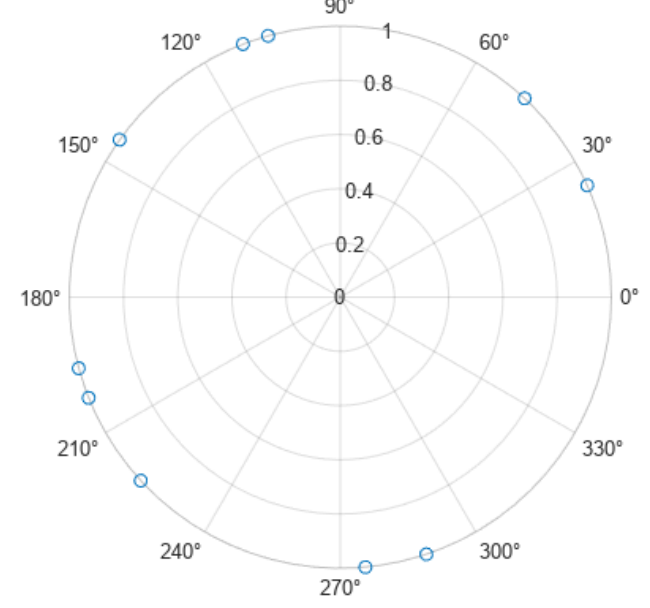
包括第三个数据输入以改变标记大小并表示第三个维度。
polarscatter(direction,speed,humidity)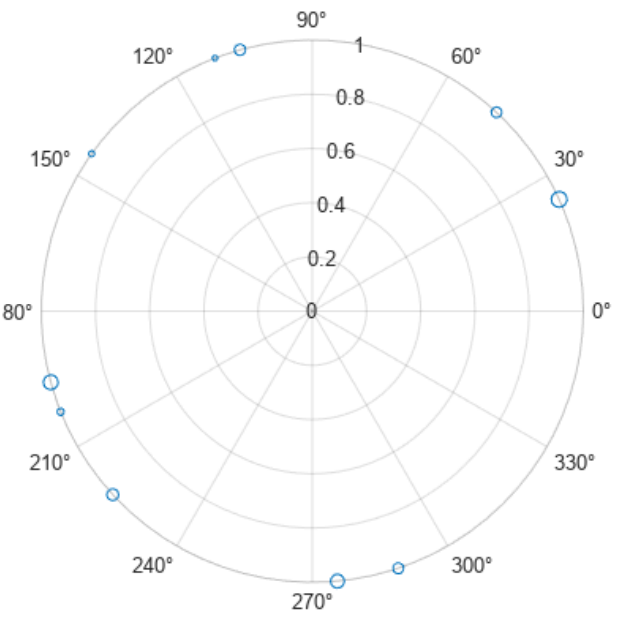
使用格式化输入调整标记显示属性。
polarscatter(direction,speed,humidity,C,'filled')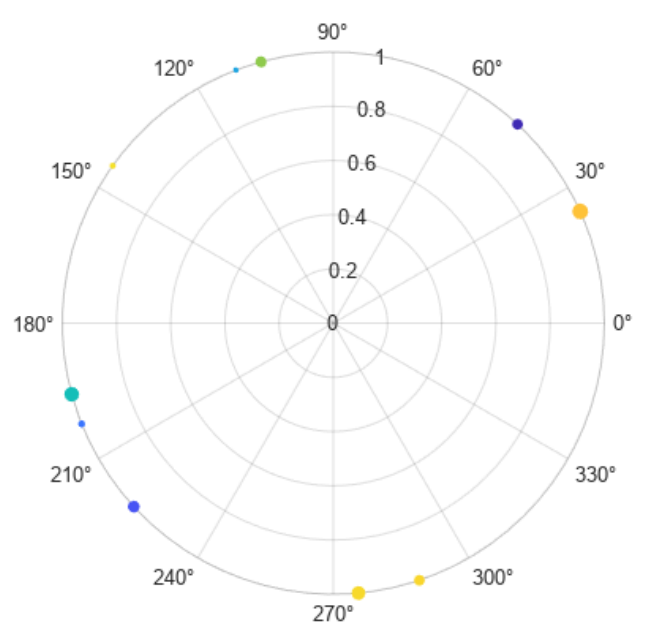
3.创建极坐标直方图
使用 polarhistogram 函数以可视化方式呈现数据,这将会生成称为风向图的可视化表示。
polarhistogram(direction)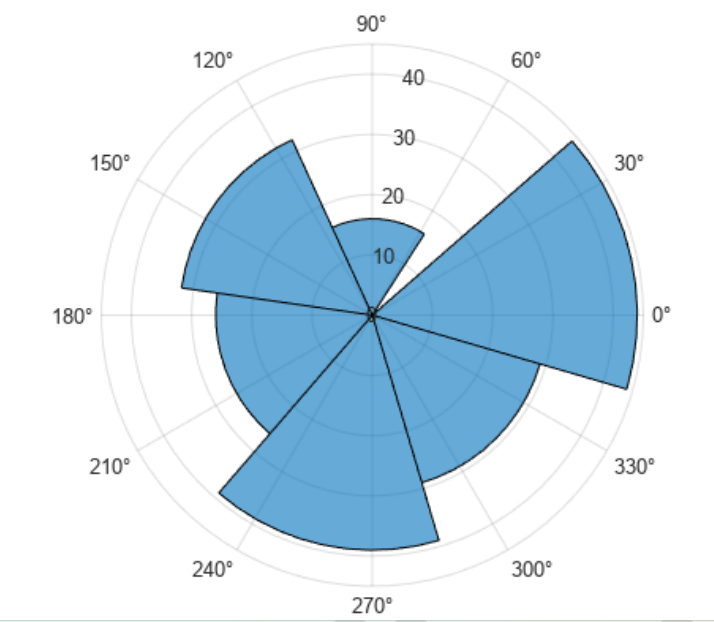
指定 bin 确定算法。polarhistogram 函数具有各种确定 bin 数量和 bin 宽度的算法,可从 BinMethod 字段中选择。
polarhistogram(direction,'BinMethod','sqrt')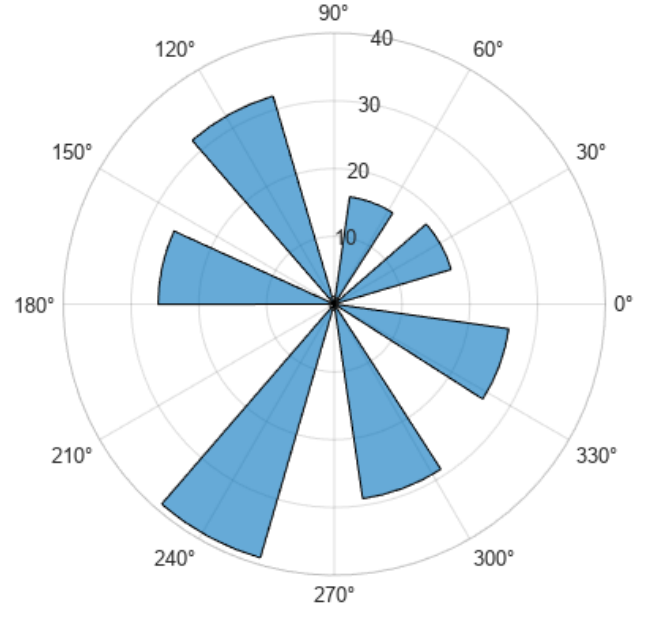
指定 bin 数量和 bin 宽度。
polarhistogram(direction,24,'BinWidth',.5)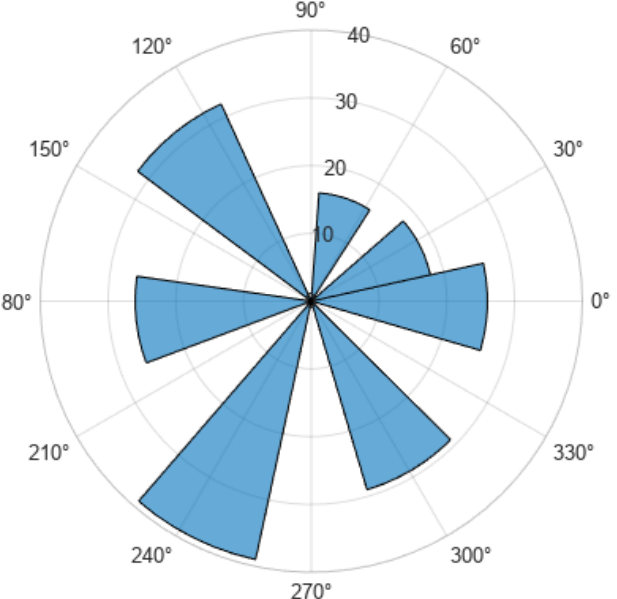
指定归一化方法并调整显示样式以排除任何填充。
polarhistogram(direction,'Normalization','pdf','DisplayStyle','stairs')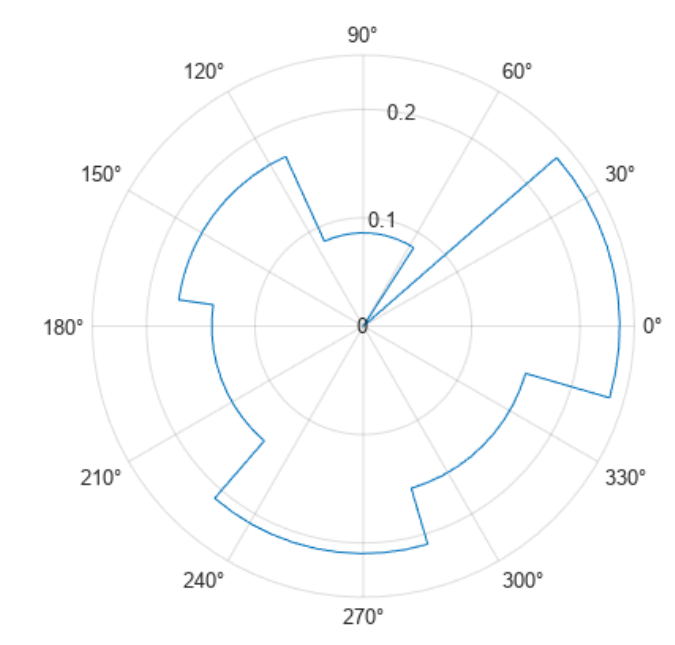
这篇关于matlab使用教程(49)—绘制极坐标图的文章就介绍到这儿,希望我们推荐的文章对编程师们有所帮助!


